ISSN 0104-6632 Printed in Brazil
www.abeq.org.br/bjche
Vol. 28, No. 02, pp. 197 - 207, April - June, 2011
Brazilian Journal
of Chemical
Engineering
BIOLOGICAL NITROGEN REMOVAL OVER
NITRITATION/DENITRITATION USING
PHENOL AS CARBON SOURCE
L. M. Queiroz
1, M. V. Aun
2, D. M. Morita
2and P. Alem Sobrinho
2*1Universidade Federal da Bahia, Escola Politécnica, Departamento de Engenharia Ambiental,
Rua Aristides Novis 02, Federação, CEP: 40210-630, Salvador - Bahia, Brasil. E-mail: [email protected]
2Universidade de São Paulo, Escola Politécnica, Departamento de Engenharia Hidráulica e Sanitária,
Phone:+ (55) (11) 3091-5296, Av. Professor Almeida Prado 271, Trav. 2 , Butantã, CEP: 05508-070, São Paulo - SP, Brasil. E-mail: [email protected]; [email protected];
*
E-mail: [email protected]
(Submitted: December 7, 2009 ; Revised: December 1, 2010 ; Accepted: January 27, 2011)
Abstract - A laboratory scale activated sludge sequencing batch reactor was operated in order to obtain total removal of influent ammonia (200; 300 and 500 mg NH3-N.L-1) with sustained nitrite accumulation at the end of
the aerobic stages with phenol (1,000 mg C6H5OH.L-1) as the carbon source for denitrifying microorganisms
during the anoxic stages. Ammonia removal above 95% and ratios of (NO2
--N / (NO2
--N + NO3
--N)) ranging from 89 to 99% were obtained by controlling the dissolved oxygen concentration (1.0 mg O2.L-1) and the pH
value of 8.3 during the aerobic stages. Phenol proved to be an adequate source of carbon for nitrogen removal via nitrite with continuous feeding throughout part of the anoxic stage. Nitrite concentrations greater than 70.0 mg NO2
-N.L-1 inhibited the biological denitritation process. Keywords: Ammonia; Phenol; Nitritation; denitritation.
INTRODUCTION
Biological nitrification/denitrification is the process most used for nitrogen removal from wastewaters. Nitrification is carried out in two steps. First, ammonia (NH3) is converted to nitrite (NO2-)
by ammonia-oxidizing bacteria (AOB). For 1 mol of ammonia, AOB use 1.5 mol of oxygen. In the second step, nitrite-oxidizing bacteria (NOB) convert nitrite
to nitrate (NO3-) using 0.5 mol of oxygen.
Denitrification is an anoxic process whereby NO3- is
converted to nitrogen gas (N2) by heterotrophic
microorganisms using a carbon source as electron donor. Denitrifying bacteria have been shown to use a wide array of organic compounds, including methanol, ethanol, organic acids and aromatic compounds.
Recently, new biological systems have been developed as an alternative to conventional biological nitrification/denitrification. These systems stop nitrification at the nitrite stage (nitritation), followed directly by reduction to N2 in anoxic
conditions with carbon addition (denitritation). Nitritation/denitritation is attractive because it saves 25% of the total oxygen required which means an important economy of total energy consumption at the wastewater treatment plant. Other advantages of this process are a biological nitrogen reduction rate 63% higher than the conventional one, less biomass production and 40% reduction of the heterotrophic carbon demand (Phillips et al., 2002; Fux and Siegrist, 2004; Fux et al., 2006).
198 L. M. Queiroz, M. V. Aun, D. M. Morita and P. Alem Sobrinho
Brazilian Journal of Chemical Engineering
synthetic wastewater with a high ammonia concentration using phenol as a carbon source. A lab-scale activated sludge sequencing batch reactor (SBR) was used. The overall process efficiency was evaluated by submitting the biomass to three different influent ammonia nitrogen concentrations
(200; 300 and 500 mg NH3-N.L
-1
). The influent phenol concentration was constant (1,000 mg C6H5OH.L-1). Important operational conditions such
as feed, aeration and anoxic reaction time, cycle length and dissolved oxygen (DO) concentration were observed in order to better understand the relation between the pollutant removal efficiency and the SBR operation.
MATERIALS AND METHODS
Experimental Setup
An acrylic lab-scale activated sludge reactor with a working volume of 20 liters and total volume of 25 liters (250 x 250 x 500 mm and a wall thickness of 3.0 mm) was used. The reactor (Figure 1) was seeded with sludge coming from a nitrifying activated sludge pilot plant located at the Hydraulic Technology Center of the Polytechnic School, University of São Paulo.
An aeration pump (Millipore High Output Pump) was used for air supply and to keep the sludge
suspended during the aerobic stages. The airflow rate (0.05–1.0 L.min.-1) was measured by a calibrated rotameter. The air was dispersed by bubble air diffusers located at the bottom of the reactor. Dissolved oxygen concentration was monitored by a portable meter with a membrane electrode (YSI – 55S) permanently submerged in the reactor content. During anoxic stage, mixing was provided by a mechanical stirrer (Nova Ética – 105RS). Feeding was performed by means of a peristaltic pump (Watson-Marlow - maximum discharge of 1.0 liter per hour). Initially, the temperature was controlled at 35 ± 2°C by using aquarium heaters, but after the beginning of the second phase the controller was suppressed and the treatment cycles were conducted at room temperature (25± 2°C).
The pH was automatically monitored (Prominent, Dulcometer D1C) and controlled by adding a solution of 40g.L-1 of NaOH as pH buffer.
Phenolic synthetic wastewater was used with an ammonia nitrogen concentration of 200; 300 and 500 mg NH3-N.L-1. It was prepared by dissolving the
chemical compounds in five liters of distilled water immediately before the beginning of each treatment cycle. The synthetic wastewater composition is presented in Table 1. Its composition in terms of macronutrients was suggested by APHA, AWWA, WEF (2005). A micronutrient stock solution, adapted from Ruiz et al. (2003), was added at a proportion of 1 ml.L-1 of synthetic wastewater.
Aquarium air bubble diffusers
Timer Timer
pH controller
Mechanical stirrer DO metter
air pump
peristaltic pump
Sy wastewa
Sodium hydroxide solution recipient Automatic
dosing pump Synthetic wastewater
recipient
Table 1: Synthetic wastewater and trace nutrient solution composition.
Product Concentration Resulting Element Concentration
Synthetic wastewater
Phenol 1,000 mg.L-1 1,000 mg.L-1
757.1 mg.L-1 200 mg NH3-N.L-1
1,135.7 mg.L-1 300 mg NH3-N.L-1
NH4Cl
1,892.9 mg.L-1 500 mg NH 3-N.L-1
(MgSO4.7H2O) 325.0 mg.L-1 65.0 mg Mg.L-1
KH2PO4 442.0 mg.L-1 100.0 mg P.L-1
FeSO4.4H2O 69 mg.L-1 17.2 mg Fe.L-1
CaCl2 53.5 mg.L-1 19.2 mg Ca.L-1
Trace nutrient solution
((NH4)6Mo7O24.2H2O) 7.3 µg.L-1 2.9 µg Mo.L-1
MnCl2 264 µg.L-1 115 µg Mn.L-1
(ZnSO4.7H2O) 7.1 µg.L-1 1.6 µgZn.L-1
CoCl2 0.8 µg.L-1 0.4 µgCo.L-1
CuCl2 0.09 µg.L-1 0.04 µgCu.L-1
(Na2.EDTA.2H2O) 300 µg.L-1 234 µg EDTA.L-1
System Operation
During the first and second phase of the experiment, the treatment cycles were conducted twice a week. However, during the third phase the total length of cycles was 72 hours and it was only possible to perform one cycle per week. The operational strategy (Figure 2) was developed to attain total NH3-N oxidation with sustained nitrite
accumulation at the end of the aerobic stages and assure the use of phenol as carbon source for denitrifying microorganisms during the anoxic stages.
Two operational aspects should be highlighted. First, the SBR was operated in fed-batch mode in order to avoid phenol or ammonia shock loads and, consequently, toxic effects on biomass. Secondly, it should be mentioned that the supernatant discarded at the end of the treatment cycles presented a high
NO2--N concentration and, for a full-scale
application, it would require a post-treatment in order to meet the Brazilian pollution limits for discharge into water bodies.
The influent volume gradually delivered to the reactor at the beginning of each treatment cycle was 5.0 (five) liters, whereas the same volume was drawn at the end of the cycle. The volume of biological sludge used was equal to 15.0 (fifteen) liters and the only sludge discarded was that necessary for physical-chemical analysis. Hence, the volumetric exchange ratio was about 25%. At stable operational conditions, this means that 75 % of the total influent ammonia nitrogen load will be converted to molecular nitrogen (N2) and 25% will require further
treatment. But, even with this configuration, SBR presents advantages such as absence of recirculation
and smaller area to implement a treatment plant when compared to a conventional activated sludge system.
Biological ammonia oxidation is pH-sensitive and nitrification rates decline significantly at pH values below 6.8. Since the synthetic wastewater does not have enough alkalinity to sustain the biological process, a sodium hydroxide solution (1.0 mol.L-1) was added. Preliminary batch-tests conducted in a lab-scale activated sludge reactor fed by the same synthetic wastewater (Queiroz et al., 2008) indicated a stable nitritation at a DO concentration equal to 1.0 mg O2.L-1 and a pH value of 8.3. Therefore, these
operational conditions were maintained during the whole study period.
Initially, the temperature was controlled at 35 ± 2°C, since AOB grows twice as fast as NOB at 35°C (Grunditz and Dalhammar, 2001). But, in most cases, the temperature is not susceptible to be modified or controlled in full-scale reactors, mainly for economic considerations. Hence, after the beginning of the second phase (about day 70) the controller was suppressed and the treatment cycles were conducted at room temperature (25 ± 2°C).
The investigation was divided into three phases, characterized by a gradual increase of influent ammonia nitrogen (200; 300 and 500 mg NH3-N.L-1),
while influent phenol concentration was kept constant (1,000 mg C6H5OH.L-1) during the whole
200 L. M. Queiroz, M. V. Aun, D. M. Morita and P. Alem Sobrinho
Brazilian Journal of Chemical Engineering
Figure 2: Chronological sequence of the treatment cycles.
1. The concentration of NO2--N in the reactor content was that from the previous cycle.
2. The mass of phenol that was not consumed during the anoxic stage (filling with anoxic reaction + anoxic reaction) was degraded during the aerobic stage.
Table 2: Operational conditions during the study phases.
Parameters Phase 01
(cycles 1 – 16)
Phase 02 (cycles 17 – 28)
Phase 03 (cycles 29 – 36)
Load of NH3-N (g NH3-N.d-1) 1.0 1.5 2.5
Load of Phenol (g C6H5OH. d-1) 5.0 5.0 5.0
Q (ml.min-1) 8.33 8.33 8.33
Temperature (°C) 35 ± 2ºC 25 ± 2ºC 25 ± 2ºC
pHaerobic stage 8.3 8.3 8.3
Aerobic stage (hours) 10 15 24
Filling with anoxic reaction (hours) 10 10 10
Anoxic reaction (hours) 0 14 38
Total anoxic stage1,2(hours) 10 24 48
Total cycle length (hours) 20 39 72
Volumetric application rate (mg C6H5OH.L-1.h-1)3 12.5 6.4 3.5
1 - During the anoxic stages, the pH value was just monitored. 2 - Anoxic stage = filling anoxic reaction + anoxic reaction. 3 - Considering the total cycle length.
1. Filling with anoxic reaction.
(Biological denitritation)1
2
4. Sedimentation and supernatant Discharge. 75% of the total nitrogen
load as NO2--N
25% of the total nitrogen load as NO2--N that will
require further treatment
Treatment Cycle
Synthetic phenolic wastewater gradual addition
2
3. Aerated Stage (NH - N oxidation and eventually phenol Consumption).
2. Anoxic reaction.
Analytical Methods
The samples were drawn from the reactor content every three hours during the treatment cycle. In order to determine the dissolved components, the aliquots were immediately filtered through a membrane (0.45µm cellulose paper filters - Whatman®) and analyzed according to Standard Methods (APHA, AWWA, WEF, 2005). Phenol was measured by a colorimetric method: phenolic compounds react with 4-aminoantipyrine in the presence of ferricyanide to produce a red reaction product and its absorbance is measured at a wavelength of 500 nm. Nitrite was quantified photometrically at 543 nm, nitrate was measured using the specific ion electrode and ammonia was quantified by titration after distillation. The method used to quantify the suspended solids was gravimetric; one aliquot was drawn from the reactor content at the beginning of each treatment cycle.
RESULTS
Start-Up
The reactor was operated in a fed-batch mode. Before the first treatment cycle, 1.0 liter of a solution
containing 500 mg NO2
--N.L-1 was added to the reactor content, creating an anoxic environment. Four liters of synthetic phenolic wastewater prepared according to Table 1 and containing 200 mg NH3-N.L-1
was gradually added (8.33 ml.min-1) to the reactor content and, at the end of the anoxic reaction (18 hours), phenol and nitrite removals reached 40% and 99%, respectively.
The first aerobic stage lasted 15 hours and, at the end, the (NO2--N/(NO2--N + NO3--N)) ratio was 0.65.
Despite the excellent NH3-N removal efficiency
(92%), the result showed that part of the nitrite oxidized to nitrate.
Before starting the next aerobic stage, the rotameter was calibrated and adjusted in such a way that the maximum DO concentration would be 1.0 mg O2.L-1.
Furthermore, the duration of the aerobic stage was reduced to 10 hours because the stress on NOB can be reduced if the aeration period is too long (Phillips et al., 2002; Guo et al., 2008). These operational adjustments gave a significant result for the (NO2
--N / (NO2--N + NO3--N)) ratio, which reached 97%.
It was concluded that, to guarantee a stable nitritation during the whole period, the pH value should be controlled within a narrow range of values and the aeration time should be just that required for ammonia oxidation.
Nitritation/Denitritation Process
During the aerobic stage of the treatment cycles, the process strategy of sustained nitrite accumulation was to improve the conditions for ammonia-oxidizing bacteria (AOB) growth and suppress the activity of nitrite-oxidizing bacteria (NOB). Furthermore, Anthonisen et al. (1976) concluded that accumulation of ammonia and nitrite in biological systems could be the result of inhibition of AOB or NOB by free ammonia (FA) and unionized nitrous acid (FNA). Higher pH values could decrease the NOB activity because, with increasing pH, the ammonia equilibrium will shift to a prevalence of FA in the reactor content.
The maintenance of a pH value of 8.3 during the aerobic stages, together with a maximum DO concentration (1.0 mg O2.L-1) and a suitable aerated
stage time, allowed obtaining (NO2--N / (NO2--N +
NO3--N)) ratio values higher than 95% during the
cycles conducted with an influent concentration of about 200 mg NH3-N.L-1. This operational strategy
was maintained during the subsequent phases of the research. The aeration stages were stopped when a set-point of ammonia nitrogen concentration was
fulfilled (about 95% of influent NH3-N load
oxidized) which means that the effluent NH3-N
concentration ranged between 0.5 and 6.9 mg NH3-N.L-1
during the whole study period. It should be mentioned that nitrate concentration rouse at the end of the aerobic stage during the two first cycles of the third phase. This phenomenon was probably due to a calibration problem presented by the electronic timer that controlled the aeration pump. The extent of the aerobic stage of these two cycles was 30 hours.
Figure 3 shows the ammonia nitrogen removal and also the different forms of nitrogen during the aerobic stages of the treatment cycles.
202 L. M. Queiroz, M. V. Aun, D. M. Morita and P. Alem Sobrinho
Brazilian Journal of Chemical Engineering
(a)
(b)
Figure 3: (a) NH3-N; NO2--N and NO3--N concentrations during the aerobic stage of the treatment
cycles. (b) Influent NH3-N concentrations and ammonia nitrogen removal during the whole study
(a)
(b)
Figure 4: (a) Efficiencies of phenol removal at the end of the anoxic stages and phenol concentrations during the treatment cycles. (b) NO2--N; NO3--N concentrations (anoxic stage) and VSS concentrations
204 L. M. Queiroz, M. V. Aun, D. M. Morita and P. Alem Sobrinho
Brazilian Journal of Chemical Engineering
The phenol that was not consumed by heterotrophic microorganisms during the anoxic stages was biologically removed during the subsequent aerobic stage without impacting the nitritation process. Phenol in all effluent samples (after aerobic stages) was below the detection limit of 1.0 mg.L-1.
During the third phase, the results of analyses of aliquots drawn from the reactor content at the end of anoxic stages indicated that the removals of NO2--N
and phenol were below 25% and 15%, respectively. These results showed an inhibition of the denitritation process with nitrite accumulation and a treatment system unbalance. Table 3 shows the main results of the nitritation/denitritation process during the whole study period.
DISCUSSION
Conditions for Nitrite Predominance
During the three phases of the study, nitrite was the dominant oxidized nitrogen form at the end of all aerobic stages. Although the free ammonia concentrations in the aerobic stages of the treatment cycles were within the range determined by Anthonisen et al. (1976) as inhibiting for nitrite
oxidizing bacteria (0.1 to 1.0 mg NH3.L -1
), this was not the only factor in establishing a stable nitritation. Due to the long-term reactor operation, NOB could adapt to an inhibitory free ammonia concentration, as suggested by other researchers (Bae et al., 2002; Fux and Siegrist, 2004; Ruiz et al., 2003). In fact, stable nitritation was achieved with the maintenance of a
maximum DO concentration of 1.0 mgO2/L, a pH
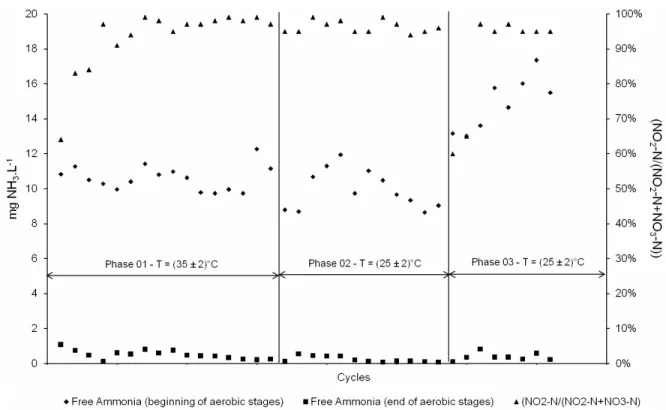
value of 8.3 and the adjustment of the aeration time required for ammonia oxidation. Figure 5 shows the free ammonia concentrations and (NO2--N / (NO2--N
+ NO3--N)) ratios in the aerobic stages during the
whole study period.
During the third phase of the investigation (influent ammonia nitrogen = 500 mg NH3-N.L
-1
), the minimum free ammonia concentration in the
reactor content was 13.0 mg NH3.L-1 at the
beginning of the aerobic stages. Anthonisen et al. (1976) observed that a free ammonia concentration above 10.0 mg NH3.L-1 inhibits all nitrification
process. Contrary to these findings, our research showed that, even with free ammonia concentrations equal to 17.3 mg NH3.L-1 (maximum value during
the whole study), no imbalance was observed during nitritation. These results are in agreement with Jenicek et al. (2004), who successfully removed ammonia via nitrite even at free ammonia concentrations varying from 14.0 to 32.0 mg NH3.L
-1
.
Table 3: Summary of results.
PARAMETERS Phase 01
(cycles 1 – 16)
Phase 02 (cycles 17 – 28)
Phase 03 (cycles 29 – 36) Volumetric nitritation rate
(kg NH3-N. m-3. d-1) 0.096 - 0.114 0.112 - 0.119 0.118 - 0.124
Volumetric denitritation rate
(kg NO2--N. m-3 .d-1) 0.091 - 0.111 0.068 - 0.071 not observed 1
Removal of NH3-N
(%) 89 - 96 95 - 98 95 - 99
Phenol removal during anoxic stage
(%) 42 - 51 60 - 65 not observed
1
oxidized N removal
(%) 92 - 100 98 - 100 not observed
1
kg of phenol consumed
kg of oxidized N removed 2.7 - 3.4 2.9 - 3.1 not observed
1
Volumetric phenol removal rate during anoxic stage
(kg C6H5OH. m-3 .d-1) 0.281 - 0.306 0.148 - 0.163 not observed 1
Maximum Free Ammonia concentration (mg NH3.L-1)2
12.3 11.9 17.3
Minimum Free Ammonia concentration (mg NH3.L-1)3
0.1 0.1 0.2
Maximum unionized acid nitrous concentration
(mg HNO2.L-1)3 0.0014 0.0028 0.0045 1 - Denitritation was inhibited during the third phase of the study.
Figure 5: NO2--N / (NO2--N + NO3--N) and concentrations of free ammonia at the end of the aerobic
stage of the treatment cycles.
Although other researchers (Phillips et al., 2002; Fux e Siegrist, 2004; Jenicek et al., 2004) concluded
that the maintenance of sustained NO2
--N accumulation in biological activated sludge systems depends on the adoption of high temperatures (theoretically, the specific growth rate of NOB decreases above 35oC), we found that, even when the SBR operated at temperatures that are considered favorable to nitrite oxidizers (T < 25ºC), the presence of nitrate was not observed.
The amount of air consumed during the process is an important design factor because energy consumption of the air supply system accounts for a high percentage of the total energy demand in wastewater treatment plants. Therefore, the achievement of high removal efficiencies of ammonia nitrogen (89 - 99%) at low DO concentrations is certainly an advantage of the process. On the other hand, for full-scale application, a high level of automation (ammonia sensors, controls, and software) will be required to guarantee the nitritation process stability.
Biological Removal of Phenol with Nitrite as Electron Acceptor During the Anoxic Stage
Since the beginning of the research, phenol was degraded without a lag phase and proved adequate as
a single carbon source for heterotrophic biomass. This performance is probably associated with the inoculum, which originated from a nitrifying pilot activated sludge plant that has treated a phenolic wastewater under aerobic conditions for almost three years. Blaszczyk et al. (1998) also studied phenol biodegradation under denitrifying conditions and, at higher concentrations (up to 1,000 mg.L-1), the activity of heterotrophic biomass was preceded by a lag phase of 9 to 5 days.
The volumetric application rates were within the range of 0.25 e 0.3 g C6H5OH L-1 .d-1 and the
Food/Microorganisms (F/M) ratios were 0.07 to 0.13 g phenol. g VSS-1.d-1. Blaszczyk et al. (1998) concluded that phenol biodegradation under anoxic conditions is less efficient when its concentration
increases (from 200 to 2,000 mg .L-1) or the
temperature decreases (from 30 to 13°C). During the present work, the same conclusions were obtained. The first phase of the experiment was conducted at 35 ± 2°C and the volumetric phenol removal rate during the anoxic stage was within the range of 0.281 to 0.306 kg C6H5OH. m-3 .d-1. On the other
hand, during the second phase (conducted at 25 ± 2°C), the rate was within the range of 0.148 to 0.163 kg C6H5OH. m-3 .d-1.
206 L. M. Queiroz, M. V. Aun, D. M. Morita and P. Alem Sobrinho
Brazilian Journal of Chemical Engineering
with a nitrogen concentration in synthetic wastewater equal to 500 mg NH3-N.L-1 presented concentrations
between 76.0 and 98.0 mg NO2--N. L-1 at the
beginning of the anoxic stage. Sogame et al. (1996), studying the feasibility of using ammoniacal liquor (rich in phenol) generated at the coke-oven plant as a source of carbon for denitrification, verified the instability of the biological process when the concentration reached 50.0 mg NO2--N. L-1 in the
reactor content. Chung and Bae (2002), investigating the denitritation behavior, found 50.0 mg NO2--N. L-1
as the limit value for nitrite concentration in the reactor content, but they called attention to the possibility of well-adapted microorganisms withstanding and degrading large nitrite concentrations.
The nitrite concentrations at the beginning of the anoxic stage (influent ammonia nitrogen concentrations equal to 300 mg NH3-N.L-1) ranged
from 59.0 to 70.0 mg NO2--N. L-1 and did not inhibit
denitritation. With these findings, it can be concluded that concentrations higher than 70 mg NO2--N. L-1 possibly inhibited the activity of
phenol-degrading denitrifying microorganisms.
Using the values obtained for the ratio of mg phenolconsumed / mg NO2--Nremoved during the anoxic
stage of the treatment cycles that did not present inhibition of the denitritation process and the theoretical COD value of phenol (CODtheoretical = 2.4 g
COD/g phenol), it was possible to obtain a mean value of 6.5 mg CODconsumed /mg NO2--Nremoved
during the denitritation process. Therefore, our result is in agreement with those found by other researchers (Chung and Bae, 2002; Choi et al., 2004), who concluded that, to attain high efficiencies of biological removal of nitrogen via nitrite, the ideal ratio of CODconsumed /NO2--Nremoved must be above 6.0.
CONCLUSIONS
The results of this study led to the following conclusions:
Phenol at concentrations close to 1,000 mg
C6H5OH .L-1 proved adequate as the single source of
carbon for nitrogen removal via nitrite with continuous feeding throughout part of the anoxic stage, using volumetric application rates within the range of 0.25 to 0.30 g C6H5OH.L
-1
.d-1.
Concentrations greater than 70.0 mg NO2-N. L-1
in the reactor content inhibited the use of phenol as a source of carbon for heterotrophic biomass under anoxic conditions.
The maintenance of a maximum DO concentration
of about 1.0 mg O2.L -1
, a pH value of 8.3 and the
adjustment of the aeration time required for ammonia oxidation provided (NO2--N / (NO2--N + NO3--N))
ratios that varied from 89 to 99%.
ACKNOWLEDGEMENTS
The authors would like to thank FAPESP (The State of São Paulo Research Foundation) for financial and material support.
NOMENCLATURE
Symbols
N Nitrogen (Chemical Element)
N2 Nitrogen gas
NH3 Free ammonia
NH3-N Ammonia nitrogen
NO2--N Nitrite Nitrogen
NO3--N Nitrate Nitrogen
NOx-N
Q Flow
Abbreviations
AOB ammonia-oxidizing bacteria
COD Chemical Oxygen Demand
DO Dissolved Oxygen
EDTA Ethylenediamine tetraacetic acid
FA Free ammonia
FNA Free nitrous acid
F/M Food Microorganism Ratio
NOB Nitrite-oxidizing bacteria
SBR Sequencing Batch Reactor
USEPA United States Environmental Protection Agency
VER Volumetric Exchange Ratio
VSS Volatile Suspended Solids
REFERENCES
Anthonisen, A. C., Loehr, R. C., Prakasam, T. B. S. and Srinath, E. G., Inhibition of nitrification by ammonia and nitrous acid. Journal of Water Pollution Control Federation, 48, No. 5, 835 (1976).
Bae, W., Baek, S., Chung, J. and Lee, Y., Optimal operational factors for nitrite accumulation in batch reactors. Biodegradation, 12, 359 (2002). Blaszczyk, M., Przytocka-Jusiak, M., Suszek, A. and
Mielcarek, A., Microbial degradation of phenol in denitrifying conditions. Acta Microbiology, 47, No. 1, 65 (1998).
Choi, E., Yun, Z. and Chung, T. H., Strong nitrogenous and agro-wastewater: current technological overview and future direction. Water Science and Technology, 49, No. 5, 1 (2004).
Chung, J. and Bae, W., Nitrite reduction by a mixed culture under conditions relevant to shortcut biological nitrogen removal. Biodegradation, 13, 163 (2002).
Eiroa, M., Vilar, A., Amor, L., Kennes, C. and Veiga, M. C., Biodegradation and effect of formaldehyde and phenol on the denitrification process. Water Research, 39, No. 3, 449 (2005). Fux, C. and Siegrist, H., Nitrogen removal from
sludge digester liquids by nitrification/ denitrification or partial nitritation/anammox: environmental and economical considerations. Water Science and Technology, 50, No. 10, 19 (2004).
Fux, C., Velten, S., Carozzi, V., Solley, D. and Keller J., Efficient and stable nitritation and denitritation of ammonium-rich sludge dewatering liquor using an SBR with continuous loading. Water Research, 40, No. 14, 2765 (2006).
Grunditz, C. and Dalhammar, G., Development of nitrification inhibition assays using pure cultures of Nitrosomonas and Nitrobacter. Water Research, 35, No. 2, 433 (2001).
Guo, X., Kim, J. H., Behera, S. K. and Park, H. S., Influence of dissolved oxygen concentration and aeration time on nitrite accumulation in partial
nitrification process. International Journal of Environmental Science and Technology, 5, No. 4, 527 (2008).
Hanaki, K., Wantain, C. and Ohgaki, S., Nitrification at low levels of dissolved oxygen with and without organic loading in a suspended-growth reactor. Water Research, 24, No. 3, 297 (1990). Jenicek, P., Svehia, P., Zabranska, J. and Dohanyos,
M., Factors affecting nitrogen removal by nitritation/denitritation. Water Science and Technology, 49, No 5-6, 73 (2004).
Philips, S., Laanbroek, H. J. and Verstraete, W., Origin, cause and effects of increased nitrite concentrations in aquatic environments. Reviews in Environmental Science and Biotechnology, 1, 115 (2002).
Queiroz, L. M., Aun, M. V., Morita, D. M., Alem Sobrinho, P., The use of a sequencing batch reactor (SBR) for ammonia and phenol removal using nitrite as electron acceptor. 4th Sequencing Batch Reactor Conference. Roma (2008).
Randall, C. W., Barnard, J. L. and Stensel, H. D., Design and retrofit of wastewater treatment plants for biological nutrient removal. Technomic Publishing Company, Lancaster (1995).
Ruiz, G., Jeison, D. and Chamy, R., Nitrification with high nitrite accumulation for the treatment of wastewater with high ammonia concentration. Water Research, 37, No. 6, 1371 (2003).
Sarfaraz, S., Thomas, S., Tewari, U. K. and Iyengar, L., Anoxic treatment of phenolic wastewater in sequencing batch reactor, Water Research, 38, No. 4, 965 (2005).