ISSN 0104-6632 Printed in Brazil
www.abeq.org.br/bjche
Vol. 33, No. 01, pp. 59 - 71, January - March, 2016 dx.doi.org/10.1590/0104-6632.20160331s20150173
*To whom correspondence should be addressed
Brazilian Journal
of Chemical
Engineering
INHIBITION KINETICS DURING THE OXIDATION
OF BINARY MIXTURES OF PHENOL WITH
CATECHOL, RESORCINOL AND
HYDROQUINONE BY PHENOL ACCLIMATED
ACTIVATED SLUDGE
C. C. Lobo
1*, N. C. Bertola
1and E. M. Contreras
21
Centro de Investigación y Desarrollo en Criotecnología de Alimentos, (CIDCA), CONICET, Fac. de Cs. Exactas, UNLP. 47 y 116 (B1900AJJ), La Plata, Argentina.
Phone: + 54 221 4254853 E-mail: [email protected] 2
Instituto de Investigaciones en Ciencia y Tecnología de Materiales (INTEMA), CONICET-Mar del Plata, Av. Juan B. Justo 4302, (7600) Mar del Plata, Argentina.
(Submitted: March 16, 2015 ; Accepted: April 23, 2015)
Abstract - In this work the aerobic degradation of phenol (PH), catechol (CA), resorcinol (RE), hydroquinone (HY) and of the binary mixtures PH+CA, PH+RE, PH+HY by phenol-acclimated activated sludge was studied. Single substrate experiments show a Haldane-type dependence of the respiration rate on PH, RE and HY, while CA corresponded to the Monod model. Binary substrate experiments demonstrated that the presence of a second substrate only affected the kinetics, but not the stoichiometry of the oxidation of the compounds tested. While CA inhibited the oxidation of PH, PH inhibited the oxidation of RE and HY. A mathematical model was developed to represent the aerobic biodegradation of the phenolic compounds tested. The agreement between the proposed model and the experimental data indicates that the proposed model can be useful for predicting substrate and dissolved oxygen concentrations in bioreactors treating phenolic wastewaters.
Keywords: Phenolic compounds; Biodegradation; Respirometry; Activated sludge; Mathematical model.
INTRODUCTION
Due to the wide use of phenol and its derivatives, phenolic compounds are widespread in the environ-ment. Several physico-chemical methods, such as adsorption, Fenton, photo Fenton, or combinations of these techniques can be used to remove phenolic compounds from industrial wastewater (Houari et al., 2014; Wang et al., 2014). However, in some cases these treatments utilize expensive reagents and generate chemical sludges that are frequently toxic
(Inchaurrondo et al., 2014). Conversely, most bio-logical methods are simple to manage, utilize in-nocuous reagents (e.g., atmospheric oxygen), and produce biodegradable sludges. For these reasons, biological methods are widely used (Busca et al., 2008).
60 C. C. Lobo, N. C. Bertola and E. M. Contreras
Brazilian Journal of Chemical Engineering
presence of equalizer tanks, actual facilities operate under transient conditions. Because steady-state conditions are assumed when sizing continuous flow bioreactors, wastewater treatment plants are gener-ally designed with excess capacity to ensure the degradation under overload conditions. The utiliza-tion of biological processes for purificautiliza-tion of toxic wastewaters emphasizes the practical requirement of developing adequate mathematical models to be used for the design and operation of these processes under transient conditions. The knowledge of mi-crobial substrate utilization kinetics is important for the accurate prediction of the quality of the treatment process effluent. One key feature is the relationship between the concentrations of substrate and oxygen and their consumption rates (Arutchelvan et al., 2006; Kumar and Kumar, 2005; Nuhoglu and Yalcin, 2005). While the actual substrate consumption rate determines the size of bioreactors, knowledge of the oxygen uptake rate (OUR) is crucial for an appro-priate design of aeration devices. For example, ac-cording to Vanrollehem and Gillot (2002), aeration costs represent about 45% of the total operational cost (e.g., aeration, pumping and sludge treatment) in a typical activated sludge wastewater treatment plant. Therefore, accurate kinetic parameters help engineers to optimize operational conditions in order to meet discharge requirements while minimizing costs.
Batch and semicontinuous processes employing suspended or immobilized biomass were used to study the phenol degradation kinetics (Karigar et al., 2006; Nuhoglu and Yalcin, 2005; Orupõld et al., 2001; Tziotzios et al., 2005; Yoong et al., 2000). Several studies have also focused attention on the aerobic biodegradation of single phenolic com-pounds and their mixtures by activated sludge (Bajaj et al., 2008; Lepik and Tenno, 2011; Pramparo et al., 2012). Considering that the knowledge of OUR is crucial for an appropriate design of aeration devices, the aim of this work was a study of the aerobic degradation of phenol (PH), catechol (CA), resor-cinol (RE), hydroquinone (HY) and the binary mix-tures PH+CA, PH+RE, PH+HY by phenol-accli-mated activated sludge. A mathematical model was developed to describe the aerobic degradation of binary mixtures of PH with CA, RE and HY by phe-nol-acclimated activated sludge. The model was calibrated using respirometric profiles corresponding to single solutions of phenol (PH), catechol (CA), resorcinol (RE), and hydroquinone (HY). Then, the proposed model was validated using respirometric profiles corresponding to the binary mixtures of phe-nolic compounds.
MATERIALS AND METHODS
Chemicals and Reagents
Phenol (PH) (loose crystals, > 99%) and resorcinol (RE) (ACS reagent, > 99%) were obtained from Sigma (St. Louis, MO, USA). Catechol (CA) and hydroqui-none (HY) were analytical grade from Biomed Inc. (Aurora, Ohio). Dehydrated cheese whey was from Food S.A. (Villa Maipú, Argentina). All inorganic salts were commercial products of reagent grade from Anedra (San Fernando, Argentina).
Acclimation Procedure and Culture Conditions
Phenol-acclimated activated sludge was obtained from a laboratory scale (2.5 L) cylindrical semicon-tinuous fill and draw reactor. Aeration was provided at the bottom of the reactor through an air-stone us-ing two air pumps at 2 L min-1; the dissolved oxygen (DO) concentration was maintained above 4 mgO2 L-1. The reactor was fed with the following culture me-dium with PH as the sole carbon-limiting source (Nuhoglu and Yalcin, 2005): (NH4)2SO4 226 mg L-1, K2HPO4 500 mg L-1, KH2PO4 250 mg L-1 MgSO4.7H2O 25.2 mg L-1, MnSO4.H2O 2.52 mg L-1, CaCl2 2 mg L-1, FeCl3 1.2 mg L-1, phenol 300 mg L-1. The pH was adjusted to 7.0 ± 0.05 by adding a few drops of con-centrated solutions of NaOH or HCl. During this phase the solids retention time was 45 days to pre-vent the biomass washout. The reactor was moni-tored periodically by measurements of total sus-pended solids (TSS), soluble chemical oxygen de-mand (COD) consumption rate, and total phenols (TPh) consumption rate. The biomass was consid-ered to be acclimated to phenol when the specific consumption rates of COD and TPh were constant for at least two weeks. This phenol-acclimated acti-vated sludge was used in all further experiments.
Respirometric Assays
Inhibition Kinetics During the Oxidation of Binary Mixtures of Phenol with Catechol, Resorcinol and Hydroquinone 61
Brazilian Journal of Chemical Engineering Vol. 33, No. 01, pp. 59 - 71, January - March, 2016
solution M2 contained the following (g/100 mL): (NH4)6Mo7O24.4H2O 0.05, BO3H3 0.01, KI 0.01 (Lobo et al., 2013).
500 mL of washed activated sludge were poured into the respirometer. Agitation was provided by a magnetic stir-bar; the respirometer was continuously aerated by an air pump. Air was set to a stable flow rate (1.0 L min-1) using a high precision rotameter (Bruno Schilling model MB 60V, Argentina). The operation temperature was 20 ± 1 °C. Before the ad-dition of the tested compound, the oxygen mass transfer coefficient of the respirometer (kLa) and the endogenous oxygen uptake rate (OURend) were ob-tained using a non-steady state procedure (Lobo et al., 2014). According to the experimental conditions, such as biomass concentration and the compound tested, the kLa values employed ranged between 10 and 40 h-1. When a stable DO concentration was ob-tained, the respirometer was spiked with the tested compound and the dissolved oxygen concentration (C) was recorded as a function of time (t). The oxygen uptake rate associated with the substrate oxidation (OURex) was calculated from the DO mass balance in the respirometer:
L e ex
dC
k a C C OUR
dt (1)
where Ce is the DO concentration in the absence of an oxidizable substrate and C is the instantaneous DO concentration. From the DO profile as a function of time, OURex values can be obtained by solving Eq. (1) for OURex. Then the oxygen consumed (OC) during the oxidation of the tested compound can be calculated as follows:
t ex 0
OC
OUR dt (2)At a given time t = tf the substrate was depleted and OURex values returned to zero. Thus, the OC value at time tf corresponded to the total oxygen consumed (OCT) during the oxidation of the tested compound. In the case of repeated additions of one or more substrates, the cumulative oxygen consump-tion (Sum(OC)) was calculated as the sum over the individual OCT values. For all the tested compounds, abiotic control experiments (e.g., without biomass) were negative with regard to the oxygen consump-tion (data not shown).
Analytical Procedures
Total suspended solids (TSS, mg/L) were used as a measure of the biomass concentration in the
respi-rometer. Known sample volumes (8 mL in this work) were poured into pre-weighed centrifuge tubes, cen-trifuged and washed twice with distilled water, and incubated at 105 °C for 24h; the TSS of each sample was calculated as the difference between the final weight (dry sample + tube) and initial weight (tube alone) divided by the sample volume. Duplicate bio-mass measurements were performed to reduce ex-perimental errors; average and maximum relative errors for TSS were 4% and 13%, respectively. The DO concentration was measured using a YSI (model 5739) polarographic DO probe; data were acquired on a personal computer interfaced to a YSI (model 58) DO monitor at 1 measurement/sec.
Estimation of the Model Coefficients and Dynamic Simulations
Calculation of the coefficients of the mathemati-cal model proposed in this work and the dynamic simulations were performed using the software pack-age Gepasi 3 (Mendes, 1993). The routine LSODA (Livermore Solver of Ordinary Differential Equa-tions) was selected to integrate the system of differ-ential equations of the proposed model. The Multistart Optimization algorithm (with Levenberg-Marquardt local optimization) was selected to fit the proposed model to the experimental data. To describe the bio-logical start-up phenomenon, a first order correction factor was included (Contreras et al., 2008).
RESULTS AND DISCUSSION
Oxidation of Single Phenolic Compounds by Phe-nol-Acclimated Activated Sludge
62
F
p (3 k
F
re m 2
G ob (F th m sp te on
2
Figure 1: Typ henol (a,b) a 3) to (6)). Ex
La = 23 h-1, S
Figure 2: Typ esorcinol (a,b model (Eqs. (
.7 gTSS L-1,
Guisasola et btained duri Fig. 2b,d), in han 0.15 mM mentioned O
piked in the ested conditi n RE and HY
pical exampl and catechol xperimental c S0 = 0.91 mM
pical exampl b) and hydro (3) to (6)). E
kLa = 10 h -1
al., 2006). B ing the biod
n all cases t M (Fig. 2a,c) OURex peaks respiromete ons, the effe Y biodegrada
les of DO pro (c,d) by phe conditions: ( M.
les of DO pro oquinone (c, Experimental , S0 = 0.91 m
Because of t degradation o the DO valu ). The absenc s when RE er suggests t ect of the DO ation kinetics
C. C. Lobo, N
Brazilian Jou
ofiles (a,c) an enol-acclima (a,b) X = 3.1
ofiles (a,c) an d) by pheno
conditions: mM.
the low OU of RE and H ues were hig
ce of the abo and HY w that, within O concentrat
was negligib
N. C. Bertola and
urnal of Chemica
nd the corres ated activate
gTSS L-1, k
nd the corres ol-acclimated (a,b) X = 2.
URex HY gher ove were the tion ble.
Ox po
OU tur po vat
E. M. Contreras
al Engineering
sponding OU d sludge. Lin kLa = 19 h-1,
sponding OU d activated sl 1 gTSS L-1,
xidation of ounds by Ph
Figures 3 t URex profiles res of the tes
unds, respira ted sludge in
URex (b,d) du nes indicate S0 = 1.06 mM
URex (b,d) du ludge. Lines kLa = 14 h-1
Binary Mix enol-Acclim
to 5 show D s during the d ted compoun ation rates o n the presenc
uring the biod the propose M; (c,d) X =
uring the biod s indicate the , S0 = 0.91 m
xtures of Ph mated Activa
DO and the degradation nds. For all th of phenol-ac ce of PH, CA
degradation ed model (Eq = 1.3 gTSS L
degradation e fitted kinet mM; (c,d) X
henolic Com ated Sludge
correspondin of binary mi he tested com cclimated act A, RE and H
of qs. L-1,
of tic =
w nu d h ra su by w ad
F
ca ac
F
re ac
were approxim umber. In a emonstrated ad a negligib ates. Those a ubstrate (CA y 50% the b were 7.5 and
dditions of C
Figure 3: DO atechol (CA cclimated ac
Figure 4: DO esorcinol (RE
cclimated ac
Inhibition Kineti
Brazili
mately const a previous that repeate ble effect on authors also r A, RE) concen biodegradatio 8.0 mM, resp CA or RE we
O profile (a) , 0.45 mM), ctivated sludg
O profile (a) E, 0.45 mM) ctivated sludg
ics During the Ox
ian Journal of Ch
tant as a func work, Lobo ed additions n PH and H reported that ntrations nece on rate (IC50 pectively. Alt ere performe
and the corr and the mix ge. Dotted lin
and the corr ), and the mi ge. Dotted lin
xidation of Binary
hemical Engineer
ction of the t o et al. (20
of PH and H HY consumpt
t the cumulat essary to redu 0) of CA or
though repea d in the pres
responding O xture of phe nes indicate
responding O ixture of phe
nes indicate
y Mixtures of Ph
ring Vol. 33, No.
test 013) HY tion tive uce RE ated sent
wo con IC 20 of wh tox pre or
OURex (b) du enol (1.06 mM
each cycle o
OURex (b) du enol (1.06 mM
each cycle o
enol with Catech
01, pp. 59 - 71,
ork (Figs. 3 a ncentrations 50 correspond 13). Moreov
CA or RE hich could h xicity of thes esent work th
RE on their c
uring the biod M) and cate of addition of
uring the biod M) and resor of addition of
hol, Resorcinol an
January - March
and 4), maxi were 5.4 m ding to these ver, in the pr
was followe have a prot se compound
he effects of consumption
degradation echol (0.45 m
f substrates.
degradation rcinol (0.45 m f substrates.
nd Hydroquinone
h, 2016
imum cumul mM, which w e compounds esent work, ed by the ad
tective effec ds. For these
f repeated ad n rates were n
of phenol (P mM) (PH+CA
of phenol (P mM) (PH+R
lative substra was lower tha
s (Lobo et a every additio ddition of PH ct against th reasons, in th dditions of C negligible.
PH, 1.06 mM A) by pheno
PH, 1.06 mM RE) by pheno
63
ate an al., on H, he he CA
M),
ol-64 F hy p co sp co th re to se si du in li u to 4
Figure 5: DO ydroquinone henol-acclim
Figure 6a orresponding ponding to P orresponding hat obtained esult indicate o the binary
ented by the ingle compou
uring the fir ng to the mix ism of PH; fo es correspon o those obta
Figure 6: E oxidation of and PH alon OC1 = OC o
O profile (a) e (HY, 0.45 m mated activat
shows that t g to CA wer
H. However, g to the mix during the es that the O
mixture of P e sum of pro und. Moreov st phase of t xture PH+CA or this reason nding to the m ained during
Examples of o f: a) PH+CA ne (grey). Do of the first ph
and the corr mM), and the ted sludge. D
the maximum re higher th , the maximu xture PH+CA
addition of OURex profile
PH and CA c ofiles corresp ver, the resul the respirogr A, CA inhibit
n, the maxim mixture PH+ the addition
oxygen uptak (black) and otted lines ind hase, OCT = t
C. C. Lobo, N
Brazilian Jou
responding O e mixture of Dotted lines in
m OURex val an those cor um OURex va A was close CA alone. T e correspond cannot be rep ponding to e
lts suggest th ram correspo
ted the meta mum OURex v
+CA were cl n of CA alo
ke rate (OUR CA alone (gr dicate the tim total OC. Con
N. C. Bertola and
urnal of Chemica
OURex (b) du f phenol (1.06
ndicate each lues rre-alue e to This ding pre-ach hat, ond- abo- val-lose one. Ho cen the ph PH pro PH add cor 6b ox int rep ph
Rex, circles) an rey), b) PH+R me correspond
ntinuous line
E. M. Contreras
al Engineering
uring the biod 6 mM) and h h cycle of add
owever, beca ntration dimi e oxidation o hase of the re H. Figure 6b,c
ofiles corresp H+HY were a dition of PH rresponding t ,c shows tha idation of PH to two phases presents the hase correspon
nd oxygen co RE (black) a ding to the en
s represent th
degradation hydroquinon dition of subs
ause CA was inished below of PH; under
espirogram r c shows that t ponding to also close to H alone. Sim to the mixtur at the respiro H+RE or PH s. However, i
oxidation o nds to the ox
onsumed (OC and PH alone
nd of the first he proposed m
of phenol (P ne (0.45 mM)
strates.
actively oxi w a certain v r this conditio represents th the initial part the mixtures o those obtain milarly to the re PH+CA (F ograms obtain H+HY can a
in these case of PH, whil xidation of RE
C, dashed lin (grey), c) PH t phase of the model (Eqs.
PH, 1.06 mM ) (PH+HY) b
idized, its co value, allowin
on, the secon he oxidation
ts of the OUR s PH+RE an ned during th e respirogram Fig. 6a), Figu
ned during th also be divide es, the first pa le the secon E or HY.
nes) during th H+HY (black e respirogram
Inhibition Kinetics During the Oxidation of Binary Mixtures of Phenol with Catechol, Resorcinol and Hydroquinone 65
Brazilian Journal of Chemical Engineering Vol. 33, No. 01, pp. 59 - 71, January - March, 2016
Modelling the Oxidation of Single Substrates and Binary Mixtures of Phenolic Compounds
Among the various substrate inhibition models, the Haldane equation has been widely used to de-scribe the aerobic degradation kinetics of phenol and phenolic compounds (Christen et al., 2012; Lepik and Tenno, 2011; Pramparo et al., 2012). In the case of CA, Figure 1b suggests that the biodegradation rate obeyed a Monod-type equation with respect to CA within the tested concentrations. In addition, a similar expression is usually included to take into account the effect of the dissolved oxygen concentra-tion (C) on substrate and oxygen consumpconcentra-tion rates (Contreras et al., 2008; Guisasola et al., 2006). How-ever, due to the low OURex values obtained when RE or HY were tested (Fig. 2), the DO concentration had a negligible effect on RE and HY biodegradation rates. To represent the effect of an inhibitor on a given bioprocess, the noncompetitive inhibition model is one of the most used. For example, in the Activated Sludge Model No. 1 (ASM1) and its progeny (ASM2, ASM3), the inhibition of denitrification by dissolved oxygen is modelled using this approach (Gujer et al., 1999; Henze et al., 1987; Henze et al., 1999). Finally, it was assumed that, in the presence of several sub-strates, the oxygen consumption rate can be repre-sented by the sum of OUR corresponding to each substrate; moreover, the presence of a second sub-strate only affects the kinetics, but not the stoichi-ometry of the oxidation of the tested compounds.
Based on these considerations, the following ex-pressions for the consumption rates corresponding to PH (RPH), CA (RCA), RE and HY (RZ) and oxygen (OURex) were proposed:
PH SmPH 2
SPH
iPH
inPH/CA
O2PH inPH/CA
PH
R q
PH
K PH
K
K C
X
K C K CA
(3)
CA SmCA
SCA O2CA
CA C
R q X
K CA K C
(4)
inZ/PH
Z SmZ 2
inZ/PH S
iZ
K Z
R q X
K PH
Z
K Z
K
(5)
ex O/PH PH O/CA CA O/ Z Z
OUR Y R Y R Y R (6)
where,
Z represents RE or HY. The term inPH /CA
inPH/CA
K
K CA
in Eq. (3) corresponds to the inhibition of the PH oxidation due to the presence of CA, KinPH/CA being the inhibition constant. For a given CA concentra-tion, the lower the KinPH/CA value, the higher the inhi-bition; thus, a low KinPH/CA value indicates a strong inhibition of the oxidation of PH by CA. According to Figure 6, PH is oxidized first and then RE of HY.
For this reason, the term inZ/PH
inZ/PH
K
K PH
that
repre-sents the inhibition of the oxidation of Z (e.g., RE or HY) by PH was included in Eq. (5), KinZ/PH being the inhibition constant. Although the proposed model (Eqs. (3) to (6)) has 20 coefficients, 17 of them can be estimated based on the OURex profiles corre-sponding to the single compounds (Figs. 1 and 2). However, binary substrate respirometric experiments (Figs. 3 to 5) were necessary to evaluate the inhibi-tion constants KinPH/CA, KinRE/PH and KinHY/PH.
66 C. C. Lobo, N. C. Bertola and E. M. Contreras
Brazilian Journal of Chemical Engineering
Table 1: Kinetic coefficients corresponding to the aerobic degradation of phenol (PH), catechol (CA), resorcinol (RE) and hydroquinone (HY) by phenol-acclimated activated sludge (mean ± confidence interval at a 95% confidence level are reported)
qSm
(mmol gTSS-1 h-1)
KS
(mM)
Ki
(mM)
KO2
(mM)
YO/S
(mol/mol)
PH 1.82 ± 0.26 0.021 ± 0.004 2.1 ± 0.6 0.06* 1.52 ± 0.07
CA 7.40 ± 1.21 0.045 ± 0.030 n.a. 0.087 ± 0.018 0.87 ± 0.13
RE 0.26 ± 0.11 0.013 ± 0.004 3.6 ± 1.4 n.a. 2.04 ± 0.11
HY 0.20 ± 0.04 0.029 ± 0.010 1.7 ± 0.5 n.a. 2.05 ± 0.41
n.a.: not applicable * from Contreras et al. (2008)
The YO/S values obtained (Table 1) are in accord-ance with those reported by other authors (Divari et al., 2003; Lepik and Tenno, 2011; Lobo et al., 2013; Orupõld et al., 2001). Table 1 shows that, within the experimental error, 1.5 mol of oxygen is consumed by phenol-acclimated activated sludge during the oxidation of one mol of PH under the tested condi-tions. Taking into account that the activated sludge studied also readily oxidized CA, and that about 1 mol of oxygen is consumed per mol of CA oxidized (Table 1), it is concluded that, during the first oxida-tion step of PH to CA, only 0.5 mol of oxygen is consumed per mol of PH oxidized under the tested conditions.
Several authors report that the stoichiometry of PH oxidation by in vitro preparations of PHMO in the presence of NADPH is one mol of oxygen con-sumed per mol of PH oxidized, producing one mol of CA (Detmer and Massey, 1985; Enroth et al., 1998; Sejlitz and Neujahr, 1987). It must be pointed out that most of these studies were performed using a PHMO isolated from an eukaryote, the soil yeast Trichosporon cutaneum. However, activated sludge is mainly comprised of bacteria (Henze et al., 2002); thus, this difference could be the reason that the stoi-chiometric coefficient corresponding to the oxygen consumption during the oxidation of phenol to cate-chol obtained in this work was one half the value reported by other authors.
To represent the oxygen uptake rate (OUR) in the presence of more than one phenolic compound (Eq. (6)), it was assumed that the observed oxygen con-sumption rate is the sum of the OUR corresponding to each substrate. This hypothesis was tested as fol-lows. According to Lobo et al. (2013), in the case of repeated additions of a single substrate, the cumula-tive oxygen consumption (Sum(OC)) can be calcu-lated as the product between the cumulative substrate concentration (Sum(S)) and the corresponding oxida-tion coefficient (YO/S). In the case of binary mixtures, if both oxidation coefficients were not affected by the presence of the other substrate, the cumulative
oxygen consumption (Sum(OC)) corresponding to a binary mixture composed of PH and a given com-pound S can be calculated as follows:
calc O/PH
O/S
Sum OC Y Sum PH Y Sum S (7)
where S represents CA, RE or HY, YO/PH is the PH oxidation coefficient, and YO/S corresponds to the oxidation coefficient of CA, RE or HY. Figure 7 shows that using the oxidation coefficients depicted in Table 1, Eq. (7) satisfactorily predicts the oxygen consumed due to the oxidation of the tested phenolic compounds and of the binary mixtures composed of PH and CA, RE or HY. Additionally, 78% of the calculated Sum(OC) values using Eq. (7) were within ±15% of the experimental values, with -19% and +26% being the minimum and maximum rela-tive deviations, respecrela-tively. These results indicate that, within the experimental errors, oxidation coeffi-cients corresponding to PH, CA, RE, and HY can be considered to be independent with respect to the presence of another phenolic compound in a binary mixture, confirming the validity of Eq. (6).
Figure 6a suggests that, for the mixture PH+CA, CA was metabolized first and then PH. For this rea-son, an inhibition term of PH consumption due to the presence of CA was included in Eq. (3). To evaluate the inhibition constant KinPH/CA, the fraction of PH that was consumed during the first phase of the respi-rogram corresponding to the binary mixture PH+CA was calculated as follows. According to Figure 7, the oxidation coefficients corresponding to the single compounds were not affected by the presence of a second phenolic compound. Thus, the oxygen con-sumed (OC) during the oxidation of the binary mix-ture PH+CA can be calculated as follows:
O/PH 0 O/CA 0
OCY PH PH Y CA CA (8)
re su
O
lo
O
F
(S re id
eached when umed:
T O/PH
OC Y
The ratio b owing expres
O/PH T
Y OC
OC
Figure 6a
Figure 7: Cu Sum(S)) cor epresent Eq. dentity line; d
Inhibition Kineti
Brazili
n both comp
HPH0YO/SC
between Eqs ssion:
H 0
O/PH 0
PH PH
Y PH
a suggests th
umulative ox rresponding
(7) using the dashed lines
ics During the Ox
ian Journal of Ch
pounds are c
0
CA
s. (8) and (9)
O/CA
0 O/CA
Y C
Y CA
hat the first
ygen consum to the mixtu e oxidation c
represent ±1
xidation of Binary
hemical Engineer
completely c
) yields the f
0 0
CA CA
A
(
t phase of
mption (Sum ures a) PH+ coefficients d 15% of the e
y Mixtures of Ph
ring Vol. 33, No.
on-(9)
fol-10)
the
res the CA acc con and
O O
wh end
m(OC)) as a f +CA, b) PH
depicted in T xperimental
enol with Catech
01, pp. 59 - 71,
spirogram re e first phase A was compl cording to E nsumption c d OCT is:
O/ PH 1
T O
Y OC
C Y
here PH1 rep d of the first
function of t +RE and c) Table 1. Cont
value.
hol, Resorcinol an
January - March
epresents the ended at t = letely consum Eq. (10), the
correspondin
0 1O/ PH 0
PH PH
PH Y
presents the c phase of the
the cumulati ) PH+HY. G tinuous lines
nd Hydroquinone
h, 2016
e oxidation = t1, it can be med (i.e., CA
ratio betwee ng to the firs
O/CAO/CA 0
Y CA
Y CA
concentration e respirogram
ive substrate Grey planes in b, d and e
of CA; whe e assumed th
A1 0). Thu en the oxyge st phase (OC
0
A
(1
n of PH at th m.
concentratio in a, c and e represent th
67
en hat us, en C1)
1)
he
68 C. C. Lobo, N. C. Bertola and E. M. Contreras
Brazilian Journal of Chemical Engineering
Rearranging Eq. (11), the fraction of PH con-sumed during the first phase of the respirogram (fPH1) during the oxidation of the binary mixture PH+CA can be calculated as follows:
0 1 1
PH1
0 T
O/CA 0 1
O/PH 0 T
PH PH OC
f
PH OC
Y CA OC
1
Y PH OC
(12)
With regard to the mixtures PH+RE and PH+HY, Figure 6b,c suggests that the first phase of these respirograms corresponded to the oxidation of PH; thus, it can be assumed that at t = t1 (i.e., the end of the first phase), PH was completely consumed (PH1
0). Using a similar procedure, it can be demon-strated that the fraction of RE or HY consumed dur-ing the first phase of the respirogram (fZ1) corre-sponding to the oxidation of the binary mixture PH+RE or PH+HY is:
0 1 1 O/PH 0 1
Z1
0 T O/ Z 0 T
Z Z OC Y PH OC
f 1
Z OC Y Z OC
(13)
where Z0 represents the initial concentration of RE or HY, and Z1 is the concentration of the compound Z (RE or HY) at the end of the first phase of the respi-rogram.
Based on the respirograms shown in Figures 3 to 5, the OC1 and OCT values corresponding to the tested binary mixtures were obtained. Then, using Eqs. (12) and (13) with the stoichiometric coefficients depicted in Table 1, the fractions of PH and RE (or HY) con
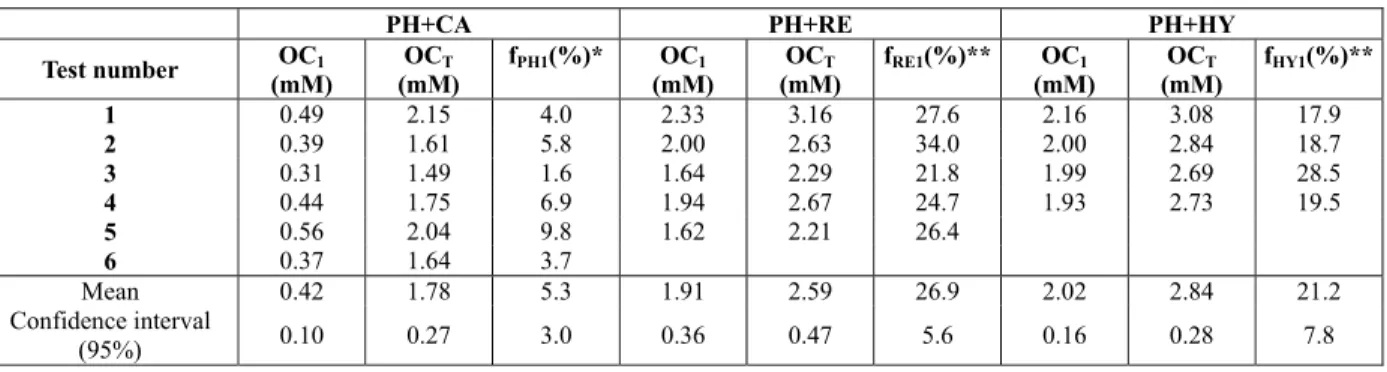
sumed during the first phase of the respirogram (fPH1, fZ1) were calculated. Table 2 shows that, in the case of the mixture PH+CA, the consumption of PH dur-ing the first phase of the respirogram (fPH1) was about 5% of the initial concentration, confirming that this part mainly reflected the oxidation of CA. In the case of the mixtures PH+RE and PH+HY, the frac-tions of RE and HY degraded during the first phase of the respirograms (fZ1) were 27% and 21%, respec-tively.
Once these fractions (fPH1, fZ1) were obtained (Ta-ble 2), the inhibition constants KinPH/CA, KinRE/PH and KinHY/PH were estimated as follows. For example, in the case of the binary mixture PH+CA, a set of simu-lations was performed using the proposed model (Eqs. (3) to (6)) with the coefficients depicted in Table 1 and assuming different KinPH/CA values. Then, for each assumed KinPH/CA value, the PH consumed during the first part of the simulated respirograms (PH1) was evaluated. Finally, the obtained PH1 val-ues were plotted as a function of KinPH/CA (Fig. 8a). According to the experimental results depicted in Table 2, PH1 was about 5%. From the comparison between the experimental and simulated PH1 values, it was concluded that the KinPH/CA value was about 0.03 mM (Fig. 8a). Based on a similar procedure, the estimated KinRE/PH and KinHY/PH values were 0.21 and 0.18 mM, respectively (Fig. 8b,c). Using these inhi-bition constants along with the kinetic coefficients shown in Table 1, Eqs. (3) to (6) were used to simu-late the OURex profiles corresponding to the tested binary mixtures. Figure 6 shows that the model pro-posed in the present work adequately describes the oxygen consumption during the oxidation of binary mixtures of phenolic compounds by phenol-acclimated activated sludge.
Table 2: Oxygen consumption during the first phase of the respirogram (OC1), total oxygen consumption
(OCT) and fraction of PH and RE (or HY) consumed during the first phase of the respirograms shown in
Figures 3 to 5 corresponding to the binary mixtures studied.
PH+CA PH+RE PH+HY Test number OC1
(mM)
OCT
(mM)
fPH1(%)* OC1
(mM)
OCT
(mM)
fRE1(%)** OC1
(mM)
OCT
(mM)
fHY1(%)**
1 0.49 2.15 4.0 2.33 3.16 27.6 2.16 3.08 17.9
2 0.39 1.61 5.8 2.00 2.63 34.0 2.00 2.84 18.7
3 0.31 1.49 1.6 1.64 2.29 21.8 1.99 2.69 28.5
4 0.44 1.75 6.9 1.94 2.67 24.7 1.93 2.73 19.5
5 0.56 2.04 9.8 1.62 2.21 26.4
6 0.37 1.64 3.7
Mean 0.42 1.78 5.3 1.91 2.59 26.9 2.02 2.84 21.2
Confidence interval
(95%) 0.10 0.27 3.0 0.36 0.47 5.6 0.16 0.28 7.8
* Eq. (12) using YO/PH = 1.52, YO/CA = 0.87, PH0 = 1.06 mM, CA0 = 0.45 mM
p qu P sl p to fo ex co st p re m th o o se co T d th u st in m v w C
Figure 8: E due to the p the first par depicted in for which th
This work henol (PH), uinone (HY PH+RE, PH+ ludge. Based henolic com o their subst ollows: CA xperiments d ond substrat toichiometry ounds. CA i eason, maxim mixture PH+C he addition
xidation of R f the respirog A mathem ent the aero ompounds b The proposed ation of the heir binary m
seful for pre trates and D n bioreactor model could ices of remo waters.
C insta conc
Inhibition Kineti
Brazili
Effect of the presence of B rt of the simu
Table 1; das he experimen
CONCL
k addresses catechol (C Y) and the
+HY by ph d on single mpounds teste trate and ox > PH >> R demonstrate e only affect y of the oxi inhibited the mum OURex
CA were clo of CA alon RE and HY, i gram represe matical mode obic degradat by phenol-ac d model adeq tested singl mixtures. Th edicting trans DO concentra rs treating p
also help in oval facilitie
NOMENC
antaneous di centration (m
ics During the Ox
ian Journal of Ch
inhibition c B (CA, a; PH ulated respiro shed lines ind ntal and simu
LUSIONS the aerobic CA), resorcin binary mix henol-acclim substrate ex ed can be ord ygen consum RE > HY. B
that the pre ted the kinet idation of th e oxidation o values corre ose to those o ne. While PH in these case
nted the oxid el was devel tion of the cclimated ac quately repre le phenolic c he proposed sient respons ations as a fu phenolic wa n designing t es treating p
CLATURE
issolved oxyg mM)
xidation of Binary
hemical Engineer
constant (KinA H, b, c). Con ogram (A1) u dicate experi ulated A1 val
degradation nol (RE) hyd xtures PH+C mated activa xperiments, dered accord mption rates Binary substr esence of a tics, but not he tested co of PH, for t esponding to obtained dur H inhibited s the first ph dation of PH. loped to rep tested pheno ctivated slud esented the o compounds a d model can ses such as su unction of ti astewaters. T
the aeration phenolic was
gen (DO)
y Mixtures of Ph
ring Vol. 33, No.
A/B) on the o ntinuous line using the pro
imental A1 va lues were sim
n of dro-CA, ated the ding s as rate se-the om-this the ring the hase . pre-olic dge. oxi-and be ub-ime The de- ste-CA Ce DO Ki Kin Kin Kin kLa KO KS OC OC OU PH qO qSm RC RP RS RZ S Su Su t YO
enol with Catech
01, pp. 59 - 71,
oxidation of es represent oposed mode alues (Table milar.
A0 initia DO c oxidi O Disso
subst
nA/B inhib of A nPH/CA inhib
prese
nZ/PH inhib the p a oxyg
O2 oxyg
S subst
C1 oxyg phase
CT total
URex oxyg subst H0 Initia O2m maxi rate (
m maxi
rate (
CA consu
catec
PH consu
(mM
S subst
Z consu
Z is r subst um(OC)cumu um(S) cumu time
O/CA oxida (mol/
hol, Resorcinol an
January - March
the substrate the percenta l (Eqs. (3) to
2). Dotted li
al catechol co concentration izable substra olved oxygen trate inhibitio bition constan due to the pr bition constan ence of catec bition constan
resence of ph gen mass tran gen saturation trate saturatio gen consumpt
e of the respi oxygen cons gen uptake ra trate oxidatio al phenol con mum specifi (mmol gTSS mum specifi (mmol gTSS umption rate chol (mM h-1 umption rate M h-1)
trate consum umption rate resorcinol or h trate concent ulative oxyge ulative substr (h) ation coeffici /mol) nd Hydroquinone
h, 2016
e A (PH, a; R age of A con o (6)) with th
ines indicate
oncentrations n in the absen
ate (mM) n (mM) on coefficien nt for the con resence of B nt for phenol hol (mM h-1) nt for Z (RE
henol (mM h nsfer coeffici
n coefficient on coefficien tion during t irogram (mM sumed (mM) ate associated on (mM h-1) ncentrations (
ic oxygen co -1
h-1) ic substrate c
-1 h-1) e correspondi
)
e correspondi
mption rate (m correspondin hydroquinone tration (mM) en consumpt rate concentr
ient for catec
RE, b; HY, c sumed durin he coefficient e KinA/B value
s (mM) nce of an
nt (mM) nsumption
(mM) l in the
)
or HY) in h-1) ient (h-1)
(mM) nt (mM) the first M)
)
d with the
(mM) onsumption
consumption
ing to
ing to pheno
mM h-1) ng to Z, where
70 C. C. Lobo, N. C. Bertola and E. M. Contreras
Brazilian Journal of Chemical Engineering
YO/PH oxidation coefficient for phenol (mol/mol) YO/S oxidation coefficient for S, where S
represents CA, RE or HY (mol/mol) Z0 initial concentration of RE or HY (mM)
ACKNOWLEDGEMENTS
This work was supported by Consejo Nacional de Investigaciones Científicas y Técnicas (CONICET), by Universidad Nacional de la Plata (UNLP), and by Agencia Nacional de Promoción Científica y Tecno-lógica (ANPCyT), Argentina.
REFERENCES
Ahuatzi-Chacón, D., Ordorica-Morales, G., Ruiz-Ordaz, N., Cristiani-Urbina, E., Juárez-Ramírez, C., Galíndez-Mayer, J., Kinetic study of phenol hydroxylase and catechol 1,2-dioxygenase bio-synthesis by Candida tropicalis cells grown on different phenolic substrates. World Journal of Microbiology and Biotechnology, 20, 695-702 (2004).
Arutchelvan, V., Kanakasabai, V., Elangovan, R., Nagarajan, S., Muralikrishnan, V., Kinetics of high strength phenol degradation using Bacillus brevis. Journal of Hazardous Materials, 129, 216-222 (2006).
Bajaj, M., Gallert, C., Winter, J., Biodegradation of high phenol containing synthetic wastewater by an aerobic fixed bed reactor. Bioresource Tech-nology, 99, 8376-8381(2008).
Busca, G., Berardinelli, S., Resini, C., Arrighi, L., Technologies for the removal of phenol from fluid streams: A short review of recent develop-ments. Journal of Hazardous Materials, 160, 265-288 (2008).
Contreras, E. M., Albertario, M. E., Bertola, N. C., Zaritzky, N. E., Modelling phenol biodegradation by activated sludges evaluated through respiro-metric techniques. Journal of Hazardous Materials, 158, 366-374 (2008).
Christen, P., Vega, A., Casalot, L., Simon, G., Auria, R., Kinetics of aerobic phenol biodegradation by the acidophilic and hyperthermophilic archaeon Slufolobus solfataricus 98/2. Biochem. Eng. J., 62, 56-62 (2012).
Detmer, K., Massey, V., Effect of substrate and pH on the oxidative half-reaction of phenol hydrox-ylase. The Journal of Biological Chemistry, 260, 5998-6005 (1985).
Divari, S., Valetti, F., Caposio, P., Pessione, E.,
Cavaletto, M., Griva, E., Gribaudo, G., Gilardi, G., Giunta, C., The oxygenase component of phenol hydroxylase from Acinetobacter radioresistens S13. European Journal of Biochemistry, 270, 2244-2253 (2003).
Edwards, J. D., Industrial Wastewater Treatment: A Guidebook, Florida (1995).
Enroth, C., Neujahr, H., Schneider, G., Lindqvist, Y., The crystal structure of phenol hydroxylase in complex with FAD and phenol provides evidence for a concerted conformational change in the en-zyme and its cofactor during catalysis. Structure, 6, 605-617 (1998).
Guisasola, A., Baeza, J. A., Carrera, J., Sin, G., Vanrolleghem, P. A., Lafuente, J., The influence of experimental data quality and quantity on pa-rameter estimation accuracy: Andrews inhibition model as a case study. Education for Chemical Engineers 1, 139-145 (2006).
Gujer, W., Henze, M., Mino, T., Loosdrecht, M. V., Activated sludge model No. 3. Water Science and Technology, 39, 183-193 (1999).
Henze, M., Grady, C. P. L. J., Gujer, W., Marais, G. V., Matsuo, T., Activated Sudge Model No. 1. IAWPRC Scientific and Technical Report No. 1, London (1987).
Henze, M., Gujer, W., Mino, T., Matsuo, T., Wentzel, M. C., Marais, G. V. R., van Loosdrecht, M. C. M., Activated sludge model No.2D, ASM2D. Water Science and Technology 39, 165-182 (1999). Henze, M., Harremoes, P., Jansen, J. L., Arvin, E.,
Wastewater Treatment. Biological and Chemical Processes, London (2002).
Houari, M., Hamdi, B., Bouras, O., Bollinger, J.-C., Baudu, M., Static sorption of phenol and 4-nitrophenol onto composite geomaterials based on montmorillonite, activated carbon and cement. Chemical Engineering Journal, 255, 506-512 (2014).
Inchaurrondo, N., Contreras, E., Haure, P., Catalyst reutilization in phenol homogeneous cupro-Fenton oxidation. Chemical Engineering Journal, 251, 146- 157 (2014).
INDSPEC, High Production Volume (HPV) Chal-lenge Program. Data Analysis and Test Plan for Resorcinol. CAS Number 108-46-3, Chemical Cor-poration, Pittsburgh (2004).
Karigar, C., Mahesh, A., Nagenahalli, M., Yun, D. J., Phenol degradation by immobilized cells of Arthro-bacter citreus. Biodegradation, 17, 47-55 (2006). Kumar, A., Kumar, S., Biodegradation kinetics of
Inhibition Kinetics During the Oxidation of Binary Mixtures of Phenol with Catechol, Resorcinol and Hydroquinone 71
Brazilian Journal of Chemical Engineering Vol. 33, No. 01, pp. 59 - 71, January - March, 2016
Lepik, R., Tenno, T., Biodegradability of phenol, resorcinol and 5- methyl resorcinol as single and mixed substrates by activated sludge. Oil Shale, 28, 425-443 (2011).
Lobo, C. C., Bertola, N. C., Contreras, E. M., Stoi-chiometry and kinetic of the aerobic oxidation of phenolic compounds by activated sludge. Biore-source Technology, 136, 58-65 (2013).
Lobo, C. C., Bertola, N. C., Contreras, E. M., Error propagation in open respirometric assays. Brazil-ian Journal of Chemical Engineering, 31, 303-312 (2014).
Mendes, P., GEPASI: A software package for model-ling the dynamics, steady states and control of biochemical and other systems. Computer appli-cations in the biosciences: CABIOS 9, 563-571 (1993).
Nuhoglu, A., Yalcin, B., Modelling of phenol re-moval in a batch reactor. Process Biochemistry, 40, 1233-1239 (2005).
Orupõld, K., Maširin, A., Tenno, T., Estimation of biodegradation parameters of phenolic compounds on activated sludge by respirometry. Chemo-sphere, 44, 1273-1280 (2001).
Pramparo, L., Suárez-Ojeda, M. E., Pérez, J., Carrera,
J., Kinetics of aerobic biodegradation of dihy-droxybenzenes by a p-nitrophenol-degrading acti-vated sludge. Bioresource Technology, 110, 57-62 (2012).
Sejlitz, T., Neujahr, H. Y., Phenol hydroxylase from yeast. European Journal of Biochemistry, 170, 343-349 (1987).
Tziotzios, G., Teliou, M., Kaltsouni, V., Lyberatos, G., Vayenas, D. V., Biological phenol removal us-ing suspended growth and packed bed reactors. Biochemical Engineering Journal, 26, 65-71 (2005). US-EPA, Toxicological Review. Phenol. CAS No.
108-95-2. U.S. EPA, Washington DC (2000). Vanrollehem, P. A., Gillot, S., Robustness and
eco-nomic measures as control benchmark perfor-mance criteria. Water Science and Technology, 45, 117-126 (2002).
Wang, W., Liu, Y., Li, T., Zhou, M., Heterogeneous Fenton catalytic degradation of phenol based on controlled release of magnetic nanoparticles. Chemical Engineering Journal, 242, 1-9 (2014). Yoong, E. T., Lant, P. A., Greenfield, P. F., In situ