N
o
ta
T
é
c
ni
c
a
*e-mail: [email protected]
DETERMINATION OF MOISTURE CONTENT AND WATER ACTIVITY IN ALGAE AND FISH BY THERMOANALYTICAL TECHNIQUES
Vilma Mota da Silva, Luciana Almeida Silva eJailson B. de Andrade*
Instituto de Química,Universidade Federal da Bahia, 40170-290 Salvador - BA, Brazil Márcia C. da Cunha Veloso
Centro Federal de Educação Tecnológica da Bahia, 40625-650 Salvador - BA, Brazil Gislaine Vieira Santos
Instituto de Biologia, Universidade Federal da Bahia, 40170-290 Salvador - BA, Brazil Recebido em 18/12/07; aceito em 25/2/08; publicado na web em 2/4/09
The water content in seafoods is very important since it affects their sensorial quality, microbiological stability, physical characteristics and shelf life. In this study, thermoanalytical techniques were employed to develop a simple and accurate method to determine water content (moisture) by thermogravimetry (TG) and water activity from moisture content values and freezing point depression using differential scanning calorimetry (DSC). The precision of the results suggests that TG is a suitable technique to determine moisture content in biological samples. The average water content values for fish samples of Lutjanus synagris and Ocyurus chrysurus
species were 76.4 ± 5.7% and 63.3 ± 3.9%, respectively, while that of Ulva lactuca marine algae species was 76.0 ± 4.4%. The method presented here was also successfully applied to determine water activity in two species of fish andsix species of marine algae collected in the Atlantic coastal waters of Bahia, in Brazil. Water activity determined in fish samples ranged from 0.946 – 0.960 and was consistent with values reported in the literature, i.e., 0.9 – 1.0. The water activity values determined in marine algae samples lay within the interval of 0.974 – 0.979.
Keywords: moisture content; water activity; thermoanalytical techniques.
INTRODUCTION
The last few decades have seen a strong worldwide escalation in the consumption of fish and macroalgae in response to increasing awareness of the excellent nutritional value and beneficial effects of these foods on human health.1,2 These foods of marine origin have a high economic value for many countries, representing the largest share among agribusiness products on the global market. However, to become them acceptable to the consumer in fresh, frozen or processed form, their excellent sensorial and nutritional qualities and their shelf life must be ensured. In this context, the determination of the water content of seafoods is extremely important, for water strongly affects their microbiological and chemical stability, physical properties and technological proces-ses (processing, storage and distribution), and is also used to deter-mine their nutritional composition.3-5
In generally, although the determination of water content is one of the most commonly performed analysis on foodstuffs, it is not an easy task since foods are very complex matrices usually composed of a mixture of polar (proteins and carbohydrates) and apolar substances (lipids), thus requiring great care in the preparation of samples for analysis.6 On the other hand, water may be present in foodstuffs in at least three different forms and with distinct properties, i.e., free, adsorbed and bound water.5 Therefore, these two factors – the nature of the sample and that of the water – will indicate the most suitable method for the determination of a food’s water content.
Actually, this determination involves the use of several methods, which are classified as direct or indirect.3 The direct methods are based on techniques of physical separation of water (desiccation
by water transfer, distillation, oven drying), on selective chemical reactions of the water in the sample (Karl Fischer tritation, calcium carbide and calcium hydride methods), or on a combination of both, i.e., on the chemical determination of the water obtained by physical separation (evaporation and Karl Fischer tritation).5,7-12 The indirect methods are based on spectroscopic properties of the water molecule (NMR, NIR, Raman, microwave spectroscopies) or on physical properties of the sample that depend on its water content.5,7
In samples of fish and algae of the same species, the morphological and structural differences of the tissues, as well as age, size, collection site or seasonality, affect the total water content.13 The methods most commonly employed with these types of samples are drying methods (desiccation by water transfer and oven drying), which are based on the sample’s mass loss after drying. In the oven-drying procedure, which is most commonly used, the samples are heated to high temperatures (80 – 110 ºC) in an oven for a period of approximately 24 h.14 However, when it comes to algae and fish, this temperature range may cause the decomposition of some components such as lipids, amino acids and carbohydrates, and the volatile substances formation and water, resulting in samples unsuitable for other analyses of interest.15 These methods also allow for the determination of dry and wet mass of algae and fish samples. Knowledge of the relation between dry and wet mass is required to estimate the quantity of sample to be collected according to the mass necessary for a given analysis.6,13
On the other hand, the quantity of water in a food is not, in itself, the principal determinant of the food’s stability and safety. What actually matters is the water’s availability for reactions of chemical and microbiological deterioration rather than its abundance. Free water is considered to be responsible for this availability, for it is weakly bound to the substrate and acts as a solvent, allowing for the growth of microorganisms and for chemical reactions. The free form of freezable water and its content are expressed as water activity (aw),5,16,17 which is defined as the ratio of the partial pressure of the water in a mixture (p) to the partial pressure of pure water (p*):
(1)
When the concentration of solute approaches zero, i.e., highly diluted solutions, the solvents follow Raoult’s law (xA = pA/pA*) and their activity tends toward the fraction in mol. In these conditions, one can say that the activity is approximately equal to the fraction in mol of the solvent, which can be expressed as:
(2)
where n1 is the quantity of matter of water and n2 is the quantity of matter of all the soluble species. Both these magnitudes can be determined experimentally.
The aw is an intrinsic property of the sample, while the moisture depends on the atmosphere in equilibrium with it; however, it should be noted that most of the methods for determining aw depend on the moisture content.
The most common methods for determining aw involve measures based on different principles: psychrometry, cryoscopy, dew-point hygrometry and isopiestic equilibration.9-12,18,19 Thermal analysis consists of a set of techniques that are very useful in the characterization of biological materials, since they reduce the quantity of sample and the time of analysis, preventing errors in the handling of the samples, allowing for the simultaneous determination of moisture content, dry mass and ashes, and providing information about the temperatures and heat of crystallization or fusion and of vaporization, as well as a certain level of specificity when allied to other techniques.16
In this work, thermoanalytical techniques were employed to develop a simple and precise method to determine the aw from the moisture content obtained by thermogravimetry (TGA) and the cryoscopic depression by differential scanning calorimetry (DSC) of samples of different algae species subjected to different forms of pretreatment and preservation, and of fish collected in the coastal waters of the state of Bahia, Brazil. The results of these analyses provide a good biomass indicator to estimate the quantity of sample to be collected as a function of the mass required for a given analysis and to estimate the stability and microbiological safety of algae and fish used as foods.
EXPERIMENTAL
Sample collection and preparation
Algae
Marine algae were collected in the intertidal zone at low tide on the Atlantic coastal waters of Bahia, Brazil (13001’S and 38031’W). The samples were stored immediately on ice in a polystyrene box and transported to the laboratory.
The algae were cleaned thoroughly to remove epiphytes, small invertebrates and sand particles and gently washed in purified water, after which they were subjected to differents pretreatments: washing in seawater and immediate analysis; washing in seawater, packaging in polyethylene bags, and storage in a commercial freezer at –15 ºC until required for analysis; washing in distilled water and immediate analysis; washing in distilled water, packaging in polyethylene bags, and storage in a commercial freezer at –15 ºC until required for analysis
On the day of the analyses, the stored algae were reconditioned with distilled and/or seawater. Excess water was allowed to drain from the samples, after which they were dried on filter paper.
The algae species studied were Caulerpa cupressoides, Caulerpa racemosa, Hypnea musciformis, Sargassum vulgare, Dictyosphaeria versluysii, Padina sp. and Ulva lactuca.
Fishes
Two fish species of the family Lutjanidae (red fish) were studied: Lutjanus synagris and Ocyurus chrysurus. Fresh fish caught in the coastal waters of Bahia, Brazil (13º01’S, 38º31’W) were purchased at the local market. Upon arrival at the laboratory, each species was washed with distilled water. The flesh was removed, washed, placed in a food processor (Triton-Arno) and blended into a fine purée.
Thermogravimetric analysis (TG)
The thermogravimetric curves were obtained using a Shimadzu TGA-50H thermobalance in a dynamic atmosphere and under the various analytical conditions described in Table 1. The samples, with a mass of ~5 mg, were first heated from room temperature (27 ºC) to 700 ºC, at a heating rate of 10 ºC min-1, in a platinum cell. After the exploratory study, another heating program was established to determine the moisture content, which consisted of heating at a rate of 5 ºC min-1 up to 60 ºC, holding the material at this temperature for 30 min.
The cryoscopic depression studies were conducted using differential scanning calorimetry in a Shimadzu DSC-50 cell under a dynamic atmosphere of N2 and a 50 mL min-1 flow. The samples were cooled to –20 ºC in liquid nitrogen and then heated at a rate of 5 ºC min-1 until they reached –10 ºC. At this point the heating rate was lowered to 1 ºC min-1 up to a temperature of 5 ºC, after which the initial heating rate was applied until the samples reached room temperature. The experiments were carried out in an aluminum cell, using as reference an empty aluminum cell.
RESULTS AND DISCUSSION
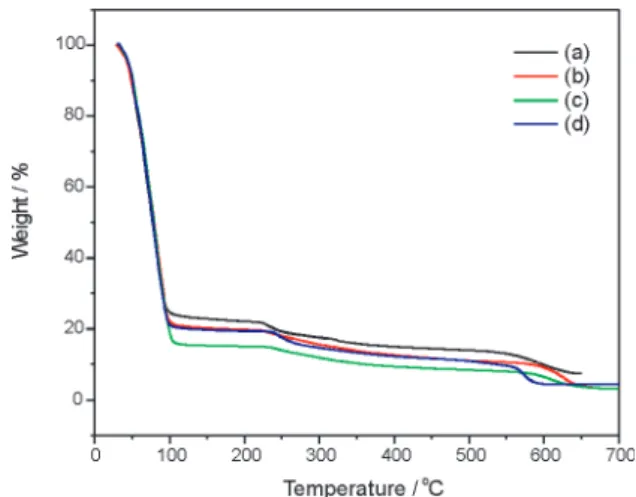
The profile of the thermogravimetric curves obtained for different samples of the same species of alga displayed a great similarity (Figure 1). When heated at a rate of 10 ºC min-1 in an air (Figure 1a, b and c) or nitrogen atmosphere (Figure 1d), they showed a fairly significant initial mass loss from room temperature up to about 108 ºC in one stage, suggesting the dehydration takes place with loss of one type of water (free water), followed by two more stages of mass loss, at circa of 240 and 580 ºC, until the formation of ashes at ~650 ºC. These two stages (240 and 580 ºC) are due to losses of organic compounds and sample decomposition.
data, as well as the values of moisture found in this study. By definition, dry mass is a sample’s mass after all the free water has been removed from it, a value which is found by subtracting the moisture content from the wet mass. The average value of the dry mass of alga samples of the Ulva lactuca species obtained here was 20.2% with a standard deviation of 4.24%. These results provided a good indicator of the biomass to estimate the quantity of sample to be collected according to the mass required for a given analysis.
The TG curves obtained from the fish samples (Figure 2) showed a profile similar to that of Ulva lactuca, with a significant mass loss up to 150 ºC resulting from dehydration, and two subsequent losses, at circa of 280 - 400 ºC and 520 - 620 ºC, until ashes were formed at about 800 ºC.
Based on these experiments, the conditions established for the analysis of fish and algae were temperature of heating rate of 10 ºC min-1 in nitrogen.
The thermogravimetric curve of each algae and fish species is given in Figures 3 and 4, respectively.
A sample mass of about 5 mg of the alga species Ulva lactuca
lost all its moisture in less than 14 min, while the Caulerpa racemosa species took about 31 min to dehydrate under the same conditions (Figure 3). Table 2 lists the values of moisture and average dehydration times of the different species of algae and fishes evaluated here; all analyses were performed in triplicate. In addition, different parts of the same specimen of Sargassum vulgare were analyzed, revealing moisture varying from 58.5 to 78.5%. The average moisture content of the phyllode is about 58%, while that of the receptacle is around 78%, and the average moisture content of a mixture of the different parts is 72.9%.
The thermogravimetric curve of fish species is given in Figu-res 4. A sample mass of about 5 mg of the fish species Lutjanus synagris lost all its moisture in less than 13 min, while the Ocyurus chrysurus species took about 20 min to dehydrate under the same conditions (Figure 4)
The fish samples presented average moisture values of 76.3% for the species Lutjanus synagris and 63.3% for the species Ocyurus chrysurus (Table 2). These findings are similar to those described in the literature for saltwater fish, whose moisture content lies within the range of 66 to 84%.20 The low standard deviations and the good reproducibility of the measures confirm that thermogravimetry is an excellent technique for determining moisture in biological samples, since it precludes heating of the sample for a period of 24 h at a temperature of 60 ºC, which, in addition to requiring longer times for analyses, involves high consumption of electric energy.
The water activity (aw) is determined by measuring the lowering of the freezing or fusion point of the water (cryoscopic depression), which is a colligative property and, as such, depends exclusively on the number of particles present in the solvent, and not on the nature of those particles (Equation 3).
∆Tf = Kf b (3)
∆Tf = cryoscopic depression; Kf = cryoscopic constant (for water, 1.86 K mol kg-1); b = molality (b = n
2/msolvent (kg))
In this work, the cryoscopic depression of the water in algae and fish was measured by DSC in order to evaluate its stability and microbiological safety. The DSC curves of all the samples studied here displayed an endothermic peak corresponding to fusion
(Fi-Figure 1. TG curves obtained in different conditions from the Ulva lactuca
algae samples: (a), (b) and (c) atmosphere of air (30 mL min-1); (d) atmosphere
of N2 (50 mL min
-1). All samples were heated at a rate of 10 oC min-1
Table 1. Analytical conditions, pretreatments data, moisture and ash contents of the Ulva lactuca algae samples
Moisture(%) ash(%) Analytical conditions Observations
77.5 4.38 Atmosphere: N2 (50 mL min-1) Washed with distilled water, freezed
Heating rate: 10 oC min-1 at -15 oC, analysed in day after
75.8 4.07 Atmosphere: air (30 mL min-1 of air + 50 mL min-1 Washed with distilled water, freezed
of N2)Heating rate: 10 oC min-1 at-15 oC, analysed in day after
80.3 4.09 Atmosphere: air (10 mL min-1 of air + 20mL min-1 Freezed during 30 days and
recondi-of N2)Heating rate: 10 oC min-1 tioned with seawater before analyses
84.00 4.36 Atmosphere: air (30 mL min-1) Freezed during 30 days and recondi
Heating rate: 10 oC min-1 tioned with seawater before analyses
79.7 3.38 Atmosphere: air (30 mL min-1) No reconditioned
Heating rate: 10 oC min-1
78.4 5.91 Atmosphere: air (30 mL min-1) Fresh
Heating rate: 10 oC min-1
77.6 nd Atmosphere: air (30 mL min-1) Fresh
Heating rate: 10 oC min-1
73.4 nd Atmosphere: air (20 mL min-1) Heating until 60 oC (kept for 30 min).
Heating rate: 5 oC min-1 Complete dehydration takes place in
gure 5), which enabled us to determine the values of onset temperature of water fusion in these systems (Table 3).
With these results, the mass of the samples and the thermogravimetrically determined values of moisture, it was possible to calculate the quantity of matter of solute (n2), using Equation 3. Table 3 lists the values of water activity (aw) calculated from Equation 2.
The values of water activity found in the algae studied here fell within the range of 0.974-0.979. These results allowed us to estimate
Figure 2. TG curves obtained from the Lutjanus synagris fish sample
Figure 4. TG curves obtained from different fishes species
the average aw in samples of this type, since no record was found in the literature for the determination of this parameter in algae samples. On the other hand, the values found for the fish species lay within an interval of 0.946 to 0.960. These values are consistent with those found in the literature for Nile tilapia (Orechromis niloticus), which presents 1.0 water activity in the fresh fillet. Yeast and bacterial growth may occur in this range of water activity (0.9-1.0). The limit value established by the FDA (Food and Drug Administration), the American food and drug regulatory body, is 0.85 when the pH is 4.5, only below this value is there no growth of pathogenic bacteria. The storage temperature recommended for meat products with aw of more than 0.95 and pH above 5.2 is below –5 ºC.
Table 3. Water activity in algae and fish
Marine species Mass of the ∆Tf (
oC) a
w water (kg)
Ulva lactuca 1.52 x 10⁻⁶ 2.72 0.974
Sargassum vulgare 2.43 x 10⁻⁶ 2.26 0.979 Hypnea musciformis 3.53 x 10⁻⁶ 2.20 0.979 Ocyurus chrysurus 2.53 x 10⁻⁶ 5.97 0.946 Lutjanus synagris 3.51 x 10⁻⁶ 4.34 0.960 Table 2. Moisture content (n = 3) and average dehydration times of the different marine species
Species Moisture average
(%) dehydration
times (min) Algae
Ulva lactuca 76.0 ± 4.4 13.4
Padina sp 83.7 ± 3.8 17.9
Dictiospheria versluysii 91.7 ± 1.8 29.4
Caulerpa racemosa 95.0 ± 3.5 31.2
Caulerpa cupressoide 86.5 ± 5.7 17.1 Sargassum vulgare (phyllode) 58.5 ± 5.4 17.3 Sargassum vulgare (receptacle) 78.5 ± 3.6 23.0 Sargassum vulgare (total) 72.9 ± 9.2 20.1
Fish
Ocyurus chrysurus 63.3 ± 3.9 24.8
Lutjanus synagris 76.4 ± 5.7 18.3
Figure 5. DSC curves obtained from different species of algae and fish
CONCLUSIONS
The thermoanalytical techniques of TGA and DSC were applied successfully to determine the moisture content and water activity of some algae and fish species. The newly developed methodology proposed herein showed a low standard deviation, requiring small sample masses, little handling, and low energy consumption. ACKNOWLEDGEMENTS
This work was financed by the Brazilian research funding agen-cies CNPq (National Research Council of Brazil), FAPESB (Fun-dação de Apoio à Pesquisa do Estado da Bahia), PRONEX/FAPESB/ CNPq, CAPES (Coordenação de Aperfeicoamento de Pessoal Do-cente) and FINEP (Financiadora de Estudos e Projetos).
REFERENCES
1. Curb, J. D.; Reed, D. M.; J. Medicine1985, 313. 2. Burr, M. L.; Prog. Food Nutr. Sci. 1989, 13, 291.
3. Isengard, H.-D.; Trends FoodSci. Technol.1995, 6, 155. 4. Kvaale, O.; Dalhoff, E.; Food Technol.1963, 5, 659. 5. Mathlouthi, M.; Food Control2001, 12, 409.
6. Coultate, T.; Food – the chemistry of its components series of The Royal
Society of Chemistry Paper backs, 3rd ed., Royal Society of Chemistry:
London, 1996.
7. Isengard, H.-D.; Food Control2001, 12, 395.
8. Hatzidimitriou, E.; Nenadis, N.;Tsimidou, M. Z.; Food Chem. 2007, 105, 1504.
9. Gabriel, A. A.; Food Chem. 2008, 108, 1106. 10. Zamora, M. C.; Chirife, J.; Food Control 2006, 17, 59.
11. Zamora, M. C.; Chirife, J.; Roldán, D.; Food Control 2006, 17, 642. 12. Drusch, S.; Serfert, Y.; Heuvel, A. V. D.; Schwarz, K.; Food Res. Int. 2006,
39, 807.
13. Clendenning, K.; Botanica Marina1962, 4, 204.
14. Bellagha, S.; Sahli, A.; Glenza, A.; Keachaou, N.; J. Food Eng.2005, 68, 105.
15. Rückold, S.; Grobecker, K. H.; Insegard, H-D.; FoodControl2001, 12, 401.
16. Labuza, T.; Acott, K.; Tatin, S.; Lee, J.; J. Food Sci.1976, 41, 910. 17. Pitombo, R. N. M.; Lima, G. A. M. R.; J. Food Eng.2003, 58, 59. 18. Karmas, E.; Food Technol.1980, 34, 53.
19. Prior, B. A.; J. Food Prot.1979, 42, 668.