Printed in Brazil - ©2007 Sociedade Brasileira de Química 0103 - 5053 $6.00+0.00
Article
*e-mail: [email protected]
A Rapid Method to Determine Antibiotic Residues in Milk using Liquid Chromatography
Coupled to Electrospray Tandem Mass Spectrometry
Helio A. Martins-Júnior,a Tereza A. Kussumi,a Alexandre Y. Wangb and Daniel T. Lebre*,b
a
Instituto de Pesquisas Energéticas e Nucleares, Centro de Química e Meio Ambiente, Av. Lineu Prestes, 2258, Cidade Universitária, 05508-000 São Paulo-SP, Brazil
b
Applied Biosystems of Brazil Ltda., Av. do Café, 277, 1o andar, Torre A, 04311-000 São Paulo-SP, Brazil
Atualmente, existe uma preocupação mundial sobre qualidade de vida e um dos requisitos mais importantes é ingerir alimentos seguros e nutritivos. A administração de antibióticos em gado para tratamento de diversas doenças infecciosas tem contribuído para a contaminação do leite industrializado. Por isso, o principal objetivo deste trabalho foi desenvolver um método simples e rápido para identificar e quantificar quatorze antibióticos de diferentes classes em leite, dentre estes: cinco β-lactâmicos, quatro sulfonamidas, três tetraciclinas, um macrolídeo e uma cefalosporina, utilizando sistema de CLAE em modo reverso de eluição com ionização por electrospray e detecção por espectrometria de massas do tipo triploquadrupolo (MS/MS). Esta técnica utilizada em modo de aquisição Monitoramento Múltiplo de Reação (Multiple Reaction Monitoring-MRM) permitiu a determinação dos compostos propostos na faixa de concentração de 0,75 a 375 µg L-1, com coeficientes de linearidade (r) maiores do que 0,9960, seletividade,
sensibilidade e velocidade, com tempo total de análise menor do que 10 minutos. Os compostos dicloxacilina e eritromicina apresentaram o maior e menor resultado de limite de decisão (ccα) igual a 0,05 e 9,77 µg L-1, respectivamente. Em geral, os resultados de recuperação foram de 65
a 125%, com valores de desvio padrão de 2,0 a 15%. Este método também foi aplicado para avaliar a qualidade de diferentes marcas de leite integral disponíveis no mercado brasileiro.
There is a common worldwide concern about the quality of life and one of the most important requirements is to ingest safe and nutritious food. The administration of antibiotics in cattle to treat several infectious diseases has contributed to the contamination of industrialized milk. The goal of this work was to develop a simple and fast method to identify and quantify fourteen antibiotics from different classes in milk, including five β -lactams, four sulfonamides, three tetracyclines, one macrolide and one cephalosporin, using reversed-phase liquid chromatography with electrospray ionization and triple quadrupole mass spectrometry (MS/MS). This technique used Multiple Reaction Monitoring (MRM) acquisition mode to allow the determination of the proposed compounds in the concentration range from 0.75 to 375 µg L-1, within coefficient of linearity (r) higher than 0.9960,
selectivity, sensitivity, and speed, with analysis time less than 10 minutes. Dicloxacillin and erythromycin showed the lower and higher decision limits (ccα) results of 0.05 and 9.77µg L-1, respectively. Overall, the recoveries results ranged from 65 to 125%, with
standard deviation values from 2.0 to 15%. This method was also applied to evaluate the quality of different fat milk brands offered in the Brazilian market.
Keywords: milk, antibiotic residues, mass spectrometry
Introduction
Antibiotics are widely used as a medicinal drug to treat innumerous bacterial infections both in human beins
J. Braz. Chem. Soc.
as bacterial resistance and allergic side effects. In general, the daily consumption of milk with low levels of antibiotics can lead to possible long term carcinogenic, estrogenic and neurotoxicologic effects, although this relation is not well established.1 Considering the optimum amount of milk that should be consumed per
capita, the World Health Organization (WHO) suggests between 170 to 250 liters per year, which shows the importance of monitoring and controlling antibiotic compounds, according to the maximum residue levels (MRL) set by regulatory agencies.2
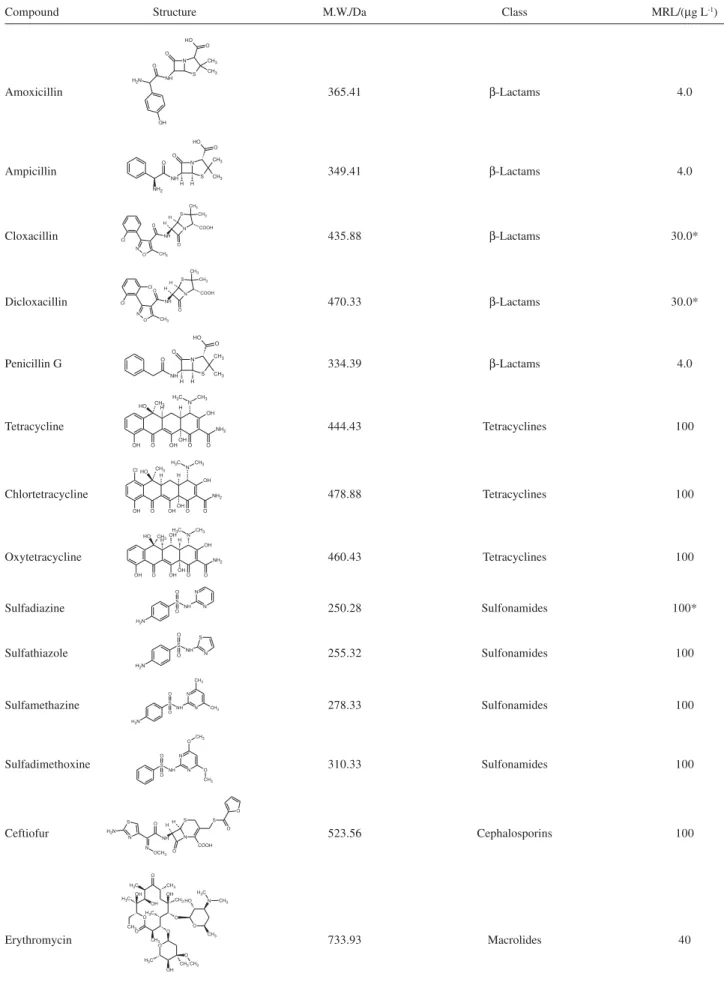
This paper presents an analytical methodology developed to determine multiple classes of antibiotics in whole milk and powder milk found in the Brazilian market, at concentration levels well below the MRL suggested by the National Health Surveillance Agency (ANVISA) through National Program of Veterinary Drugs Residues Analysis in Food (PAMVet) released in September 2003, under resolution 253.3 Table 1 shows name, structure, molecular mass and class of the analyzed antibiotics in milk by this method.
Several articles have reported the application of different analytical tools to detect antibiotics in milk, most of them using chromatographic techniques4 such as thin-layer,5,6 LC-UV7-10 and ion chromatography.11 The analysis of antibiotics in milk by LC-MS/MS is more specific and more reliable.12 In 1992, Tyczkowaska et al.13 studied the degradation process of cloxacillin compound using LC-thermospray-MS system. The LC-MS was also used to analyze sulfonamides,14,15 β-lactams,16,17 ceftiofur18 and tetracyclines,19 where solid phase extraction was applied in conjunction as sample clean up and pre-concentration strategy.
The need for confirmatory analysis, with higher throughput procedures in sample preparation for the analysis of polar antibiotic residues in milk, allowed the LC-MS/MS technique to emerge among the other analytical methods. The higher specificity and sensitivity resulted in better confirmation and overall data quality in quantitative analysis. Volmer20 varied the triple quadrupole scan modes to determine 21 sulfonamides, achieving low limits of quantification using MRM mode, where a short chromatography run was applied. Since then, the LC-MS/ MS has been extensively used to determinate antibiotics in milk.21-31
Due to high degree of complexity in multi-residue antibiotics analysis, the main challenge and objective of this work was to develop an efficient method to identify and quantify fourteen antibiotics of different classes and properties in milk, controlled by ANVISA and present in
PAMVet list, using liquid chromatography/tandem mass spectrometry.
Experimental
Reagents
Acetonitrile and methanol, both HPLC grade, were obtained from J. T. Baker (Deventer, NE). Ultrapure water from EASYpure Barnsted (Dubuque, IA, USA) was used in all procedure steps. Ammonium formate (Sigma-Aldrich, St. Louis, MO, USA) and ammonium acetate (J. T. Baker, Deventer, NE) salts were used as additives in the mobile phase and infusion solutions, respectively. Sodium chloride was purchased from Sigma-Aldrich (St. Louis, MO, USA) and was applied in the sample preparation procedure. The high purity antibiotic standards were acquired from Riedel-de-Haën (Seelze, GE).
Solutions and standards
The stock standard solutions of each compound were prepared by dissolving 5.0 mg in acetonitrile/water (50% v/v) to obtain a final volume of 10 mL. These solutions were stored between 2 and 8 ºC in a refrigerator. The intermediate stock standard solution containing all antibiotics was prepared by adding the necessary volume of each stock standard solution to give the following concentrations in 100 mL of water: amoxicillin 1.25 µg mL-1, ampicillin 0.25 µg mL-1, cloxacillin 0.25 µg mL-1, dicloxacillin 0.25 µg mL-1, penicillin G 0.25 µg mL-1 sulfadiazine 0.25 µg mL-1, sulfathiazole 0.25 µg mL-1, sulfamethazine 0.25 µg mL-1, sulfadimethoxine 0.25 µg mL-1, chlortetracycline 2.5
µg mL-1, oxytetracycline 2.5 µg mL-1, tetracycline 2.5
µg mL-1, erythromycin 12.5 µg mL-1 and ceftiofur 2.5
µg mL-1. This solution was used to prepare the analytical standard curve solutions (water solvent) and also the spiked samples for method validation purposes. An infusion solution contained a mix of all compounds at concentration of 100 ng mL-1 in methanol/water (50% v/v) and 2 mmol L-1 of ammonium acetate was used for tuning the mass spectrometer.
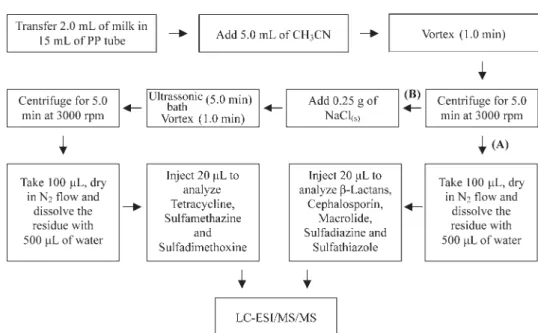
Sample preparation
Table 1. General information of the antibiotic compounds
Compound Structure M.W./Da Class MRL/(µg L-1)
Amoxicillin 365.41 β-Lactams 4.0
Ampicillin 349.41 β-Lactams 4.0
Cloxacillin 435.88 β-Lactams 30.0*
Dicloxacillin 470.33 β-Lactams 30.0*
Penicillin G 334.39 β-Lactams 4.0
Tetracycline 444.43 Tetracyclines 100
Chlortetracycline 478.88 Tetracyclines 100
Oxytetracycline 460.43 Tetracyclines 100
Sulfadiazine 250.28 Sulfonamides 100*
Sulfathiazole 255.32 Sulfonamides 100
Sulfamethazine 278.33 Sulfonamides 100
Sulfadimethoxine 310.33 Sulfonamides 100
Ceftiofur 523.56 Cephalosporins 100
Erythromycin 733.93 Macrolides 40
J. Braz. Chem. Soc.
different brands of whole milk, one powder milk and two brands of pasteurized milk. The samples were prepared following Scheme 1. It is important to note that the extraction procedure was split in two phases, A and B, in order to maximize the analyte recoveries.
LC-ESI/MS/MS conditions
The compounds were separated in a reversed phase column (Inertsil ODS-3 50 × 2.1 mm ID 3.0 µm particle size-Metachem, California, USA), using Agilent 1100 binary pumps (Agilent Technologies, Waldbronn, GE), where the mobile phase (A: aqueous solution containing 0.1% of formic acid and 2.5 mmol L-1 of ammonium formate, and B: solution of 95% of acetonitrile/water, v/v, containing 0.1% of formic acid and 2.5 mmol L-1 of ammonium formate) was delivered at a flow rate of 0.350 mL min-1 under gradient elution: t = 0 min, 20% of B ramping until 95% of B in 5.0 min, held in this condition for 2.0 min and then returning to initial condition (20% B), hold for 1.0 min. The total chromatography run was 8.0 minutes. The equilibration time was 2.0 minutes. An autosampler Agilent 1100 series injected volume of 20µL of each sample and the column was maintained at 25 °C.
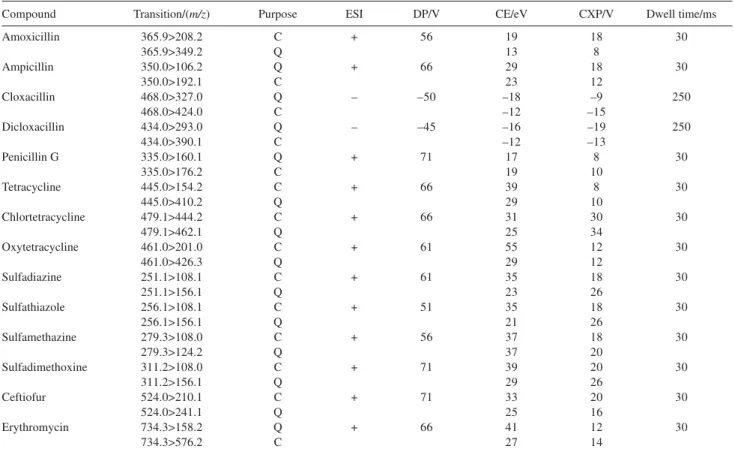
An API 4000 triple quadrupole mass spectrometer (Applied Biosystems/MDS Sciex, Toronto, CA) was operated in Multiple Reaction Monitoring mode (MRM), with two monitored transitions for each compound for confirmatory and quantitative analysis. Table 2 shows the optimized parameters of the MRM
transitions used. The electrospray source was used to ionize the compounds in positive [M + H]+ and negative [M – H]– modes in the same analysis with two time periods. The first period (from 0 to 5.5 min) detected the compounds that ionized in positive mode and the second period monitored negative mode. The Turbo-IonSpray® source was operated at +5500 V, nebulizer gas at 45 psi, heater gas at 50 psi, temperature at 600 °C and curtain gas at 20 psi. In the second period the electrospray voltage was changed to –4500 V at 5.5 minutes, besides the other ionization parameters that were maintained at the same.
Method validation
The method was validated using the regulatory guidelines from the Commission Decision 2002/657/EC, concerning the performance of analytical methods and the interpretation of results.32 The linearity was determined by the analytical curves obtained by the LC-ESI/MS/MS analysis of the standard solutions (n = 7), which contained all antibiotics in an aqueous solvent. The recovery study was performed with five different spiked concentration levels with considerations to the MRL for each compound. The recovery procedure consisted of the analysis of six spiked samples at the MRL, six spiked samples at the 0.5
× MRL level, six spiked samples at the 1.5 × MRL, one at 2.0 x MRL and one at 5.0 × MRL. The overall method sensitivity was calculated as a decision limit and detection capability, as described in the directive for the analytical method validation procedure.32
Table 2. Mass Spectrometry detection conditions using MRM mode
Compound Transition/(m/z) Purpose ESI DP/V CE/eV CXP/V Dwell time/ms
Amoxicillin 365.9>208.2 C + 56 19 18 30
365.9>349.2 Q 13 8
Ampicillin 350.0>106.2 Q + 66 29 18 30
350.0>192.1 C 23 12
Cloxacillin 468.0>327.0 Q – –50 –18 –9 250
468.0>424.0 C –12 –15
Dicloxacillin 434.0>293.0 Q – –45 –16 –19 250
434.0>390.1 C –12 –13
Penicillin G 335.0>160.1 Q + 71 17 8 30
335.0>176.2 C 19 10
Tetracycline 445.0>154.2 C + 66 39 8 30
445.0>410.2 Q 29 10
Chlortetracycline 479.1>444.2 C + 66 31 30 30
479.1>462.1 Q 25 34
Oxytetracycline 461.0>201.0 C + 61 55 12 30
461.0>426.3 Q 29 12
Sulfadiazine 251.1>108.1 C + 61 35 18 30
251.1>156.1 Q 23 26
Sulfathiazole 256.1>108.1 C + 51 35 18 30
256.1>156.1 Q 21 26
Sulfamethazine 279.3>108.0 C + 56 37 18 30
279.3>124.2 Q 37 20
Sulfadimethoxine 311.2>108.0 C + 71 39 20 30
311.2>156.1 Q 29 26
Ceftiofur 524.0>210.1 C + 71 33 20 30
524.0>241.1 Q 25 16
Erythromycin 734.3>158.2 Q + 66 41 12 30
734.3>576.2 C 27 14
ESI = Electrospray Polarity, DP = Declustering Potential, CE = Collision Energy, CXP = Collision Cell Exit Potential, C = Confirmation transition and Q = Quantifier transition.
Results and Discussion
The challenge to analyze multiple antibiotics residues, from different food classes can be attributed to the variety in matrix properties, which make it difficult to set a single chromatographic analysis and extraction procedure. Several examples in the literature reports the analysis of antibiotics by groups or classes. In this work, the task was to develop a single LC-MS/MS method that could monitor all antibiotics present in the list set by PAMvet and others, such as: β-lactams, tetracyclines, sulfonamides, ceftiofur and macrolides.
The extraction procedure was a protein precipitation using a few milliliters of acetonitrile, in which the
β-lactams, ceftiofur, erythromycin, sulfadiazine and sulfathiazole compounds were extracted with satisfactory recoveries. Sodium chloride was added to increase polarity, using the advantage of a salting-out effect to extract the most soluble compounds in the organic phase (tetracyclines, sulfamethazine and sulfadimethoxine). By employing this procedure, it was not possible to quantify all compounds in a single injection. Table 3 summarizes the validation result methods.
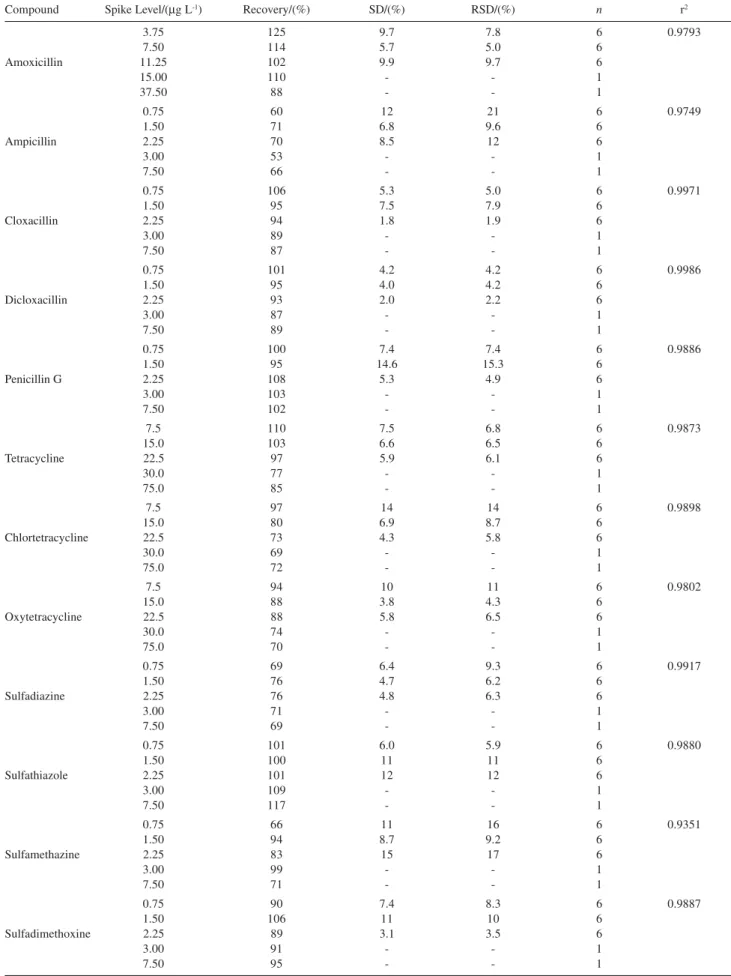
The recovery values obtained are in agreement with the 2002/657/EC guidelines for validation method, where the acceptable trueness of measurements is assessed through recovery of additions of known amounts of the analyte(s) to a blank matrix. Data corrected with the mean recovery are only acceptable when they fall within the following ranges: ≤1.0 µg kg-1 from 50% to 120%; > 1.0 to 10.0 µg kg-1 from 70% to 110% and ≥10.0 µg kg-1 from 80% to 110%. The amoxicillin showed recovery higher than 120% due to a possible matrix effect, whereas for the other compounds no significant interferences were observed. The relative standard deviation obtained within reproducibility conditions did not exceed the recom-mendation set value of 20%, considering the con-centration range validated for this analysis.32
J. Braz. Chem. Soc.
Table 3. Report of the validation data results
Compound Spike Level/(µg L-1) Recovery/(%) SD/(%) RSD/(%) n r2
3.75 125 9.7 7.8 6 0.9793
7.50 114 5.7 5.0 6
Amoxicillin 11.25 102 9.9 9.7 6
15.00 110 - - 1
37.50 88 - - 1
0.75 60 12 21 6 0.9749
1.50 71 6.8 9.6 6
Ampicillin 2.25 70 8.5 12 6
3.00 53 - - 1
7.50 66 - - 1
0.75 106 5.3 5.0 6 0.9971
1.50 95 7.5 7.9 6
Cloxacillin 2.25 94 1.8 1.9 6
3.00 89 - - 1
7.50 87 - - 1
0.75 101 4.2 4.2 6 0.9986
1.50 95 4.0 4.2 6
Dicloxacillin 2.25 93 2.0 2.2 6
3.00 87 - - 1
7.50 89 - - 1
0.75 100 7.4 7.4 6 0.9886
1.50 95 14.6 15.3 6
Penicillin G 2.25 108 5.3 4.9 6
3.00 103 - - 1
7.50 102 - - 1
7.5 110 7.5 6.8 6 0.9873
15.0 103 6.6 6.5 6
Tetracycline 22.5 97 5.9 6.1 6
30.0 77 - - 1
75.0 85 - - 1
7.5 97 14 14 6 0.9898
15.0 80 6.9 8.7 6
Chlortetracycline 22.5 73 4.3 5.8 6
30.0 69 - - 1
75.0 72 - - 1
7.5 94 10 11 6 0.9802
15.0 88 3.8 4.3 6
Oxytetracycline 22.5 88 5.8 6.5 6
30.0 74 - - 1
75.0 70 - - 1
0.75 69 6.4 9.3 6 0.9917
1.50 76 4.7 6.2 6
Sulfadiazine 2.25 76 4.8 6.3 6
3.00 71 - - 1
7.50 69 - - 1
0.75 101 6.0 5.9 6 0.9880
1.50 100 11 11 6
Sulfathiazole 2.25 101 12 12 6
3.00 109 - - 1
7.50 117 - - 1
0.75 66 11 16 6 0.9351
1.50 94 8.7 9.2 6
Sulfamethazine 2.25 83 15 17 6
3.00 99 - - 1
7.50 71 - - 1
0.75 90 7.4 8.3 6 0.9887
1.50 106 11 10 6
Sulfadimethoxine 2.25 89 3.1 3.5 6
3.00 91 - - 1
Table 3. cont.
Compound Spike Level/(µg L-1) Recovery/(%) SD/(%) RSD/(%) n r2
7.5 101 9.5 9.4 6 0.9870
15.0 106 4.3 4.1 6
Ceftiofur 22.5 95 7.5 7.9 6
30.0 86 - - 1
75.0 105 - - 1
37.5 107 7.6 7.1 6 0.9756
75.0 94 13 14 6
Erythromycin 112.5 87 14 16 6
150.0 85 - - 1
335.0 92 - - 1
SD = Standard Deviation; RSD = Relative Standard Deviation.
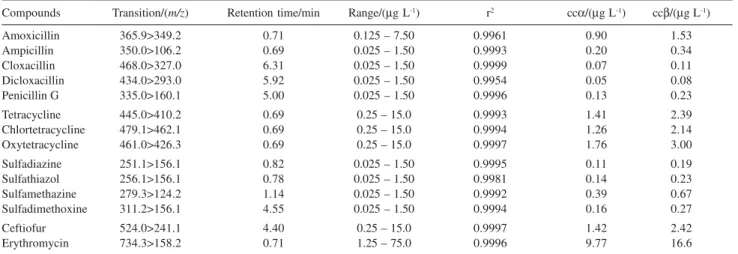
Table 4. Results of linearity and sensitivity
Compounds Transition/(m/z) Retention time/min Range/(µg L-1) r2 ccα/(µg L-1) ccβ/(µg L-1)
Amoxicillin 365.9>349.2 0.71 0.125 – 7.50 0.9961 0.90 1.53
Ampicillin 350.0>106.2 0.69 0.025 – 1.50 0.9993 0.20 0.34
Cloxacillin 468.0>327.0 6.31 0.025 – 1.50 0.9999 0.07 0.11
Dicloxacillin 434.0>293.0 5.92 0.025 – 1.50 0.9954 0.05 0.08
Penicillin G 335.0>160.1 5.00 0.025 – 1.50 0.9996 0.13 0.23
Tetracycline 445.0>410.2 0.69 0.25 – 15.0 0.9993 1.41 2.39
Chlortetracycline 479.1>462.1 0.69 0.25 – 15.0 0.9994 1.26 2.14
Oxytetracycline 461.0>426.3 0.69 0.25 – 15.0 0.9997 1.76 3.00
Sulfadiazine 251.1>156.1 0.82 0.025 – 1.50 0.9995 0.11 0.19
Sulfathiazol 256.1>156.1 0.78 0.025 – 1.50 0.9981 0.14 0.23
Sulfamethazine 279.3>124.2 1.14 0.025 – 1.50 0.9992 0.39 0.67
Sulfadimethoxine 311.2>156.1 4.55 0.025 – 1.50 0.9994 0.16 0.27
Ceftiofur 524.0>241.1 4.40 0.25 – 15.0 0.9997 1.42 2.42
Erythromycin 734.3>158.2 0.71 1.25 – 75.0 0.9996 9.77 16.6
r2 = coefficient of linearity, ccα = decision limit and ccβ = detection capability.
Figure 1. Total Ion Chromatogram (TIC) blank milk samples. (a) Extrac-tion without salt and (b) ExtracExtrac-tion with salting out.
the amount of proteins remained in the supernatant layer from the extraction process, appeared the same in the electrospray ionization process. In the beginning of the validation tests, the previous results were considered a problem due to shorter retention time of some analytes
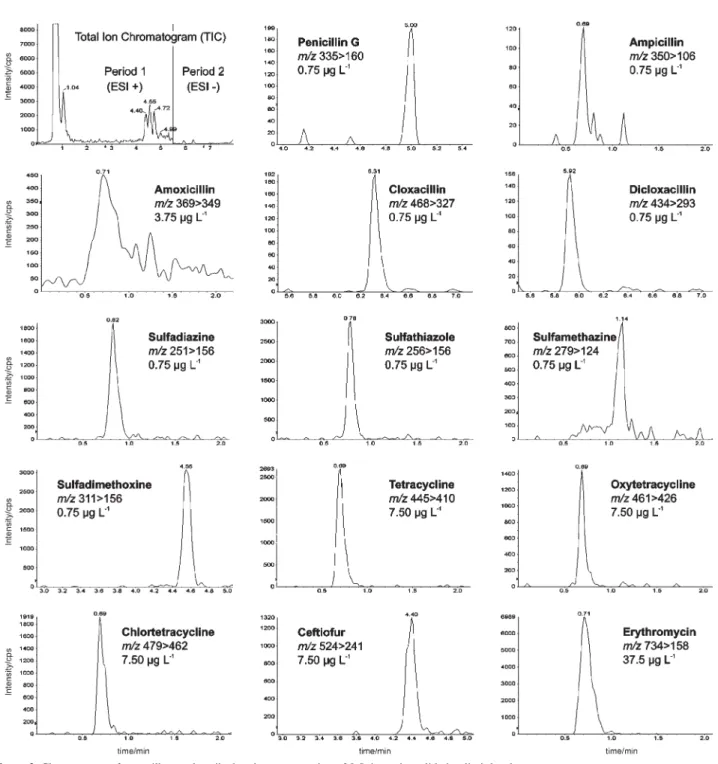
that elute in the proximity of the matrix interferences, resulted in undesired analytical consequences as loss of specificity and sensitivity. However, the high selectivity of the triple quadrupole mass spectrometry using the MRM mode solved this issue. Figure 2 presents the chromatograms of the spiked milk sample injected at the concentration of 0.5 × the validation limit level. Extracted Ion Chromatogram (XIC) from each quantifier transitions were shown in Figure 2, where the antibiotics were detected without matrix interference. The amoxicillin peak was affected by the matrix effect, decreasing the ion signal intensity by factor of five compared with the other β-lactams.
The analytical curve linearity and method sensitivity are shown in Table 4. The report evaluated that dicloxacillin and erythromycin are the most and least sensitive compounds, respectively, according to the ccα
and ccβ calculated. But all data complies with the MRL set by PAMVet.
J. Braz. Chem. Soc.
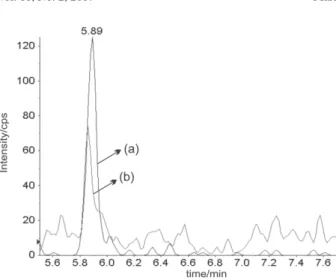
concentration of 0.44 µg L-1 in one brand of powder milk. Figure 3 shows the extracted ion chromatogram of the milk sample. The compound can be identified by detection of the two MRM transitions. This evidence emphasizes the importance of food quality monitoring programs.
Conclusions
In this work a reliable multi-antibiotics residue LC-ESI/ MS/MS method was developed to monitor their presence in milk samples. The sample preparation procedure without
extensive steps leads to less time consuming and adequate recoveries that could be applied in routine analysis, improving the cost-benefit relation in conjunction with high throughput chromatographic analysis with sensitive detection. The methodology was developed and validated according to the European Union regulations criteria. Finally, the method was applied to determine these compounds in twelve different milk brands found in the local market, where the dicloxacillin residue was found in one sample tested. This evidence shows the importance of the described methodology to verify the milk quality in monitoring programs.
Acknowledgments
The authors would like to thank all staff from Applied Biosystems of Brazil and the Chemistry and Environmental Center at IPEN, specially the supervisors and managers, who supported this work. We also thank the researchers from Instituto Adolfo Lutz (SP), INCQS (FioCruz-RJ) and LACEN (PR) involved with the National Program of Veterinary Drugs Residues Analysis in Food. A special thank to Dr. Gary Impey, from Applied Biosystems/MDS Sciex (Concord, ON, Canada) to his contribution to the final revision and comments.
References
1. http://agroportal.pt/a/2002/anil.htm, accessed in September 2005.
2. http://www.resvistarural.com.br/Edicoes/2005/artigos/ rev84_leite.htm, accessed in September 2005.
3. http://www.anvisa.gov.br, accessed in May 2005.
4. Schenck, F. J.; Callery, P. S.; J. Chromatogr., A1998,812, 99. 5. Debackere, M.; Baeten, K.; J. Chromatogr., A1971,61, 125. 6. Bossuyt, R.; Van Renterghem, R.; Waes, G.; J. Chromatogr., A
1976,124,37.
7. Moats, W. A.; Romanowski, R. D.; J. Chromatogr., A1998, 812,237.
8. Takeba, K.; Fujinuma, K.; Miyazaki, T.; Nakazawa, H.; J. Chromatogr., A1998,812, 205.
9. Furusawa, N.; J. Chromatogr., A1999,839, 247.
10. Cinquina, A. L.; Longo, F.; Anastasi, G.; Giannetti, L.; Cozzani, R.;J. Chromatogr., A2003,987, 227.
11. Ding, X.; Mou, S.; J. Chromatogr., A2000,897, 205. 12. Kennedy, D. G.; McCraken, R. J.; Cannavan, A.; Hewitt, S. A.;
J. Chromatogr., A1998,812, 77.
13. Tyczkowska, K. L.; Voyksner, R. D.; Aronson, A. L.; J.
Chromatogr., A1992,594, 195.
14. Abían, J.; Churchwell, M. I.; Korfmacher, W. A.; J.
Chromatogr., A1992,629, 267.
15. Cavaliere, C.; Curini, R.; Di Corcia, A.; Nazzari, M.; Samperi, R.;J. Agric. Food Chem.2003,558, 51.
16. Straub, R. F.; Voykner, R. D.; J. Chromatogr., A1993, 647, 167.
17. Bruno, F.; Curini, R.; Di Corcia, A.; Nazzari, M., Samperi, R.;
J. Agric. Food Chem.2001,3463, 49.
18. Keever, J.; Voyksner, R. D.; Tyczkowska, K. L.; J. Chromatogr., A1998,794, 57.
19. Bruno, F.; Curini, R.; Di Corcia, A.; Nazzari, M.; Pallagrosi, M.;Rapid Commun. Mass Spectrom.2002,1365, 16. 20. Volmer, D. A.; Rapid Commun. Mass Spectrom.1996,1615,
10.
21. Lock, C. M.; Chen, L.; Volmer, D. A.; Rapid Commun. Mass Spectrom.1999,1744, 13.
22. Riediker, S.; Stadler, R. H.; Anal. Chem.2001,1614, 73. 23. Riediker, S.; Deserens, J. M.; Stadler, R. H.; J. Agric. Food
Chem.2001,4171, 49.
24. Holstege, D. M.; Pushner, B.; Whitehead, G.; Galey, F. D.; J. Agric. Food Chem.2002,406, 50.
25. Bogialli, S.; Capitolino, V.; Curini, R.; Di Corcia, A.; Nazzari, M.; Sergi, M.; J. Agric. Food Chem.2004,3286, 52. 26. Riediker, S.; Rytz, A.; Stadler, R. H.; J. Chromatogr., A2004,
1054, 359.
27. Guy, P. A.; Royer, D.; Mottier, P.; Gremaud, E.; Perisset, A.; Stadler, R. H.; J. Chromatogr., A2004,1054, 365.
28. Becker, M.; Zittlau, E.; Petz, M.; Anal. Chim. Acta 2004,19, 520.
29. Bogialli, S.; Curini, R.; Di Corcia, A.; Laganà, A.; Mele, M.; Nazzari, M.; J. Chromatogr., A2005,1067, 93.
30. Makeswaran, S.; Patterson, I.; Points, J.; Anal. Chim. Acta2005, 151, 529.
31. Martins-Júnior, H. A.; Bustillos, O. V.; Pires, M. A. F.; Wang, A. Y.; Lebre, D. T.; Quim. Nova,2006, 29, 586.
32. Commission Decision 2002/657/EC of 12 August 2002, Off. J. Eur. Commun. 2002, L221, 8.
Received: April 24, 2006
Web Release Date: March 30, 2007
FAPESP helped in meeting the publication costs of this article. Figure 3. Extraction Ion Chromatogram (XIC) from milk sample
con-taining 0.44 µg L-1 of dicloxacicillin. (a) XIC quantifier transition 434>293