Revisão
*e-mail: [email protected]
ANALYTICAL METHODS FOR VANCOMYCIN DETERMINATION IN BIOLOGICAL FLUIDS AND IN PHARMACEUTICALS
Marta Maria Duarte Carvalho Vila, Robson Machado de Oliveira and Marcos Moisés Gonçalves Curso de Farmácia, Universidade de Sorocaba, Sorocaba - SP, Brazil
Matthieu Tubino*
Instituto de Química, Universidade Estadual de Campinas, CP 6154, 13083-970 Campinas - SP, Brazil
Recebido em 25/8/05; aceito em 7/4/06; publicado na web em 31/10/06
Vancomycin is a glycopeptide antibiotic employed in the treatment of infections caused by certain methicillin-resistant staphylococci. It is indicated also for patients allergic to penicillin or when there is no response to penicillins or cephalosporins. The adequate vancomycin concentration levels in blood serum lies between 5 and 10 mg/L. Higher values are toxic, causing mainly nephrotoxicity and ototoxicity. Various analytical methods are described in the literature: spectrophotometric, immunologic, biologic and chromatographic methods. This paper reviews the main analytical methods for vancomycin determination in biological fluids and in pharmaceutical preparations.
Keywords: antibiotic; vancomycin; quantitative analysis.
INTRODUCTION
Vancomycin is a glycopeptide antibiotic first isolated in 1956 from Streptomyces orientalis cultures in a research developed by Laboratory Lilly, USA. It was first introduced in medical clinic in 1958.
The structure of vancomycin (Figure 1), elucidated at the end of the 70’s, is tricyclic and the molecular mass was about 1500 Da. Vancomycin acts against gram-positive coccus and bacillus inhibiting the biosynthesis of the cell-wall mucopeptide, leading to a growth stalling and to the eventual destruction of the cell by lysis, in addition to which, RNA synthesis is inhibited. Vancomycin is resistant to the proteolytic enzymes activity due to its molecule complexity1-3.
The discovery of vancomycin represented, at first, an alternative for treating infections caused by the staphylococcus that produces penicilinase and the ones that are resistant to penicillin G. However, the discovery of methicillin, oxacillin and other isoxazolilpenicillins lessened the therapeutical importance of vancomycin due to its higher toxicity3.
Nowadays, however, vancomycin has emerged as an important anti-infectious agent as a consequence of the discovery of methicillin resistant staphylococcus and also due to infections caused by Clostridium difficile.
Vancomycin is very efficient against a number of gram-positive micro-organisms, including Staphylococcus aureus and Staphylococcus epidermidis. It is also the chosen antibiotic to treat bacterial infections in patients allergic to β-lactam antibiotics. Today, vancomycin resistant Staphylococcus aureus strains are a serious concern4-6.
volume, i.e., with burnings; infants and newly born babies; pregnant women; patients with cancer; those who need high doses of antibiotic and instances of prolonged vancomycin treatment7, 10, 11.
Therefore, it is really necessary to determinate blood vancomycin concentration, as well as in other body fluids, in order to adjust its correct dose, for better results with minor side effects. To adequately control its concentration in biological fluids, it is obviously necessary to quantitatively analyze its amounts in the pharmaceutical dosage forms. A review of the quantitative analytical methods, described in the literature for vancomycin determination, both in biological matrixes and in pharmaceutical products, is presented below.
SPECTROPHOTOMETRIC METHODS
Fooks et al.12 developed a colorimetric method for vancomycin quantitative analysis, based on the reaction of Folin-Ciocalteau’s reagent with antibiotic’s phenolic groups, giving rise to a colored compound possessing the maximum absorption at 725 nm. However, this reagent is not specific for vancomycin and it gives rise to blue color with other substances, mainly with those presenting the phenolic group13.
El-Ashry et al.14 described a determination method for some phenolic antibiotics (vancomycin, cefadroxil and amoxicillin), based on measurement of the orange-yellow species produced when these drugs are coupled with diazotized benzocaine in triethylamine medium. The stoichiometric ratio for the studied compounds was found to be 1:1. The method is applicable over the range of 2-18 µg mL-1 for vancomycin. The formed compound absorbs at 442 nm and the detection limit is 0.0156 µg for vancomycin.
Belal et al.15 described a method that involves a prior treatment with nitrous acid, then measuring the formed nitroso derivative, either by spectrophotometry or polarography. The calibration plot of the photometric method is linear over the range of 4-32 µg mL-1, with minimum detectability of 2.7 µg mL-1 (1.8×10⁻⁶ mol L-1).
Three methods were proposed by Sastry et al.16,based on vancomycin oxidation with a sodium metaperiodate excess, forming colored species, after reacting with different substances. Though, with good analytical results (detection limit 1.15 to 5.11 of µg mL-1), in all of those methods, it is necessary to heat the substances for about 40 min in a boiling water bath. However, despite the known fact that vancomycin has its degradation rate increased when heated in solution, these methods seem not to be affected by heating17,18.
Spectrophotometric analytical methods are usually of low cost and relatively easy to be performed, but probably due to the complexity of the vancomycin molecule, very few methods using such technique are described in the literature. Due to the insufficient detection limit, the related spectrophotometric procedures for vancomycin are adequate only for the analysis of medicines and not to determine antibiotics in biological fluids.
IMMUNOLOGIC METHODS
The immunologic methods employed in vancomycin quanti-fication include the following techniques: fluorescence polarization immunoassay (FPIA), radioimmunoassay (RIA) and enzyme-multiplied immunoassay (EMIT). The quantification of vancomycin using FPIA and EMIT19-23 are analytical techniques based on commercial kits or automated analyzers. These procedures offer sensitivity, sensibility, quickness, and reduced human contact with the biological samples. However, there is the disadvantage of always having to depend on the companies that hold commercial rights.
The FPIA technique has been pointed out as being the most employed one for routine analysis of vancomycin in biological samples7. Tobin et al.9 related that it was used in 97% of the hospitals
investigated. The EMIT is another useful clinical assay with simi-lar results when compared whit FPIA and HPLC 24.
However, it is considered to overestimate the amount of vancomycin in blood samples, compared to FPIA and HPLC techniques. This could be a consequence, among other factors, of the interference of crystalline degradation products17, 24-32.
Considering that, Abbot Laboratories developed the kit “AxSYM Vancomycin II Assayâ”, for vancomycin quantification with FPIA. The assay demonstrates no cross-reactivity to crystalline degradation product in commonly-prescribed and over-the-counter drugs, as well as a minimum interference from endogenous substances. Linearity of the calibration curve from 1.0 to 100 µg mL-1 was observed. The variation coefficients range from about 2.9 to 4.3%. The sensitivity is lower than 2.0 µg mL-1. A good correlation with other methods was observed22,33. The RIA method34-37 had also been employed. Despite the good quality of the analytical results, it is less efficient and more expensive than FPIA, and there is also the disadvantage of using radioactive substances37.
BIOLOGICAL METHODS
Antibiotics quantification using micro-organisms can be performed by the disk diffusion technique and by turbidimetry. A linear relationship between zone diameter and concentration was obtained.
The most used method is the disk diffusion technique, that correlates the size of the zone were the growing was inhibited with the substance dose. A linear relationship between zone diameter and antibiotic concentration was obtained.
However, when the substance is chemically well defined and its quantification is possible through the physico-chemical properties, biological methods are not the first choice38. Despite the low cost, they are usually very slow and involve intense laboratorial work, when compared to other methods21,34.
In biological assays for vancomycin quantification by disk diffusion technique, Bacillus subtilis ATCC 663321,34,39 or Bacillus subtillis W23 40 are generally employed as reference micro-organisms. However, Durodie and Coleman41 presented a new technique, using Streptococcus sanguis ATCC 12396 to increase the detection range of vancomycin, that is between 1 and 16 mg mL-1 when Bacillus subtillis is used.
When using biological methods, the analysis time may vary, depending on the procedure used: from six to eight hours at 37 oC21,34; from ten to twelve at 35 – 37 oC40,41, and from sixteen to
eighteen at 35 – 37 oC39,42. Also, there is not good sensibility and reproducibility. Therefore, these methods for the quantification of vancomycin in a routine method are not used nowadays.
CHROMATOGRAPHIC METHODS
The initial chromatographic analysis of vancomycin was performed on paper and used for identification purposes43,44. For separation and identification of vancomycin thin-layer chroma-tography, normal and reverse phases, were used45. Today, the HPLC is the most used technique for the vancomycin analysis, being also official method (United States Pharmacopoeia46 and British Pharmacopoeia47) for purity determination.
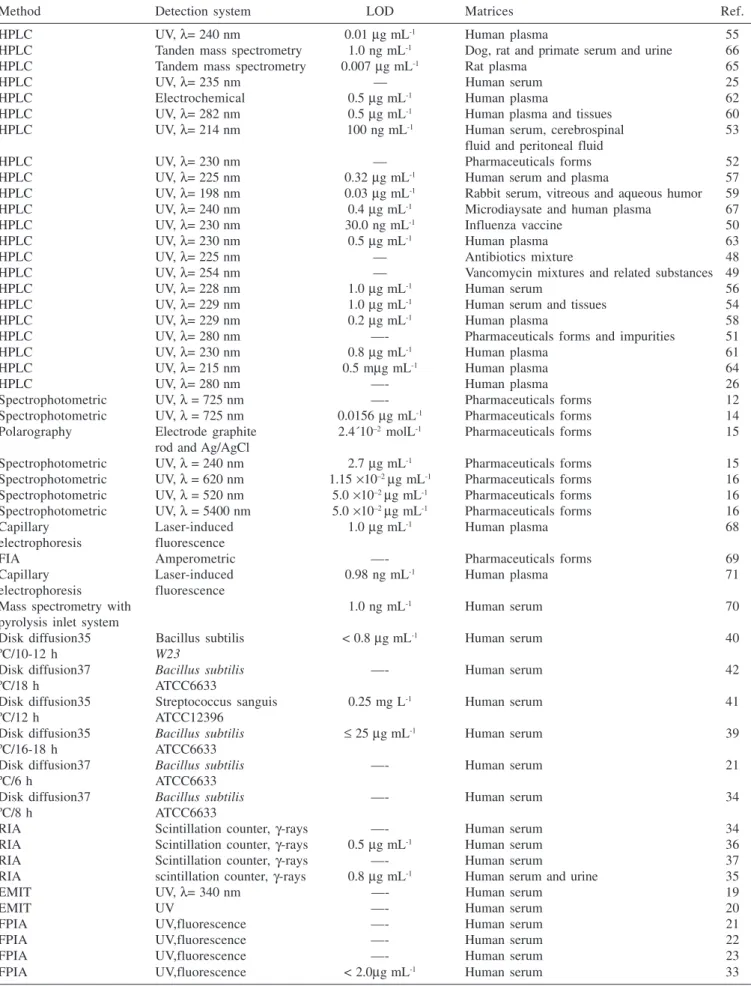
Table 1. Methods for quantification of vancomycin in biological and in pharmaceutical matrixes
Method Detection system LOD Matrices Ref.
HPLC UV, λ= 240 nm 0.01 µg mL-1 Human plasma 55
HPLC Tanden mass spectrometry 1.0 ng mL-1 Dog, rat and primate serum and urine 66
HPLC Tandem mass spectrometry 0.007 µg mL-1 Rat plasma 65
HPLC UV, λ= 235 nm — Human serum 25
HPLC Electrochemical 0.5 µg mL-1 Human plasma 62
HPLC UV, λ= 282 nm 0.5 µg mL-1 Human plasma and tissues 60
HPLC UV, λ= 214 nm 100 ng mL-1 Human serum, cerebrospinal 53
fluid and peritoneal fluid
HPLC UV, λ= 230 nm — Pharmaceuticals forms 52
HPLC UV, λ= 225 nm 0.32 µg mL-1 Human serum and plasma 57
HPLC UV, λ= 198 nm 0.03 µg mL-1 Rabbit serum, vitreous and aqueous humor 59
HPLC UV, λ= 240 nm 0.4 µg mL-1 Microdiaysate and human plasma 67
HPLC UV, λ= 230 nm 30.0 ng mL-1 Influenza vaccine 50
HPLC UV, λ= 230 nm 0.5 µg mL-1 Human plasma 63
HPLC UV, λ= 225 nm — Antibiotics mixture 48
HPLC UV, λ= 254 nm — Vancomycin mixtures and related substances 49
HPLC UV, λ= 228 nm 1.0 µg mL-1 Human serum 56
HPLC UV, λ= 229 nm 1.0 µg mL-1 Human serum and tissues 54
HPLC UV, λ= 229 nm 0.2 µg mL-1 Human plasma 58
HPLC UV, λ= 280 nm —- Pharmaceuticals forms and impurities 51
HPLC UV, λ= 230 nm 0.8 µg mL-1 Human plasma 61
HPLC UV, λ= 215 nm 0.5 mµg mL-1 Human plasma 64
HPLC UV, λ= 280 nm —- Human plasma 26
Spectrophotometric UV, λ = 725 nm —- Pharmaceuticals forms 12
Spectrophotometric UV, λ = 725 nm 0.0156 µg mL-1 Pharmaceuticals forms 14
Polarography Electrode graphite 2.4´10–2 molL-1 Pharmaceuticals forms 15
rod and Ag/AgCl
Spectrophotometric UV, λ = 240 nm 2.7 µg mL-1 Pharmaceuticals forms 15
Spectrophotometric UV, λ = 620 nm 1.15 ×10⁻² µg mL-1 Pharmaceuticals forms 16
Spectrophotometric UV, λ = 520 nm 5.0 ×10⁻² µg mL-1 Pharmaceuticals forms 16
Spectrophotometric UV, λ = 5400 nm 5.0 ×10⁻² µg mL-1 Pharmaceuticals forms 16
Capillary Laser-induced 1.0 µg mL-1 Human plasma 68
electrophoresis fluorescence
FIA Amperometric —- Pharmaceuticals forms 69
Capillary Laser-induced 0.98 ng mL-1 Human plasma 71
electrophoresis fluorescence
Mass spectrometry with 1.0 ng mL-1 Human serum 70
pyrolysis inlet system
Disk diffusion35 Bacillus subtilis < 0.8 µg mL-1 Human serum 40
ºC/10-12 h W23
Disk diffusion37 Bacillus subtilis —- Human serum 42
ºC/18 h ATCC6633
Disk diffusion35 Streptococcus sanguis 0.25 mg L-1 Human serum 41
ºC/12 h ATCC12396
Disk diffusion35 Bacillus subtilis ≤ 25 µg mL-1 Human serum 39
ºC/16-18 h ATCC6633
Disk diffusion37 Bacillus subtilis —- Human serum 21
ºC/6 h ATCC6633
Disk diffusion37 Bacillus subtilis —- Human serum 34
ºC/8 h ATCC6633
RIA Scintillation counter, γ-rays —- Human serum 34
RIA Scintillation counter, γ-rays 0.5 µg mL-1 Human serum 36
RIA Scintillation counter, γ-rays —- Human serum 37
RIA scintillation counter, γ-rays 0.8 µg mL-1 Human serum and urine 35
EMIT UV, λ= 340 nm —- Human serum 19
EMIT UV —- Human serum 20
FPIA UV,fluorescence —- Human serum 21
FPIA UV,fluorescence —- Human serum 22
FPIA UV,fluorescence —- Human serum 23
FPIA UV,fluorescence < 2.0µg mL-1 Human serum 33
Generally, it was observed that the majority of the applied methods in the determination of vancomycin with HPLC use UV detectors, working in a wavelength range from 198 nm59 to 282 nm60. Few works employ other kind of detectors, for example, Favetta et al.62 use an electrochemical detector and Shibata et al.65 employ mass spectrometry for the detection.
It can be also noted that the use of a C18 column is the most common option, associated with a variety of mobile phases. When the HPLC technique is used for the determination of vancomycin in biological fluids, the extraction procedure of the analyte is done based on chemical processes, involving protein precipitation and use of organic solvents. In some methods, however, the extraction process is associated to the chromatography as continuous systems56,59,66. Recently analytical techniques, where the samples are injected without treatment, have been developed. Kitahashi and Furuta68 developed an assay for measuring vancomycin concentration by micellar electrokinetic capillary chromatography with detection at 210 nm using direct serum injection. The migration time of vancomycin was about 7 minutes. The linearity was from 0 to 100 µg mL-1 and the limit of detection was 1.0 µg mL-1. No observed interference from 32 other antibiotics was observed.
Shibata et al.65 described a novel high-performance liquid chromatography tandem mass spectrometry method for determination of vancomycin in serum and urine without treatment. After the addition of internal standard, serum and urine samples were directly injected into a HPLC system consisting of an extraction column and dual analytical columns. The columns are connected through two switching valves.
OTHER METHODS
Chabenat et al.69 proposed the use of the complex formed between copper(II) and vancomycin for the determination of this antibiotic, in continuous flux and amperometric detection.
Mass spectrometry coupled with a pyrolysis inlet system was compared with HPLC for vancomycin determination and its crystal degradation products in human serum. Quantitative analysis was performed by selected ion monitoring method at 108 mass/charge (m/z) of the pyrolysis product of vancomycin. The detection limit of the method was 1 ng mL-1; the linearity was observed between 1 ng mL-1 and 10 mg mL-1; the relative standard deviation was 1%; the time of analysis was 30 min and sample volume 50 µL. These results are far better than those of the HPLC method. However the authors related that the HPLC method can individually determine the concentration of vancomycin and its degradation products70.
A competitive immunoassay using capillary electrophoresis with laser-induced fluorescence for vancomycin was developed. Capillary electrophoresis using a tris-glycine running buffer provided adequate separation of antibody-bound from the unbound fluorescent probe (tracer) in less than 4 min. Laser-induced-fluorescence polarization provided high sensibility detection and simultaneous monitoring of fluorescence intensity and polarization. A fluorescence polarization value of 0.30 confirmed the formation of the antibody-tracer complex. Calibration curves showed a working linear range of 2–3 orders of magnitude with a minimum detectable concentration of 0.98 ng mL–171.
CONCLUSION
As usual in quantitative analysis, the choice of the analytical method to be employed for the vancomycin analysis will be always dependent of several parameters that must be considered in each case: the analytical matrix; the sample and aliquot sizes; reagents, apparatus
and trained personnel available; cost of the analysis; precision and accuracy; time required for the complete analytical procedure.
Table 1 presents a summary of suggested methods in the analytical literature for the quantitative analysis of vancomycin in several matrices. It can be easily observed that HPLC is the preferred method either for the analysis in biological or pharmaceutical material. However, for the routine analysis in hospitals, in serum or plasma, immunologic methods are the most used7.9. Despite these methods present a relatively high cost and possible interferences, they allow rapid results, exempt pre treatment of the samples and are processed with automatic apparatus. Comparing HPLC methods with the immunologic, it is observed that the former presents better accuracy and precision but higher analytical delay and involve pre extraction of the analyte. To avoid the necessity of the pre treatment some HPLC with direct injection, using pre extraction columns, have been suggested54,66.
Biological assays are also used for vancomycin quantification, inclusive in the last edition of the United States Pharmacopoeia47. However they are not used for routine analysis if biological fluids or medicines as they are slow, involve much laboratory work, present low precision and accuracy and are non specific. In the case of patients treated with more than one antibiotic the results can be seriously affected.
HPLC have been also used for the analysis of medicines, presenting detection limits as low as 1 ng mL-1. Spectrophotometric detectors are the more frequently used despite the fact that the more sensitive methods are those using mass detectors65.66.
The high specificity of the HPLC procedures allows the analysis of vancomycin in presence of other substances in automated systems, characteristics that justify the intense use of this technique in the analysis of this antibiotic as it was also indicated, in a recent article, by Görög72. The relatively recent use of capillary electrophoresis has been observed. The results obtained with this technique are similar to those obtained with HPLC but with lower cost.
The spectrophotometric methods are also used mainly due to the low cost and operational simplicity. In the case of pharmaceutical analysis the detection limits are comparable to those obtained with HPLC. Their main disadvantage is the usual low specificity in presence of similar chromophoric systems as those of the drug material.
Due to the complexity of the vancomicyn molecule and its size, its quantitative analysis in biological matrixes and even in pharmaceutical products can’t be considered a simple and cheap matter. In our point of view, in face of the therapeutic importance of this antibiotic and, of its toxic level, the development of new reliable methods for vancomycin analysis, in various matrixes, must be rapid and simple and, if possible, with low cost is necessary. Efforts must be done in this direction. This opinion is reinforced if it is remembered that, in a great part of the world, the financial sources destined to the public health are so small that even for the antibiotic acquisitions they are not always sufficient. Imagine how difficult it is to use analytical and necessary procedures that demand expensive devices and extremely specialized professionals.
REFERENCES
1. Willian, D. H.; Kalman, J. R.; J. Am. Chem. Soc. 1976, 99, 2768. 2. Sheldrick, G. M.; Jones, P. G.; Kennard, O.; Willians, D. H.; Smith G. A.;
Nature1978, 271, 223.
3. Tavares, W.; Manual de antibióticos e quimioterápicos, 3ª ed., Atheneu: São Paulo, 2002.
4. Srinivasan, A.; Dick, J. D.; Perl, T. M.; Clin. Microb. Reviews2002, 15, 430. 5. Menichetti, F.; Clin. Microbiol. Infection2005, 11, 22.
6. Woodford, N.; Clin. Microbiol. Infection 2005, 11, 2. 7. Hammett-Stabler, C. A.; Johns, T.; Clin. Chem. 1998, 44, 1129. 8. Davani, S.; Muret, P.; Royer, B.; Hoen, B.; Kantelip, J. P.; Ann. Biol. Clin.
9. Tobin, C. M.; Darville, J. M.; Thomson, A. H.; Sweeney, G.; Wilson, J. F.; Macgowan A. P.; White, L.O.; J. Antimicrob. Chemother. 2002, 50, 713. 10. Freeman, C. D.; Quintiliani, R.; Nightingale, C. H.; The Ann. Pharmacother.
1993, 27, 594.
11. Begg, J. E.; Barclay, M. L.; Kirkpatrick, C. M. J.; J. Clin. Pharmacol. 2001, 52, 355.
12. Fooks, R. J.; McGilveray, I. J.; Strickland, R. D.; J. Pharm. Sci.1968, 57, 315. 13. Rao, G. R.; Kanjilal, G.; Mohan, K. R.; Analyst1978, 103, 993.
14. El-Ashry, S. M.; Belal, F.; El-Kerdawy, M. M.; Elwasseef, D. R.; Mikrochim. Acta 2000, 135, 191.
15. Belal, F.; El-Ashry, S. M; El-kerdawy, M. M.; El-Wasseef, D. E.; Arzneim. Forsch. 2001,51, 763.
16. Sastry, C. S. P.; Rao, T. S.; Rao, P. S. N. H. ; Prassa, U. V.; Mikrochim. Acta2002, 140, 109.
17. White, L. O.; Edwards, R.; Holt, H. A.; Lovering, A. M.; Finch, R. G.; Reeves, D. S.; J. Antimicrob. Chemother.1988, 22, 739.
18. Antipas, A.; Velder, D. V.; Stella, V. J.; Int. J. Pharm.1994, 109, 261. 19. Anne, L.; Hammad, N.; Chang, C. C.; Laungani, D.; Gottwald, K.;
Alexander, S.; Centofanti, J.; Clin. Chem.1988, 34, 1256. 20. Yeo, K.; Traverse, W.; Horowitz, G. L.; Clin. Chem. 1988, 34, 1257. 21. Pohlod, D. J.; Saravolatz, L. D.; Somerville, M. M.; J. Clin. Microbiol.
1984, 20, 159.
22. Azzazy, H. M. E.; Chou, P. P.; Tsushima, J. H.; Troxil, S.; Gordon, M.; Avers, R. J.; Chiappetta, E.; Duh, S.; Christenson, R. H.; Ther. Drug Monit. 1988, 20, 202.
23. Hermida, J.; Zaera, S.; Tutor, J. C.; Ther. Drug Monit. 2001, 23, 725. 24. Ristuccia, P. A.; Ristuccia, A. M.; Bidanset, J. H.; Cunha, B. A.; Ther. Drug
Monit. 1984, 6, 238.
25. Hu, M. W.; Anne, L.; Forni, T.; Gottwald, K.; Ther. Drug Monit. 1990, 12, 562. 26. Najjar, T.; Al-Dhuwailie, A. A.; Tekle, A.; J. Chromatogr., B: Anal. Technol.
Biomed.Life Sci. 1995, 672, 295.
27. Morishige, H.; Shuto, H.; Ieiri, I.; Otsubo, K.; Oishi, R.; Ther. Drug Monit.
1996, 18, 80.
28. Peckamn, H.; Dupuis, R. E.; Sawyer, W. T.; Brower, K. L. R.; Cross, S, R. E.; Ther. Drug Monit. 1996, 18, 647.
29. Bowhay, S.; Timms, P.; Ther. Drug Monit. 1997, 19, 117. 30. Paap, C. M.; Sharpe, G. L.; Dev. Pharmacol Ther. 1993, 20, 174. 31. Zaera. S.; Hermida, J.; Tutor, C.; Ther. Drug Monit.2002, 24, 696. 32. Iwamoto, T.; Kagawa, Y.; Kojima, M.; Ther. Drug Monit. 2005, 27, 56. 33. Adamczyk, M.; Brate, E. M.; Chiappetta, E. G.; Ginsburg S.; Hoffman, E.;
Klein, C.; Perkowitz, M. M.; Rege, S. D.; Chou, P. P.; Constantino, A. G.; Ther. Drug Monit. 1998, 20, 191.
34. Crossley, K. B.; Rotschafer, J. C.; Chern, M. M.; Mead, K. E.; Zaske, D. E.; Antimicrob. Agents Chemother. 1980, 17, 654.
35. Fong, K. L.; Ho, D. W.; Bogerd, L.; Antimicrob. Agents Chemother. 1981, 19, 139.
36. Blouin, R. A.; Bauer, L. A.; Miller, D. D.; Rercord, K. E.; Griffen, W.; Antimicrob.Agents Chemother.1982, 21, 575.
37. Ackerman, B. H.; Berg, H. G.; Strate, R. G.; Rostschafer, J. C.; J. Clin. Microbiol. 1983, 18, 994.
38. Pinto, T. J. A.; Kaneko, T. M.; Ohara, M. T.; Controle biológico de produtos farmacêuticos, correlatos e cosméticos, 2ª ed., Atheneu: São Paulo, 2004.
39. Walker, C. N.; Antimicrob. Agents Chemother. 1980, 17, 730. 40. Walker, C. N.; Kopp, B.; Antimicrob. Agents Chemother. 1978, 13, 30. 41. Durodie, J. ; Coleman, K.; J. Antimicrob. Chemother. 1992, 29, 347. 42. Kureishi, A.; Jewesson, P. J.; Bartlett, K. H.; Cole, C. D.; Chow, A.W.;
Antimicrob.Agents Chemother. 1990, 34, 1642. 43. Betina, V.; J. Chromatogr. 1963, 15, 379.
44. Bristish Pharmacopeia; General Medical Council: London, 1963, p. 869. 45. Nowakowska, J.; Halkieewicz, J.; Lukasiak, J. W.; Chromatographia2002,
56, 367.
46. Bristish Pharmacopeia; Bristish Pharmacopeia Commission: London, 2002, vol. 1.
47. The United State Pharmacopeia; The National Formulary, 25td ed., United States Pharmacopeial Convention: Rockville, 2005.
48. Kirchmeier, R. L.; Upton, R. P.; Anal. Chem. 1978, 50, 349. 49. Inman, E. ; J. Chromatogr. 1987, 410, 363.
50. Forlay-Frick, P.; Nagy, Z. B.; Fekete, J.; Kettrup, A.; Gebefugi, I.; J. Liq. Chromatogr. Relat. Technol.2001, 24, 497.
51. Diana, J.; Visky, D.; Roets, E.; Hoogmartens, J.; J. Chromatogr., A 2003, 996, 115.
52. Forlay- Frick, P.; Fekete, J.; J. Liq. Chromatogr. Relat. Technol. 2004, 27, 123. 53. Jehl, F.; Gallion, C.; Thierry, R. C.; Monteil, H.; Antimicrob. Agents
Chemother.1985, 27, 503.
54. Bauchet, J.; Pussard, E.; Garaud, J. J.; J. Chromatogr. 1987, 414, 472. 55. Hosotsubo, H. ; J. Chromatogr., B: Anal. Technol. Biomed. Life Sci.1989,
487, 421.
56. Demotes-Mainard, F.; Labat, L.; Vinçon, G.; Bainnwarth, B.; Ther. Drug Monit. 1994, 16, 293.
57. Li, L.; Miles, M. V.; Hall, W.; Carson, S.; Ther. Drug Monit.1995, 17, 366. 58. Luksa, J.; Marusic, A.; J. Chromatogr.B:Anal. Technol. Biomed. Life Sci.
1995, 667, 227.
59. Del Nozal, M. J.; Bernal, J. L; Pampliega, A.; Marinero, P.; López, M. I.; Coco, R.; J. Chromatogr., A 1996, 727, 231.
60. Farin, D.; Piva, G. A.; Gozlan, I.; Kitzes-Cohen, R.; J. Pharm. Biomed. Anal.1990, 18, 367.
61. Belli, C. V.; Dissertação de Mestrado, Universidade de São Paulo, Brasil, 2000.
62. Favetta, P.; Guiton, J.; Bleyzac, N.; Dufresne, C.; Bureau, J.; J. Chromatogr., B:Anal. Technol. Biomed. Life Sci.2001, 751, 377.
63. Santos, C. R.; Feferbaum, R.; Paula, M. L. S. A.; Bertoline, M. A.; Omosako, C. E. K.; Santos, S. R. C. J.; Rev. Bras. Ciências Farmac. 2001, 37, 87. 64. Saito, M.; Santa, T.; Tsunoda, M.; Hamamoto, H.; Usui, N.; Biomed.
Cromatogr.2004, 18, 735.
65. Shibata, N.; Ishida, M.; Prasad, Y. V. R.; Gao, W.; Yoshikawa, Y.; Takada, K.; J. Chromatogr., B: Anal. Technol. Biomed. Life Sci.2003, 789, 211. 66. Cass, T. R.; Villa, J. S.; Karr, D.E.; Schmidt Jr, D. E.; Rapid Commun.
Mass Spectrom. 2001, 15, 406.
67. Plock, N.; Buerger, C.; Kloft, C.; Biomed. Chromatogr. 2005, 19, 237. 68. Kitahashi, T.; Furuta, I.; Clin. Chim. Acta2001, 312, 221.
69. Chabenat, C.; Andre, D.; Boucly, P.; Talanta 1983, 30, 963.
70. Ghassempour, A.; Darbandi, M. K.; Asghari, F. S.; Talanta 2001, 55, 573. 71. Lam, M. T.; Le, X. C.; Analyst 2002, 127, 1633.