Heuristics for the optimized deployment of
small cells in next-generation networks
Abstract— Heterogeneous Networks (HetNets) have been introduced as an alternative means of improving the overall network capacity. However, HetNets increase the complexity and cost of transport due to the large number of smallcells (SCs) that have to be connected, and hence, it is essential to investigate the best way to plan the joint deployment of radio and transport resources. For this reason, some planning strategies have been put forward in the literature with the aim of reducing both the number of SCs and amount of transport. These systems are generally based on OFDM (Orthogonal Frequency Division Multiplexing) which uses a radio frequency range from 2 to 20 GHz. However, those papers do not evaluate path loss, which is a major component in the analysis or how to design the link budget of a telecommunication system. In this paper, we examine a heuristic for the joint planning of radio (i.e., SCs) and transport resources (i.e., point-to-point fiber links) by using suitable propagation models for next generation networks. Through the proposed heuristics, it is possible to save up to 12% of the total costs of the network deployment incurred by other systems found in the literature.
Index Terms—HetNets, Small Cell, Transport, Deployment Costs, Heuristics.
I. INTRODUCTION
In recent years, several possible solutions for the deployment of Small Cells (SCs) have emerged,
that investigate how to provide backhaul to transport data to/from a gateway node (a node with an
existing fiber point, often co-located with a macrocell) in the core network. Radio Network Planning
(RNP) is essential for operators to deploy wireless cellular networks in a cost-effective manner;
however, in the optimization process, this must take account of both the radio features, and transport. .
In particular, it must include its inevitable migration to the Cloud Radio Access Networks (C-RAN),
which provide key solutions for ensuring an efficient allocation and management of baseband
processing resources, which are essential for forthcoming ultra-dense deployments.
C-RAN is the key architecture of the 5G networks and should be able to support faster data rates
(up to 10 Gb/s) and more bandwidth than the preexisting cellular technologies. Another important
feature of 5G is the dense Base Station (BS) deployment in HetNets. Studies show that 80% of
subscribers are concentrated in 20% of the sites of the network. Thus, it is clear that the use of
high-capacity technology as backhaul in traditional architecture and fronthaul in the C-RAN architecture, is Welton V. Araujo, Edvar da L. Oliveira, Daniel da S. Souza, Diego L. Cardoso
Operational Research Laboratory Federal University of Pará, Augusto Correa 01,
Belém, Pará, Brazil
becoming extremely necessary.
There have been discussions in the literature about the possible solutions for improving the
transport/fronthaul network technology, including copper, microwave, and optics. In [1], the results
were based on an urban area where the level of traffic varies from the requirements of today to those
envisaged for the year 2022. Moreover, they showed that HetNet deployments based on small BSs
with a fiber-based transport system, are a very attractive means of providing coverage and capacity in
densely populated areas.
Fiber -based backhaul offers the high rates needed to meet this requirement, but it is costly [2] and
time-consuming to deploy, when not readily available. Thus, when deploying the infrastructure of
next-generation cellular systems, backhaul links should be included in combination with small cells
(SCs) to reduce network costs and optimize performance. There are works in this field of the utmost
importance including Guo et al. [3], who established a theoretical framework to maximize the spectral
efficiency of the network and avoid interference caused by SC deployment, Cheng et al. [4] and
Shimodaira et al. [5] who adopted the throughput of a system as the performance metric to find
optimal locations for placing small static cells. There is also the work of Coletti et al. [6] and [7] who
devised outage-minimum deployment mechanisms in realistic metropolitan scenarios. However, all
these studies fail to include aspects of backhaul technology in their SC implantation scheme.
Most of the existing works related to BS deployment, have tended to focus on radio deployment
scenarios without investigating the transport network. Even when this factor is included, they are
concerned with scenarios in which high-speed, fiber-enabled wired backhaul sites are available
everywhere [8][9][10].
Only recently, have [11] studied the optimal placement of SCs and investigated limited fiber access
nodes that rely on a commercially available CPLEX linear programming solver. However, as pointed
out in the paper, the computation time was very significant and depended on the scale of the dataset.
For this reason, [11] and [12] adopted a heuristic approach, that takes account of the existence of fiber
resources that are sparsely located. Different scenarios were chosen to plan a SC network and its
backhaul in a semi-optimal way, which included real-world factors like interference, costs, coverage
and QoS (Quality of Service) parameters. The authors stated that the complexity of deploying SCs
and predicting their performance can be reduced by finding approximate deployment locations with
the aid of key network parameters.
However, they fail to consider the important impact of Path loss (or path attenuation) which is the
main component in the analysis and design of the link budget of a telecommunication system. Path
loss is the reduction in power density (attenuation) of an electromagnetic wave as it propagates
through space. The role of propagation models is very important to design base stations and deploy
them for the best receiving signal.
Thus, while previous studies have examined serious deployment problems, to the best of our
backhaul nodes, which include cross-layer requirements like minimum capacity, user distribution,
coverage and interference mitigation, by means of propagation models recommended for 5G
networks.
The rest of the paper is structured as follows: in Section II, we provide an overview of the network
parameters. Following this, there is an examination of the proposed heuristics in Section III, together
with the network elements used. The results are analyzed in Section IV. Finally, the conclusions are
summarized, along with suggestions for future work in Section V.
II. NETWORK PARAMETERS
The downlink Signal-to-Interference-Plus-Noise Ratio (SINR) over a given subcarrier n assigned to
user k, can be modeled as follows:
� �=� + ���, �
�. (1)
In which ��, � is the received power on subcarrier n assigned to user k by its serving BS b(k), � is
the thermal noise power, and �� is the intercell interference from neighboring SCs. It was assumed that
all the SCs are transmitting with maximum power PS. The received power at user k from BS� can be
calculated by means of Equation 2, which relates the received power to a node as a result of the
transmitted power and the fading of the signal calculated by Stanford University Interim (SUI) model
[13]. This can be expressed as:
��, � =
���� � −����
. (2)
The value of � is calculated by the three equations shown below:
� = + � log + , > . (3)
= log4�� . (4)
� = − ℎ + ℎ . (5)
In which:
• d= distance from the antenna to the measured point, in meters. • = 1 meter, reference distance according to [14].
• �= wavelength, in meters. • �= path-loss exponent.
• ℎ = height of base station height, which can be between 10 to 80 meters.
TABLE I. TYPE SIZES AND APPEARANCE [12]
Constant Terrain A Terrain B Terrain C
A 4.6 4 3.6
B 0.0075 0.0065 0.005
C 12.6 17.1 20
The use of the SUI model aimed to simulate environments close to reality. By correctly assigning
the input parameters, it is possible to simulate urban and suburban environments with shadowing [13].
Each user achieves the Shannon capacity [15], i.e., the data rate for user k is expressed in (6) as:
�= log + � � . (6)
In which B is the bandwidth.
III. PROPOSED HEURISTICS-BASEDSOLUTION
Consider a geographical area A where a number of SCs must be deployed. The candidate location
set is given by St = S ∪ Sf where S contains the possible places to install a SC though without fiber
connection and Sf the locations with fiber backhaul connections. Note that these fiber access points
(FAPs) are also potential locations for the SC deployments, since the SCs must be connected to the
core network through some kind of backhaul solution. In the interests of simplicity, each element of
Sf is termed a node. We define the variable for deployment as follows:
� ={ , If the i
thnode is selected to place a SC.
, ℎ � . (7)
The 5G networks accessing scheme has not been defined yet, and for this reason, the orthogonal
frequency division multiple access (OFDMA) was used as an accessing scheme. As proposed in [10],
it was assumed that N subcarriers were available for downlink transmission and that there was a
predefined user distribution in an area of interest. A simple model was employed for the
non-heterogeneous distribution of users, who were randomly distributed in the whole of the map and
divided into two areas: a central area for the majority of users and a surrounding area for the rest.
The objective of the heuristics is to find the minimum number of SCs that can still guarantee
coverage and the capacity requirements for all the users and reduce the total cost of deployment,
including that of both the wireless and wired infrastructure. It can be assumed that each user can only
be served by exactly one BS and, thus, user demand is unsplittable. In formal terms, the problem can
be formulated as:
� � = ∑ �. �
�=
. (8)
�= + �, � �+ �� . (9)
In which:
• � = the Binary variable that assumes value 1 if it is decided to deploy the SC;
• �= Total Cost of SC i;
• �= Trenching costs per unit; • �� = Fiber costs per unit;
• �= Position where SC i is deployed; • �= Position of the point of access for SC i;
• , =Distance between point p to q based on Taxicab geometry;
, = ∑ | �− �| �
�=
. (10)
As can be seen, the mobile SC deployment problem is an NP-hard problem and can be proved by
mitigating the facility location problem, the proof is omitted here due to lack of space but can be
found in [16], in which the authors formulate an optimization SC deployment problem with the
objective to maximize the service time provided by SCs for all users with the consideration of a finite
number of SCs and inter-cell/cross-cell interference. A heuristic was implemented to reduce the total
deployment cost of a SC network and its fiber-based backhaul, represented by the flowchart shown in
Figure 1. The users' BS assignment is determined by the best signal power that the user can obtain,
taking into account all the BSs in the network.
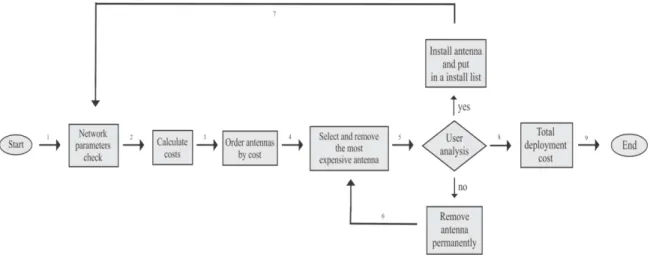
Fig. 1. Proposed heuristics flowchart
Heuristics starts with the users’ BS assignment and capacity for calculation; this procedure is necessary to find out if all the users are being served by some SC and if they reach the minimum
throughput. These stages are represented in the process for checking the network parameters. After
this, the deployment costs, are calculated for each SC and these values are used to define the BS test
sequence.
The test begins with the selection of the most expensive BS in the set, which is removed from the
involves analyzing all the users to find out if the requirements for coverage and throughput were met.
If one of these requirements is lacking, the BS is considered to be required (answer yes) and placed in the install list, but if all the users’ requirements are met (answer no) the BS is rejected.
If there is a yes answer, the SC is installed and becomes a FAP. In this case, it is necessary to
recalculate the cost for the remaining SCs candidates (arrow 7), but this step is not necessary if the BS
has been removed (arrow 6).
This procedure is repeated until all the BSs are tested, and finally the calculation of the total
deployment cost is made through Equation 9. The nodes are interconnected by means of Prim's
algorithm [17], which is a greedy algorithm that finds a minimum spanning tree for a weighted
undirected graph. This algorithm is used worldwide in the literature as a standard for comparisons,
although our framework is flexible enough to use any other algorithm.
IV. RESULTS
This section outlines the results from the application of the heuristic in the joint deployment of
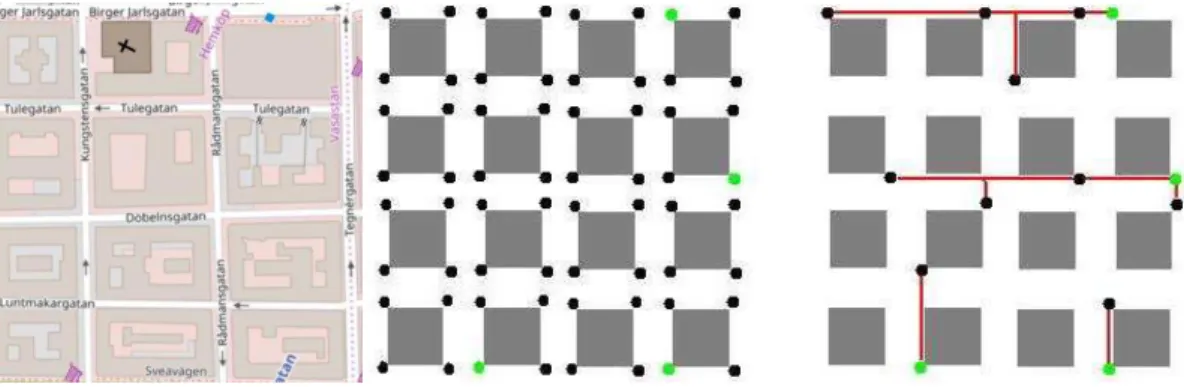
radio and transport. The urban scenario under examination was designed as a Manhattan grid model
where SCs can be placed at each of the four corners of a block. The SCs were represented by black
dots and FAPs were positioned in different places (represented by green dots), as shown in Figure 3.
No macro layer was included in these scenarios. All tests were performed on a computer with 5th Gen Intel® Core ™ i5 processor, 1TB SSHD, 16GB DDR4 memory.
The approach described in Fig 1 [11] will allow the SC deployment to be made on the basis of the
signal level and quality, although the use of propagation models is acceptable for 5 Ghz. This is based
on the premise that the position of the FAPs and the user distributions play a very important role in
defining the deployment scenarios.
For the sake of comparison, two other approaches were implemented. The first, called the Users
approach, is a well-known algorithm which is aimed at maximizing the number of users in the same
BS, and in this way, reducing the number of SCs. The other is based on [10], henceforth called the 5G
approach, which seeks to reduce the number of SCs by taking account of factors such as SINR and
throughput, although none from the transport network.
As discussed in the earlier sections, areas with dense deployments were added to our simulated
network to illustrate some of the key operations of 5G networks. Figure 2 shows a central region
called the business area, which contains the highest density of users; the surrounding area (which is
larger) is considered residential, and has medium user density.
The dense user areas were overlaid on top of the uniform user distribution and these sites represent
crowded areas such as malls, football stadiums, and locations with high indoor traffic. The general
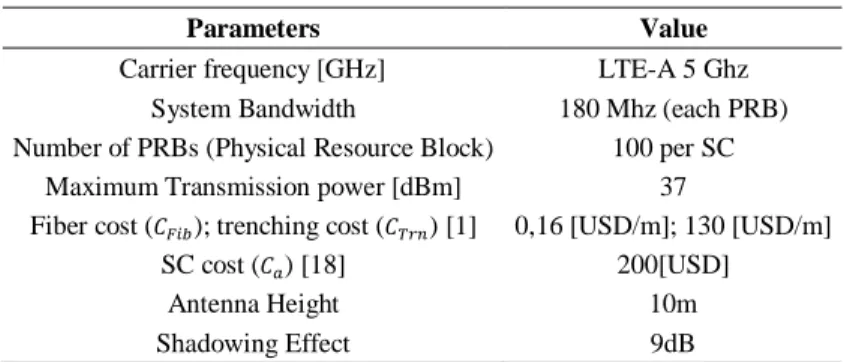
TABLE II.NETWORK PARAMETERS
Parameters Value
Carrier frequency [GHz] LTE-A 5 Ghz
System Bandwidth 180 Mhz (each PRB)
Number of PRBs (Physical Resource Block) 100 per SC
Maximum Transmission power [dBm] 37
Fiber cost ( ��); trenching cost ( �) [1] 0,16 [USD/m]; 130 [USD/m]
SC cost ( ) [18] 200[USD]
Antenna Height 10m
Shadowing Effect 9dB
LTE-A or LTE-Advanced is a mobile communication standard and a major enhancement of the
Long Term Evolution (LTE) standard. In OFDMA, users are allocated a specific number of
subcarriers for a predetermined amount of time. These are referred to as physical resource blocks
(PRBs) in the LTE specifications.As can be seen in Table II, the carrier frequency used was 5Ghz, as
expected in future 5G networks. With this frequency, it is necessary to add a frequency correction
factor (Equation 11) in Equation 3:
∆ � = 6 log . (11)
Where f is the frequency, used in MHz.
Fig. 3. Example of the SC deployment process
Two different scenarios were created to quantify this effect. First a wider scenario, of 2 x 2 km, was
set up to demonstrate how the heuristics perform in larger areas. However, as indicated in [19], the SC
deployment for 5G networks should not be restricted to the area, but also include the question of user
density. In this way, a small scenario, corresponding to a dense area, was implemented, (of 1x 1km),
using the same number of users.
A. Deployment of SCs – First Scenario
As stated earlier, the results given in this section are based on a scenario of 2 x 2 km, when three
different numbers of users are used - 100, 200 and 300. 80% of users are allocated in the dense area.
The remainder are distributed to other regions.
The results from Figures 4 and 5 confirm that if the cost of the wireless and transport resources is
taken into account in the decision-making stage, it is possible to reduce the overall cost of the network
deployment. In fact, this approach allows savings to be made of up to 11.32% when compared with
the user approach, in all the scenarios. This represents savings of, on average, US$ 899.23,
(equivalent to 12.29 % of the total budget of the Users approach), which can then be spent in other
areas. When compared with the approach adopted in [10] this difference is even more significant, with
an increase of up to 27.08%, which represents a sum of US$ 1,876.49.
The results were achieved through successive eliminations of SCs, starting with the BSs which had
higher deployment costs (they were further away from the access points and had fewer users). The
transport proposal selected points that were near the existing infrastructure, which enabled it to be
used again, and this directly affected the total cost. Sometimes this decision leads to a small increase
in the number of SCs (Figure 5), although it does not influence the total cost of the deployment. The
reason for this is the dominating component of the trenching costs which, with our approach, is
responsible for almost 45% of the total cost in all the scenarios. This was anticipated, because
trenching, (as explained in [12]), is the most expensive part of an optical project.
It is also worth highlighting that the savings in the total deployment costs in the network obtained
from the proposed heuristics, do not affect the quality of the broadband service delivered to the users
(table III), i.e., in all cases the data-rate requirements have been met. Although there are extremely
dense areas, the average throughput of the users remains within acceptable values and, is the
equivalent of that found in other approaches.
TABLE III.THROUGHPUT BEHAVIOR (KBPS)
Number of Users Transport Users 5G Paper
100 791,86 847,36 773
200 775 856,91 796,66
300 763,33 872,38 820,48
It is important to emphasize that the approach developed has equivalent or much shorter execution
time than other approaches found in the literature, as can be seen in Table 4, which shows that, despite
considering other aspects in decision making process, these do not affect the time of Execution or
complexity of the algorithm.
TABLE IV.EXECUTION TIME (S)
Number of Users Transport Users 5G Paper
100 515.76 509.17 1030.63
200 1552.84 1526.71 3105.02
300 3129.78 3101.07 6238.81
B. Deployment of SCs for 1000 x 1000 m
The results given in this section are based on a smaller scenario of 1 x 1Km, and with the same
numbers of users (100, 200 and 300). The position of FAP was selected in the regions bordering the
dense area. Again, 80% of users are allocated the dense area. The remainder are spread in other
regions.
Initially the SCs were arranged at a distance of 100 meters apart, which meant that a total of 100
SCs could be installed. All the algorithms achieved a sharp fall in the number of SCs, which were
reduced by 91.47%, 91.43% and 90.77% - the number of SCs in the approaches based on transport,
The transport system selected BSs that were close to the existing infrastructure, which enabled it to
be used again, which directly affected the total cost. This is illustrated in Figure 6, where it always
kept the same number of SCs (Figure 7). The transport part (trenching and fiber) is responsible for
almost 87% of the total cost in the scenario which involved 100 users and 62% when there were 300
users.
Fig. 6. Average Total Cost for 1 x1 Km². Fig. 7. Average Number of SCs for 1 x 1 Km²
TABLE V.PERCENTAGE OF THE TOTAL COST IN THE TRANSPORT PART (TRENCHING PLUS FIBER)
Number of Users Transport Users 5G Paper
100 86.77 76.90 78.28
200 64.10 49.55 44.09
300 61.87 49.61 43.91
It is clear from Table V that the denser the scenario, the lower is the effect of transport on the total
cost. This can be attributed to the cost relation established between the values of a SC (US$ 200) and
transport (fiber US$ 0.16 and trenching US$ 130, per meter), that can be obtained from the literature
[1][18]. However, it should be emphasized that the difference in transport costs between the proposed
approaches tends to grow as the scenario becomes denser, which is caused by the better use of
infrastructure in the decision-making process of SC deployment.
V. CONCLUSION
Small Cells provide an increase in the coverage and offloading of the Macro cells, thus relieving the
mobile network, which was not initially designed for data traffic. However, the optimal allocation of
SCs is still an open question and becomes even more complex when factors such as transport network
and minimal quality of service are taken into account. By adopting a heuristic allocation approach
using future network propagation models, this work sought to provide users with the minimum levels
of service quality necessary and reduce the total cost of SC and transport deployment.
As can be seen from the results, a significant reduction in the total costs was achieved, especially in
small scenarios, depending on the user distribution, position and number of the FAPs. The results
the following benefits can be derived from this work: (a) a heuristic evaluation of SCs and Transport
Deployment for future generation networks which took account of the following: user distribution,
coverage, minimal capacity and path-loss, (b) unlike the methods employed in other studies in the
literature, the heuristics set was built by including cross layer factors (throughput and SINR).
Finally, with regard to the limitations of this study, it should be pointed out that no specific studies
were conducted, such as: (a) the changing position of users during a particular period of time and (b)
the traffic requirements for different applications. These questions will be the subject of inquiry in
future work.
REFERENCES
[1] M. Fiorani, S. Tombaz, F. Farias, L. Wosinska, and P. Monti, “Joint design of radio and transport for green residential
access networks,” IEEE Journal on Selected Areas in Communications, vol. 34, no. 4, April 2016.
[2] M. N. Islam, A. Sampath, A. Maharshi, O. Koymen, and N. B. Mandayam, “Wireless backhaul node placement for
small cell networks,” in Proc. 48th CISS, Princeton, NJ, USA, Mar. 19–21, 2014, pp. 1–6.
[3] W. Guo, S. Wang, X. Chu, J. Zhang, J. Chen, and H. Song, “Automated small-cell deployment for heterogeneous
cellular networks,” IEEE Commun. Mag., vol. 51, no. 5, pp. 46–53, May 2013.
[4] H. T. Cheng, A. Callard, G. Senarath, H. Zhang, and P. Zhu, “Step-wise optimal low power node deployment in lte
heterogeneous networks,” IEEE VTC, pp. 1–4, 2012.
[5] H. Shimodaira, G. K. Tran, S. Tajima, K. Sakaguchi, K. Araki, N. Miyazaki, S. Kaneko, S. Konishi, and Y. Kishi,
“Optimization of picocell locations and its parameters in heterogeneous networks with hotspots,” IEEE PIMRC, pp.
124–129, 2012.
[6] C. Coletti, P. Mogensen, and R. Irmer, “Deployment of lte in-band relay and micro base stations in a realistic
metropolitan scenario,” IEEE VTC, pp. 1–5, 2011.
[7] C. Coletti, L. Hu, N. Huan, I. Z. Kovacs, B. Vejlgaard, R. Irmer, and ´ N. Scully, “Heterogeneous deployment to meet
traffic demand in a realistic lte urban scenario,” IEEE VTC, pp. 1–5, 2012.
[8] H.-Y. Hsieh, S.-E. Wei, and C.-P. Chien, “Optimizing small cell deployment in arbitrary wireless networks with
minimum service rate constraints,” IEEE Trans. Mob. Comput., vol. 13, no. 8, pp. 1801–1815, 2014.
[9] W. Zhao, S. Wang, C. Wang, and X. Wu, “Cell planning for heterogeneous networks: An approximation algorithm,” in Proc. IEEE International Conference on Computer Communications (INFOCOM), April 2014, pp. 1087–1095. [10]W. El-Beaino, A. El-Hajj, and Z. Dawy, “On Radio Network Planning for Next Generation 5G Networks: A Case
Study”, Proc. Int’l. Conf. Commun., Signal Processing, and Their Applications, 2015, pp. 1–6.
[11]D. Cardoso, M. Fiorani, L. Wosinska, and P. Monti, "Joint Planning of Small Cells and Optical Transport Deployment in Heterogeneous Mobile Networks," in Asia Communications and Photonics Conference 2016, OSA Technical Digest (online) (Optical Society of America, 2016), paper AF1E.1.
[12]C. Ranaweera, C. Lim, A. Nirmalathas, C. Jayasundara, and E. Wong, “Cost-optimal placement and backhauling of small-cell networks,” J. Lightw. Technol., vol. 33, no. 18, pp. 3850–3857, Sep. 2015.
[13]IEEE 802.16 Broadband Wireless Access Working Group. "Channel Models for Fixed Wireless Applications", IEEE Call for Contributions, 2001.
[14]Sulyman A I, Alwarafy A, MacCartney G R, Rappaport T S, Alsanie A. "Directional Radio Propagation Path Loss Models for Millimeter-Wave Wireless Networks in the 28-, 60-, and 73-GHz Bands". IEEE Transactions on Wireless Communications, vol. 15, pp. 6939 – 6947, 2016.
[15]Shannon C E, “Communication in the Presence of Noise”. Proceedings of the IRE, vol. 37 pp. 10-21, 1949.
[16]Chou S-F, Yu Y-J, Pang A-C. Mobile Small Cell Deployment for Service Time Maximization over Next Generation Cellular Networks. IEEE GLOBECOM, 2014.
[17]K. Jeremy, G. John "Graph Algorithms in the Language of Linear Algebra", Software, Environments, and Tools, p. 55, 2011.
[18]Mahloo, Mozhgan, et al. "Cost modeling of backhaul for mobile networks." Communications Workshops (ICC), 2014 IEEE International Conference on. IEEE, 2014.
[19]G. Auer, V. Giannini, C. Desset, I. Godor, P. Skillermark, M. Olsson, M.A. Imran, D. Sabella, M.J. Gonzalez, O.