Ar
ti
cl
e
0103 - 5053 $6.00+0.00
*e-mail: [email protected]
pH Effect in Aquatic Fulvic Acid from a Brazilian River
Sérgio da Costa Saab,*,a Eduarda R. Carvalho,b Rubens Bernardes Filho,b
Márcia R. de Moura,c Ladislau Martin-Netob and Luiz Henrique C. Mattosob
aDepartamento de Física, Universidade Estadual de Ponta Grossa, 84030-999 Ponta Grossa-PR, Brazil
bEmbrapa Instrumentação Agropecuária, 13560-970 São Carlos-SP, Brazil
cInstituto de Física de São Carlos, Universidade de São Paulo, Av. Trabalhador São-carlense, 400,
CP 369, 13560-970 São Carlos-SP, Brazil
Estudos do comportamento morfológico dos ácidos fúlvicos foram realizados utilizando a técnica de microscopia de força atômica aliada às técnicas de potencial zeta e espectroscopia de luorescência. Os resultados mostraram que o ácido fúlvico (AFA) de um rio tropical mudou a sua morfologia quando variado o pH da solução aquosa dos AFA. Em pH ácido a morfologia é mais granular formando aglomerados de altura entre 10-55 nm. Em pH alcalino os valores foram de 2,5-4,0 nm, sendo que a morfologia em condições alcalinas é aberta formando estruturas não granulares. Estes resultados sugerem que para pH 3,5 as interações eletrostáticas são fracas e as ligações de hidrogênio são responsáveis pela formação de agregados, enquanto em pH 9,0 as interações eletrostáticas são fortes devido ao aumento da ionização de grupos fenólicos e ocorrem poucas ligações hidrogênio formando estruturas mais abertas. Os resultados de espectroscopia de luorescência mostraram mudança na estrutura do AFA de rio tropical em pH alcalino em comparação com a estrutura em pH ácido, corroborando com os resultados obtidos pela AFM.
Studies of the morphological behavior of fulvic acids were carried out using the Atomic Force Microscopy technique together with zeta Potential techniques and luorescence spectroscopy. Results showed that the aquatic fulvic acid (AFA) of a Brazilian River changed its morphology when the AFA aqueous solution had its pH changed. In acid pH the morphology is granular forming 10-55 nm high agglomerates. In alkaline pH values were 2.5-4.0 nm, and the morphology forms non granular structures. These results suggest that for pH 3.0 electrostatic interactions are weak and hydrogen bonding is responsible for the aggregates formation; while at pH 9.0 electrostatic interactions are strong due to the increase in phenolic groups ionization and low hydrogen interaction forming open structures. Fluorescence spectroscopy results conirmed the AFM, that is, a change in the AFA in tropical river in alkaline pH compared to the structure in acid pH.
Keywords: humic substances, AFM, luorescence
Introduction
Presence of humic substances (HS) in a water supply is undesirable for several reasons, for instance: it produces esthetical problems as color in the water; stabilizes dispersed and colloidal particles during coagulation processes; leads to formation of biodegradable organic compounds during ozonation and thereby enhances regrowth of microorganisms within the water-distribution systems.1
Fulvic acids (FA) has been postulated to be one of the most important factors controlling the rates of mineral
dissolution in soils and sediments.2-5 Sorbed FA may
strongly inluence the physical and chemical properties of colloidal particles in natural waters, and as a consequence help to control the transport of organic and inorganic pollutants. In aquatic environments FA is the dominant type of HS.6
The study of humic substances structure is carried out through different spectroscopy techniques7-10 as well as
microscopies.11,12 Among these techniques, the luorescence
spectroscopy13,14 and the atomic force microscopy
(AFM)15-18 have been used to characterize and determine
the humic substances structure.
across the surface at forces smaller than the forces between atoms.15 AFM is a technique which has been employed to
study the morphologies of humic and fulvic acid.12,16-18 It
is a powerful tool to characterize small colloids, as well as colloid agglomeration, adsorption onto surfaces, or modiication in morphologies affected by changes in the physico-chemical properties.
Namjesnik-Dejanovic and Maurice12 getting AFM
images of FA river reported that four main structures were observed. At low concentrations, sponge-like structures consisting of rings (ca. 15 nm in diameter) appeared, along with small spheres (10-50 nm). At higher concentrations, aggregates of spheres formed branches and chain-like assemblies.
Chen and Schnitzer19 indicated that at very low pH
humic substances behave like uncharged polymers, whereas at higher pH they exhibit a polyelectrolytic character.
Fluorescence spectroscopy is a very promising, sensitive and useful technique for the study of environmental samples, like those containing humic substances. The potential utility of this technique for studying the structural and functional chemistry of humic materials is due to the presence of a variety of luorescent structures present, specially in fulvic acids, which include condensed aromatic moieties bearing various functional groups and unsaturated aliphatic chains.
Carvalho et al.,1 studying aquatic fulvic acids (AFA)
with spectroscopic luorescence showed that reduction of luorescence intensity of AFA samples after reaction with chlorine in the region of longer wavelength can be probably associated with selective interaction between aromatic structures of AFA and chlorine. This selective interaction probably contributes for the formation of the intermediates as trihalomethanes.
The objective of this work was to get AFM images of AFA Brazilian river, and used luorescence spectroscopy and zeta potential with pH change to verify the structural and morphologic change of the AFA.
Experimental
Water sample
The aquatic HS were isolated from a sample collected from a tributary stream of River Itapanhaú within of the State Park called Serra do Mar. This is an environmental protection area located in the seaboard, 7th UGRHI
(Unidades de Gerenciamento de Recursos Hídricos) of 11th
group of UGRHI from São Paulo State, Brazil
Pereira, a tributary river presents dark water with high content aquatic organic matter, making it easy to obtain and extract material for laboratory reaction with chlorine
and chlorine dioxide. This river receives treated sewage from the sewage treatment station (ETE) from the Riviera neighborhood in São Lourenço, about 4.5 km far from the Serra do Mar in São Paulo State, Brazil.
The geomorphologic situation in the region where João Pereira River is located enabled the development of different formation and vegetable association, mainly those belonging to the restinga (sand coastal plain vegetation) and mangroves, as well as the Atlantic typical rainforest and nearby. The characterization of the region vegetation is the coastal plains, covered by restinga and Atlantic forest, thus developing great variety of subtypes in the same area, due to hydrographic, topographic and microclimate heterogeneity in the region.
Fulvic acids extraction
All reagents used were high-purity grade, unless otherwise stated. Diluted acid and base solutions necessary for the aquatic HS isolation were prepared by convenient dilution of 30% (v/v) hydrochloric acid (suprapur, Merck AG) or sodium hydroxide monohydrate (suprapur Merck AG) dissolved in high-purity water (Milli-Q system, Millipore). The XAD 8 resin adsorbent (Serva Feinbiochemica), used for isolation of aquatic HS, was puriied before use by successive soaking with 0.5 mol L-1
HCl, 0.5 mol L-1 NaOH and methanol p.a. (24 h each).For
this purpose, 50 L of surface water were iltered through 0.45 μm cellulose-based membranes and acidiied with concentrated HCl solution to pH 2.0. Afterwards, the aquatic HS from the acidiied sample was isolated on the XAD 8 collector following the recommendations of Malcolm.20 After elution with 0.1 mol L-1 NaOH
solution, the obtained concentrate (4.5 mg mL-1 DOC
equivalent to 9.0 mg mL-1 aquatic HS) was acidiied to pH
2.0 with 6.0 mol L-1 HCl solution and the AFA (soluble
fraction) were separated of aquatic humic acid (AHA) by centrifugation at 12000 rpm (40 min).1
Elemental analysis
The elemental composition of the samples in relation to carbon, hydrogen and nitrogen content was determined in an elemental analyzer (EA 1108 from Fisons Instruments). The oxygen level was obtained through difference at 100%, discounting ash levels in the lyophilized samples. In order to determine ash content, 20 mg of each AFA sample was calcined for one hour at 800 °C in lask. The result
was obtained from the arithmetic average of replicated experiments.
AFM imaging
The imaging of AFA samples was carried out at two pH values 3.0 and 9.0. These were used to identify structural changes of FA when the pH varies. Suspensions of 100 mg L-1 of AFA were prepared by dissolving freeze-dried
AFA samples in demineralized water, then shaken for at least three days, while protected from light, before preparation for AFM analysis. Using HCl the pH was adjusted to 3.0 and by NaOH pH was adjusted to 9.0. Muscovite mica with a surface area about 1 cm2 was cleaved and introduced into
a beaker containing 10 mL of AFA solutions. Suspension of AFA appeared after one day under constant shaking; the mica was allowed to be washed with demineralized water and to air dry in an enclosed Petri dish in a dissecator for at least 12 h before the AFM images obtaintion.
Images were obtained using the AFM microscope Didimension V, Veeco. Tapping mode was used and Silicon SPM - Sensor with spring constant 42 N m-1, resonant
frequency 285 kHz. Samples were analyzed at 21oC
and a relative humidity of 35-45%. For each image, the topography, phase and amplitude were recorded. Surface scans of AFM were analyzed using Gwyddion free SPM data analysis software21 based on MS-Windows.
Fluorescence spectroscopy
AFA solutions were prepared in 8 mg L-1 NaHCO
3 and
pH values varying from 5 to 11. Emission spectra were recorded over the range 330-600 nm, with ixed excitation wavelength of 320 nm.
Zeta potential
For the study of zeta potential in function versus the pH, AFA samples in a suspension of 100 mg per 1 L of distilled water milliQ were used. The suspension was sonicated for 30 min in a 60W bath ultrasound in 20 mL parts; pH was adjusted with the addition of 0.1 mol L-1 HCl or 0.1 mol L-1 NaOH at 20 oC
and after 24 h the pH was readjusted. The equipment used was Malvern Instruments, Zeta sizer nano ZS model Zen 3600.
Results and Discussion
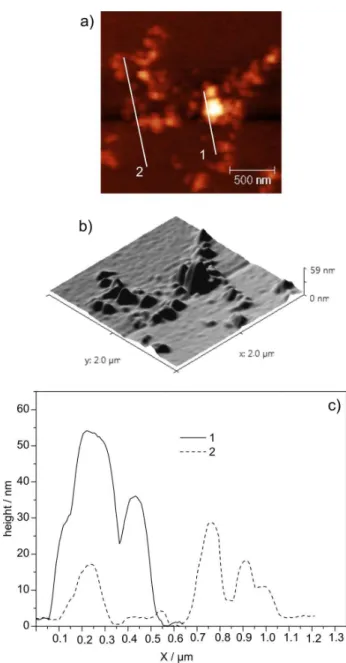
Figure 1 shows de AFA AFM images at pH 3.0. In Figure 1a the image can be seen in 2D, in Figure 1b, the
image in 3D and in Figure 1c the height and diameter of AFA particles on the mica sheet measured from the two straight lines indicated in Figure 1a. Agglomerates in the shape of pyramids, with diameter around 150-300 nm and 10-55 nm high were observed.
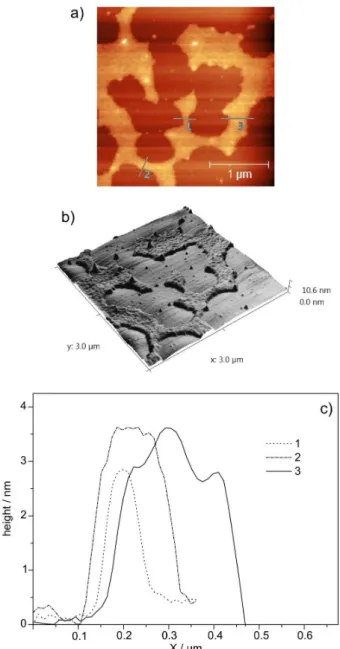
Figure 2 shows the AFA AFM images at pH 9.0. Figure 2a image indicates a more open distribution of AFA on the mica sheet when compared with Figure 1a image at pH 3.0. Figure 2b shows the image in 3D conirming Table 1. Percentual values of elemental composition and ash content in %, obtained for the AFA sample
Samples Ashes / (%) N / (%) C / (%) H / (%) 0 / (%)
AFA 10.95 1.39 ± 0.02 47.56 ± 0.01 4.03 ± 0.01 46.30
the open image of AFA at pH 9.0. Dimensions can be observed in Figure 2c where the AFA height on the mica at pH 9.0 was between 2.5-4.0 nm and diameter between 100-300 nm. With pH increase, AFA particles expand and repel one another electrostratically. Strengths become weaker, due to H bonding, van der Waals interactions and interactions of π electrons from adjacent molecules, with
dissociation of carboxylic and phenolic groups, generating negative charges22 as shown in Figure 3 (zeta potential).
Figure 3 shows the zeta potential variation with the pH of the river AFA sample. Zeta potential becomes more negative with the increase of the pH. There is a sharp increase in the negative charge from pH 7.0. This fact matches with the beginning of phenolic acid groups
ionization, with a gradual increase concentration of these groups from pH 7.0. Thus, the contribution of phenolic acids for the formation of AFA negative charges in solution is more important than the carboxylic groups.
Balnois et al.,23 using AFM images, reported that no
aggregates were observed for the relatively hydrophilic Suwannee River humic acid between pH 3.0 and pH 10.0. A different result in this work using a tropical river FA, was that aggregates were identiied at pH 3.0, and open structure at pH 9.0.
In Figures 4 and 5, are seen some of the results by luorescence spectroscopy. Figure 4 illustrates the emission mode luorescence spectra obtained for the fulvic acid samples, at different pH values.
Figure 5 shows the contribution of at least four different fluorophore responsible for the AFA fluorescence at different pH values.
Determining parameters such as height, width, area and Gaussian position regarding the possible luorophore present in the AFA, were obtained (Table 2). Increase in the Gaussian area is observed with the decrease in pH.
Figure 2. AFA AFM image at pH 9.0 in: a) 2D; b) 3D and c) height in function of images scanning, represented in the segments 1, 2 and 3 from Figure 2a.
Figure 3. Zeta potential variation with the AFA sample pH.
Figure 4. Emission mode luorescence spectra, with 320 nm excitation, obtained for the AFA sample, at different pH values; 8 mg L-1 NaHCO
Figure 5. Fluorescence spectra obtained for the AFA sample, with 320 nm excitation, at different pH values. Adjustment of the Gaussian function shows the possible participation of at least four compounds in the band formation.
Table 2. Parameters determined for the Gaussians referring to possible luorophore present in AFA, at different pH values, obtained from the emission mode spectra, with one data in wavenumber
Gaussians Sample AFA
Height Width Area Position
pH 5
1 88.540 2.97 ± 0.04 329.68 ± 13.58 20.40 ± 0.06
2 53.435 1.27 ± 0.06 185.15 ± 17.32 21.14 ± 0.06
3 82.081 1.40 ± 0.07 144.36 ± 2.07 22.29 ± 0.05
4 128.48 2.20 ± 0.03 366.82 ± 14.00 23.59 ± 0.04
pH 7
1 84.07 2.94 ± 0.04 309.98 ± 14.04 20.36 ± 0.06
2 63.90 1.36 ± 0.07 128.97 ± 18.09 21.26 ± 0.06
3 64.53 1.26 ± 0.05 102.22 ± 17.45 22.37 ± 0.05
4 130.00 2.24 ± 0.02 366.04 ± 11.10 23.55 ± 0.03
pH 9
1 70.21 2.89 ± 0.05 255.17 ± 2.73 20.20 ± 0.07
2 68.20 1.47 ± 0.08 126.48 ± 18.73 21.33 ± 0.06
3 55.64 1.24 ± 0.05 86.65 ± 16.73 22.44 ± 0.04
4 128.60 2.26 ± 0.02 355.24 ± 10.27 23.53 ± 0.03
pH 11
1 58.47 2.89 ± 0.06 212.49 ± 13.05 20.18 ± 0.09
2 65.85 1.53 ± 0.08 126.19 ± 20.26 21.37 ± 0.06
3 49.53 1.24 ± 0.05 77.45 ±17.07 22.47 ± 0.04
Thus, the increase in area with the decrease in pH suggests that protonation might contribute with effects and changes in the AFA molecular conformation. Multiple protonations of replacing fluorophore with aromatic structures, present in the fulvic acid, might increase total luorescence induced by the protonation of acid functional groups at lower pH.24 This hypothesis is conirmed by
Figure 3 in which a decrease in negative charges (near zero) at acid pH in the AFA solution is observed.
Senesi et al.,13 observed decrease in the luorescence
intensity in HS with the increase in pH at values higher than 6. Ghosh and Schnitzer,25 atributed these effects to
the changes in macromolecular conformation, however, the authors also suggest that the decrease in luorescence intensity is due to some change in λ
max, and decrease in
absorptivity, due to the phenolic chromophoric substituted-carboxyl, caused by alterations in pH. This result conirms the AFM images (Figures 1 and 2) where changes in the AFA morphology were observed when the pH varied from 3.0 to 9.0.
According to Visser et al.,26 and Miano et al.,27 with pH
increase from 3.0 to 8.4 or 4.0 to 9.0, for a 100 or 50 mg L-1
solutions, respectively, the emission band intensity decreases, meaning that the excitation peak increases signiicantly for the aqueous fulvic acid samples. In contrast with these experiments, the increase in the emission intensity, has been reported in literature,27 with the increase
in turbid water. In fulvic acids in peat, for example, at a 50 mg L-1 concentration, the main peak intensity increases
with the increase in pH from 4.0 to 9.4, while the emission intensity showed a maximum at pH 7.0 with reasonable decrease with the decrease in pH lower than 7.0 and a mild slope above pH(s) 7.0 and 9.4.27
In general, it has been considered that increase in the luorescence intensity with the pH variation, might present great dependence on the high phenolic hydroxyl groups content. With increase of these ionized groups and decrease in associated particles and molecular structures, hydrogen inter and intramolecular bonding25,26 might break.
The increase of OH phenolic groups, in the fulvic acid samples, results in a increase in main peak excitation intensity. The opposite effect, that is, attenuation in the emission intensity might happen.26
Humic substances luorescence is very sensitive to the
pH.25,27-29 As the luorescence depends on the molecule
conjugation degree and occurrence of intramolecular hydrogen, bonding might increase or decrease the neighboring groups conjugation. Then the luorescence intensity might vary with the occurrence of this kind of bonding, according to the variation in electrolytes concentration and the pH.25
The difference and contrast of results in literature,25
however, are not surprising if one considers the variety of functional groups in constant ionization in fulvic acids and the rearrangement in the molecular coniguration that happens when there is pH variation. However, the dificulty to stabilish the aromatic compounds in the various stages of ionization and to predict the luorescence relation with the sample pH, related to compounds of unknown structure, has been emphasized.
pH dependence regarding luorescence properties varies with the fulvic acid samples chemical nature. According to Visser et al.,26 luorescent units are only the minority of
humic substances and the investigation of such minority might lead indirectly to valuable information about molecular characteristics and quantitative aspects of the general chemistry of these substances. However, the luorescence properties of fulvic and humic acids, are apparently dependent on the number of parameters, including their origin, molecular mass, concentration, pH, the means redox potential as well as their interaction with metallic ions.
Conclusions
This work showed that through atomic force microscopy techniques and luorescence spectroscopy, structural change in fulvic acid of a Brazilian river was identiied when the solution pH varied. Results suggest that in acid pH weak electrostatic interactions and hydrogen bonding are responsible for aggregates formation while in alkaline pH electrostatic interactions are strong due to increase in the phenolic groups ionization and low hydrogen interaction forming more open structures.
Aknowledgments
We are grateful to Finep and CNPq for inancial support and Embrapa Instrumentação Agropecuária for use of AFM and Potencial Zeta facilities.
References
1. Carvalho, E. R.; Martin-Neto, L.; Milori, D. M. B. P.; Rocha, J. C.; Rosa, A. H.; J. Braz. Chem. Soc.2004, 15, 421. 2. Maurice-Johnsson, P. A.; Parks, G. A.; Sposito, G.; Aiken, G.
R.; Proceedings of 207th National Meeting, ACS Division of Environmental Chemistry, San Diego, USA, 1994.
3. Lindsay, W. L.; Plant Soil1991, 130, 27.
4. Ochs, M.; Brunner, L.; Stumm, W.; Cosovic, B.; Water, Air, Soil Pollut. 1993, 68, 213.
6. Tan, K. H.; Humic Matter in Soil and Environment, Principles and Controversies, Marcel Dekker, Inc.: New York, 2003, p. 386.
7. Saab, S. C.; Martin-Neto, L.; J. Braz. Chem. Soc. 2004, 15, 34. 8. Saab, S. C.; Martin-Neto, L.; Quim. Nova2007, 30, 260. 9. Saab, S. C.; Martin-Neto, L.; J. Braz. Chem. Soc.2008, 19, 413. 10. Favoretto, C. M.; Milori, D. M. B. P.; Rosa, J. A.; Leite, W. C.;
Brinatti, A. M.; Saab, S. C.; Quim. Nova 2008,31, 1994. 11. Chen, C.; Wang, X.; Jiang, H.; Hu, W.; Colloids Surf., A2007,
302, 121.
12. Namjesnik-Dejanovic, K.; Maurice, P. A.; Colloids Surf., A
1997,120, 77.
13. Senesi, N.; Miano,T. M.; Provenzano, M. R.; Brunetti, G.; Soil Sci.1991, 152, 259.
14. Milori, D. M. B. P; Martin-Neto, L.; Bayer, C.; Mielniczuk, J.; Bagnato, V. S.; Soil Sci. 2002, 167, 739.
15. Leite, F. L.; Herrmann, P. S. P.; J. Adhes. Sci. Technol.2005,
19, 365.
16. Plaschke, M.; Rothe, J.; Schäfer, T.; Denecke, M. A.; Dardenne, K. S.; Pompe, K. Heise, H.; Colloids Surf., A 2002, 197, 245.
17. Gorham, J. M.; Wnuk, J. D.; Shin, M.; Fairbrother, H.; Environ. Sci. Technol.2007, 41, 1238.
18. Mertig, M.; Klemm, D.; Pompe, W.; Zanker, H.; Bottger, M.;
Surf. Interface Anal.1999, 27, 426.
19. Chen, Y.; Schnitzer, M.; Soil Sci. Soc. Am. J.1976, 40, 682.
20. Malcolm, R. L. In Humic Substances in the Aquatic and Terrestrial Environment; Allard, B.; Boren H.; Grimvall, A., eds.; Springer-Verlag: Berlim, 1989, p. 9.
21. http://gwyddion.net/, accessed in July 2008.
22. Alvarez-Puebla, R. A.; Garrido, J. J.; Chemosphere2005, 59, 659.
23. Balnois, E.; Wilkinson, K. J.; Lead, J. R.; Bufle, J.; Environ. Sci. Technol. 1999, 33, 3911.
24. Saar, R. A. ; Weber, H. J.; Environ. Sci. Technol.1982, 16, 510A. 25. Ghosh, K.; Schnitzer, M.; Soil. Sci. Soc. Am. J. 1980, 44, 975. 26. Visser, S. A.; Christman, R. F.; Gjessing, E. T.; Aquatic and Terrestrial Humic Materials, Ann Arbor Science:Ann Arbor, 1983.
27. Miano, T. M.; Sposito, G.; Martin, J. P.; Soil Sci. Soc. Am. J.
1988, 52, 1016.
28. Stevenson, F. J.; Humic Substances in the Global Environment and Implications on Human Health, Elsevier Scientific: Amsterdam, 1994.
29. Zsolnay, A.; Baigar, E.; Jiménez; M.; Steinweg, B.; Saccomandi, F.;
Chemosphere1999, 38, 45.
Received: October 8, 2009
Web Release Date: April 12, 2010