Article
J. Braz. Chem. Soc., Vol. 25, No. 5, 841-852, 2014. Printed in Brazil - ©2014 Sociedade Brasileira de Química 0103 - 5053 $6.00+0.00
A
*e-mail: [email protected]
Ehrlich and Sarcoma 180 Tumour Characterisation and Early Detection by
1
H NMR-Based Metabonomics of Mice Serum
Caroline W. P. da S. Grandizoli,a Luise Z. B. Carrenho,b Thais M. G. de Francisco,b
Arquimedes P. de Santana Filho,c Guilherme L. Sassaki,c Fabio Simonelli,a
Noemi Nagata,a Maria R. O. Kreuger,d Francinete R. Camposb and Andersson Barison*,a
aNMR Center, Department of Chemistry, Paraná Federal University (UFPR), 81530-110 Curitiba-PR, Brazil
bDepartment of Pharmacy, Paraná Federal University (UFPR), 80210-170 Curitiba-PR, Brazil
cNMR Center, Department of Biochemistry, Paraná Federal University (UFPR), 81530-110 Curitiba-PR, Brazil
dHealth Science Center, Itajaí Valley University (UNIVALI), 88302-202 Itajai-SC, Brazil
O sucesso no tratamento do câncer está intrinsicamente relacionado à sua prévia detecção, até mesmo antes dos sintomas surgirem. Neste contexto, estratégias metabonômicas baseadas na espectroscopia de ressonância magnética nuclear de 1H (1H NMR) foram empregadas
para identificar as alterações metabólicas ocorridas na composição química de biofluidos de camundongos como consequência do surgimento de tumores. Através da análise discriminante por mínimos quadrados parciais (PLS-DA) dos espectros de 1H NMR foi possível diagnosticar a
presença dos tumores de Ehrlich e Sarcoma 180 após cinco e dez dias da indução dos tumores, respectivamente. Lipídeos, lipoproteínas e lactato foram os biomarcadores mais importantes indicativos do processo carcinogênico. Portanto, estratégias metabonômicas baseadas na espectroscopia de NMR podem ser valiosas ferramentas para investigar os efeitos do surgimento de anomalias celulares na composição química dos biofluidos.
The success of cancer treatment is directly related to early detection before symptoms emerge, although nowadays few cancers can be detected early. In this sense, 1H nuclear magnetic
resonance (1H NMR)-based metabonomics was used to identify metabolic changes in biofluid as
a consequence of tumours growing in mice. Through partial least squares discriminant analysis (PLS-DA) analysis of 1H NMR spectra from serum samples it was possible to diagnose Ehrlich
ascites and Sarcoma 180 tumours five and ten days after cell inoculation, respectively. Lipids, lipoproteins and lactate were the main biomarkers at onset as well as in the progress of carcinogenic process. Thus, NMR-based metabonomics can be a valuable tool to study the effects of tumour establishment on the chemical composition of biofluids.
Keywords: cancer, biomarker, NMR, metabonomics, chemometrics
Introduction
Cancer is one of the main causes of death throughout the world. This fact is primarily due to difficulties related to early diagnosis,1 since the success of treatment depends
on how early the cancer is diagnosed. Thus its detection in initial stages is an important issue.1 Many efforts have
been targeted on the development of more accurate and sensitive diagnostic methods. Though many advances in
diagnostic methods have been achieved in recent years, several obstacles remain, and there are still many limitations associated with the approaches used in this field. For example, conventional diagnostic strategies have improved early cancer detection, although frequently yield either poorly sensitive or nonspecific results.1 As a consequence,
in many cases cancer is neither diagnosed nor treated until tumour cells have already metastasised throughout the body and invaded surrounding tissues.2 Thus, there is need
In this sense, nuclear magnetic resonance (NMR)-based metabonomics approaches can be used to discriminate samples from a different biological state or origin.2 The
approach advantage is that minimal sample treatments are required prior to analysis. Thus, requiring only simple collection of urine, blood or saliva samples from patients. This rapid, non-invasive and non-destructive technique allows for additional experiments to be performed in order to unequivocally identify compounds.3-6 Therefore, the
identification of biomarkers in biofluids for diagnosing disease in its early stages is the end goal of NMR-based metabonomics strategies. NMR-based metabonomics has been successfully used to discover biomarkers associated with several diseases, including cancer.7-14
In this work, the onset and progress of Ehrlich and Sarcoma 180 tumours in mice were evaluated through the metabolic changes in blood as consequence of tumour state, by means of 1H NMR spectroscopy and chemometric
analysis.
Experimental
Animals, tumour induction and serum sample collection
Male and female Swiss and isogenic Balb-C mice at seven to ten weeks age were provided by the central vivarium from Itajaí Valley University. The animals were housed under controlled temperature (22-24 °C), humidity (45-65%) and light (12 hours light/12 hours dark, lights on at 6:00 a.m.) and received food and water ad libitum. Ehrlich and Sarcoma 180 tumour cells, from immortal cultures, provided by the Faculty of Veterinary Medicine and Zootechnics, University of São Paulo, were maintained in their ascitic form by sequential passages in Swiss mice, by means of weekly intraperitoneal (i.p.) transplantations of 106 tumour cells. For tumour induction, 100 and 50 µL
of tumour cell suspensions (2 × 10⁷ cells mL-1) were i.p.
inoculated in Swiss (n = 146) and Balb-C mice (n = 81), respectively. Matched control groups were formed by mice from both species without tumour cell inoculation, whereas they received a similar i.p. injection of 0.9% saline. After 3, 5, 7 and 10 days tumour induction, 0.5 mL aliquots of blood were collected by bleeding the retro-orbital plexus. Prior to blood collection, the animals were sedated with ether. The collected blood samples were immediately centrifuged for 6 min at 12,000 rpm at room temperature, and the serum was transferred to plastic tubes and freeze-stored at –40 °C until NMR analysis. After blood collection, the animals were humanely sacrificed by cervical dislocation.
International protocols governing the ethical treatment of animals were followed, as well as they were
approved by both Ethics Committees of Paraná Federal University and Itajaí Valley University (Permit Number AN.019.002.09.05).
NMR analyses
Aliquots ranging from 20-100 µL of serum samples were diluted to 600 µL in D2O containing sodium
3-trimethylsilylpropionate-d4 (TMSP-d4, 1.0 mmol L-1)
and centrifuged for ten minutes at 6,000 rpm on a microcentrifuge. Thus, 500 µL supernatant were directly transferred into 5 mm NMR tubes and submitted for NMR analysis.
1H NMR spectra and 1H–1H correlation experiments
were acquired on a Bruker AVANCE 400 NMR spectrometer operating at 9.4 T, observing 1H nuclei at 400.13 MHz,
equipped with a 5-mm multinuclear direct detection probe with z-gradient. The 1H NMR spectra were recorded
at 298 K using the Bruker noesypr1D pulse sequence: RD - 90° - t1 - 90° - tm - FID. RD represents the recycle delay of 2.0 s in which water resonance frequency was selectively irradiated, t1 the fixed interval of 4 µs, tm the mixing time of 100 µs in which the water resonance was also irradiated and FID is the free induction decay. For each sample, 128 scans were collected with 64 k data points distributed on a spectral width of 4194.6 Hz (~10.5 ppm), providing a digital resolution of 0.06 Hz and the receiver gain was automatically adjusted. The 1H NMR spectra
were processed by applying an exponential multiplication of the FIDs by a factor of 0.3 Hz prior to Fourier transform without zero-filling. The 1H NMR chemical shifts are
given in ppm related to TMSP-d4 signal at 0.00 ppm as internal reference. Only the 1H NMR spectra that showed
a TMSP-d4 signal less than 1.0 Hz at the half-height were selected for chemometric analyses. The 1H–1H double
quantum filter-homonuclear correlation spectroscopy (DQF-COSY) experiments were acquired using Bruker
cosygpmfgf pulse sequence, with 4 k data points and 128 transients in t2 for every 400 increments in t1. RD was 1.5 s and the experiments were processed by Fourier transform using square sine apodisation in both dimensions and zero-filled to 4 k × 2 k data points in f2 and f1, respectively.
One-bond (1J
H,C) and long range (LRJH,C) 1H–13C NMR
correlation experiments were performed on a Bruker AVANCE III 400 NMR spectrometer operating at 9.4 T, observing 1H and 13C nuclei at 400.13 and 100.61 MHz,
respectively, equipped with a 5-mm multinuclear inverse detection probe with z-gradient. One-bond 1H–13C correlation
1J
(H,C) of 145 Hz. The 1J(H,C) experiments resulted in 4 k data
points and 32 transients in t2 for every 312 increments in
t1. The long-range 1H–13C correlation experiments were
recorded using the gradient heteronuclear multiple bond correlation (HMBC) Bruker hmbcgplpndqf pulse sequence with an evolution delay setting at 62.5 ms, optimised for
LRJ
(H,C) coupling constants of 8 Hz. The LRJ(H,C) experiments
resulted in 4 k data points and 64 transients in t2 for every 312 increments in t1. Recycle delays were set to 1.0 s and the experiments were processed by Fourier transform using square sine apodisation on both dimensions and zero-filled to 4 k × 2 k data points in f2 and f1, respectively.
NMR data reduction
The 1H NMR spectra (δ 4.5-0.4) were automatically
data-reduced to 410 integral segments (buckets) of equal length (δ 0.01) using AMIX 3.9.14 (Analysis of Mixtures
software package, version 3.8.3, Bruker Biospin).15 Each
segment consisted of the integral of the NMR region with which it was associated. The segment areas were then normalised to the total spectral area and scaled to the signal’s total intensity in order to eliminate variability in sample concentrations. The segments were then used as the input variable in chemometric analysis.
Chemometric analysis
Principal component analysis (PCA), a well-known unsupervised multivariate exploratory data analysis technique was the first method employed for overviewing ‘clusters’ within multivariate data.15,16 In order to obtain
clear loading plots, buckets with variances smaller than 12% were excluded from PCA. The integration mode used was the sum of absolute intensities. In the sequence, partialleast squares discriminant analysis (PLS-DA), a classification tool based on the PLS model in which the dependent variable is chosen to represent the class membership, was used.17 Once
a PLS-DA model is calculated and validated, it can be used to predict membership class for unknown samples.15
Statistical significance analysis of NMR data
Statistical significance analysis was performed in order to compare samples from tumour-induced and matched control as well as Ehrlich and Sarcoma 180 tumour samples, with the aid of AMIX 3.9.14 (Bruker Biospin), as outlined by Goodpaster and Kennedy.18 A change in bucket
intensity between groups was determined to be statistically significant if its p value was less than the Bonferroni corrected critical value.
Gas chromatography (GC) analysis
Serum samples were submitted to gas chromatography-mass spectrometry (GC-MS) analysis on a Varian SATURN 2000R instrument, equipped with an Agilent DB-225MS (J&W) capillary column (50% cyanopropylphenyl and 50% methylpolysiloxane, 30 m × 0.25 mm i.d.; 0.25 µm film thickness). The mass detection was performed through an electronic impact at 70 eV and 200 °C on an ion trap analyser. The GC conditions were as follows: injector temperature: 250 °C; column temperature: 50 to 220 °C at a rate of 40 °C min-1; carrier gas: helium at the flow
rate of 1.0 mL min-1; trap temperature: 210 °C. For this,
initially, the water was removed from samples by vacuum evaporation followed by a methanolysis reaction using 200 µL of serum and 1.0 mL of methanolic HCl (prepared by the addition of 400 µL of acetyl chloride in 4.6 mL of anhydrous methanol). The reaction was performed at 100 °C for 4 h. After methanol and HCl were removed under N2 gas at room temperature, acetylation was performed
using 1:1 acetic anhydride/pyridine for 30 min at 100 °C.19
Sugar standards, including galactose, mannose, fructose, glucose, ribose and arabinose, were used for identification and prepared as described above.19
Compound identification was performed by data obtained from retention time and mass fragmentation spectra obtained from authentic standards as well as from mass spectra library NIST v. 2.0 (National Institute of Standards and Technology/Varian Inc.).
Results
In order to evaluate the possibility of detecting tumour in early stages by means of 1H NMR spectra from blood
serum, Swiss and isogenic Balb-C mice were inoculated with either Ehrlich or Sarcoma 180 tumour cells in their ascitic forms. After tumour induction time, blood serum was collected and submitted for NMR analysis.
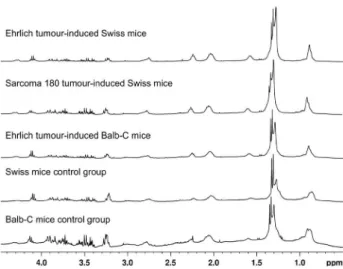
The initial visual inspection of 1H NMR spectra from
mice serum showed only few differences between diseased and matched control groups, thus failing to detect specific biomarkers indicating the presence of tumours in mice (Figure 1). Therefore, PCA and PLS-DA were performed to distinguish between diseased and matched control groups based on the fingerprint generated by 1H NMR
spectra of blood serum. The main advantage of PCA and PLS is the extreme sensitivity of these methods to subtle spectral differences. The signals in 1H NMR spectra
COSY, HSQC and HMBC NMR correlation experiments, as well as by comparing the acquired NMR data with those reported in the literature20,21 (Figure 2).
The 1H NMR spectra complexity were initially
data-reduced from 64 k data points, to buckets ranging from 0.001 to 0.5 ppm, with the aid of Bruker AMIX software package. Buckets that were too wide presented low discrimination between diseased and matched control groups, possibly due to the fact that a single bucket may cover more than one real signal and reduce the information content.15,22 However, buckets narrower than 0.005 ppm
resulted in similar discrimination as those obtained using buckets of 0.01 ppm. This demonstrates that there is no extra information when the spectral resolution is higher than the physical signal resolution of the compounds generating the spectra.21 Thus, better discrimination were
achieved with buckets of 0.01 ppm without including too
many variables to describe the same signal, while providing implicit smoothing of the spectrum.
The region of the spectrum used in the chemometric analysis was also evaluated. First, the whole spectrum was included, although excluding the region δ 5.20-4.50 from residual HDO signal. However, loading plots, from those analyses, revealed that only the region δ 4.50-0.40 has influenced all discriminations and therefore was chosen for further chemometric analysis.
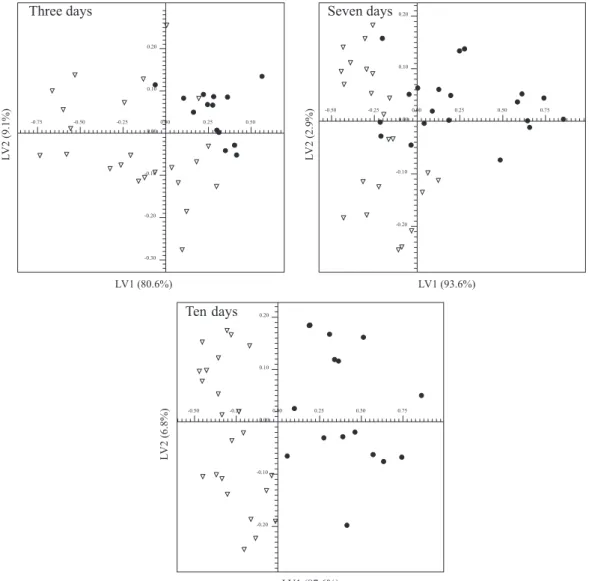
Chemometric analyses were performed including samples collected in several time intervals after tumour-inoculated in mice and matched control groups. In the early stages, a partial discrimination was observed by PLS-DA of the 1H NMR spectra of blood serum samples
from three days post-induction Ehrlich tumour-induced Swiss mice group and those of the control (Figure 3). However, considering samples from longer periods it was possible to discriminate samples between two distinct sets (Figure 3).
The signals (i.e., the buckets) from the 1H NMR spectra
that were statistically significant for the discrimination are presented in the heat map color-coding X-loading plots according to bucket p-value (see Supplementary Information). For example, the analyses consisting of three days tumour-inoculated samples and those of the control, the Bonferroni corrected α-value was 8.47 × 10⁻⁴. Buckets with
p-values higher than the Bonferroni corrected α-value are presented in black and were not considered as significant. In turn, buckets with p-values lower than the Bonferroni corrected α-value, are color-coded according to p-value as follows: 6.36 × 10⁻⁴-8.47 × 10⁻⁴ (blue), 4.24 × 10⁻⁴-6.36 × 10⁻⁴
(green), 2.13 × 10⁻⁴-4.24 × 10⁻⁴ (yellow), 0.00-2.13 × 10⁻⁴
(red). Thus, the significant buckets in discriminate samples were those at δ 0.90 (p-value = 3.53 × 10⁻⁴), 0.91
(p-value = 2.35 × 10⁻⁵), 0.92 (p-value = 3.19 × 10⁻⁴), 0.93
(p-value = 1.17 × 10⁻⁵), 1.30 (p-value = 1.68 × 10⁻⁵), 1.31
(p-value = 1.13 × 10⁻⁵), 1.32 (p-value = 1.99 × 10⁻⁵), 1.33
(p-value = 2.12 × 10⁻⁴), 1.34 (p-value = 8.99 × 10⁻⁷), 1.36
(p-value = 7.72 × 10⁻⁴), 1.37 (p-value = 3.19 × 10⁻⁴), 1.38
(p-value = 1.33 × 10⁻⁴), 2.04 (p-value = 7.41 × 10⁻⁶), 2.05
(p-value = 1.12 × 10⁻⁴) and 2.06 (p-value = 3.42 × 10⁻⁴). The
signals at δ 0.90-0.93 were assigned to methyl groups from
lipids and lipoproteins, while those at δ 1.30-1.33 correspond to methylene groups from lipids and lipoproteins, those at δ
1.34-1.38 to the methyl group doublet from lactate and the signals at δ 2.04-2.06 to α-olefin methylene groups from
lipids. All these signals were more intense in the control group, as can be concluded by comparison of scores with the X-loading plot.
In longer periods, the discriminations were more evident and additional signals were statistically significant. In
Figure 1. Representative 1H NMR spectra from evaluated diseased and
matched control groups.
Figure 2. Chemical composition assignments in a 1H NMR spectrum of
chemometric analysis of the five days tumour-inoculated and matched control groups (Figure 3), Bonferroni corrected α-value was 1.14 × 10⁻³, revealing that significant
buckets at δ 0.87-0.90, 1.17-1.21, 1.26-1.29, 1.33, 3.23,
3.57, 3.59, 4.11 and 4.13 from lipids and lipoproteins, lactate, choline and its derivatives were found in higher intensities in samples from diseased group. The buckets at δ 3.26, 3.28, 3.44, 3.48, 3.51 and 3.73 attributed to
glucose were significant and in higher intensities in control samples. For the seven days and control samples (Figure 3), discrimination was achieved with Bonferroni corrected α-value of 9.61 × 10⁻⁴. The statistically significant
buckets were all at higher intensities in the diseased group samples, and included those at δ 0.85, 0.86, 0.88-0.91,
0.93, 1.24, 1.27-1.34, 1.37, 1.38, 1.57-1.60, 2.02-2.07, 2.23, 2.25-2.27, 2.76, 2.77, 3.24-3.26, 3.48, 3.50, 3.90 and 4.13-4.15. Similarly to previous analyses, the signals
were correspondent to lipids and lipoproteins, glucose and lactate. Finally, chemometric analysis considering samples from ten days post-induction tumour-inoculated and matched control groups (Figure 3), showed a Bonferroni corrected α-value of 8.33 × 10⁻⁴. The buckets at δ 0.85-0.93,
0.99, 1.01, 1.22-1.32, 1.37, 1.38, 1.57-1.60, 2.02-2.07, 2.23-2.27, 2.76, 3.24-3.28, 3.48, 3.50, 3.72, 3.73, 3.90, 3.93 and 4.13-4.15 were statistically significant, corresponding to the same metabolites. However, the signals at δ 0.99 and 1.01, from methyl groups of aminoacids, such as valine, were now also significant.
As the X-loading plots indicated changes in buckets (i.e., in signals) from lipids and saccharides in the
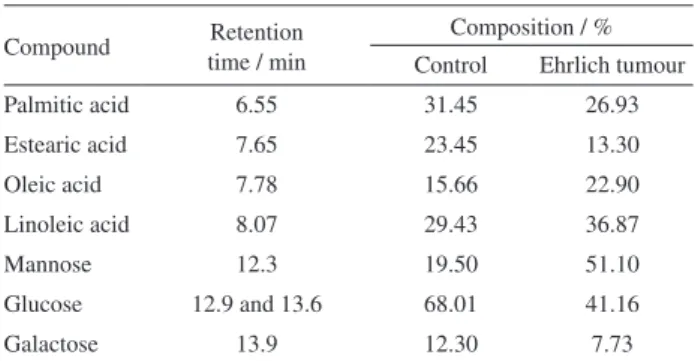
1H NMR spectra, GC-MS analyses were performed in
order to confirm the assignments as well as to add more information about the saturated fatty acid and sugar content (Table 1).
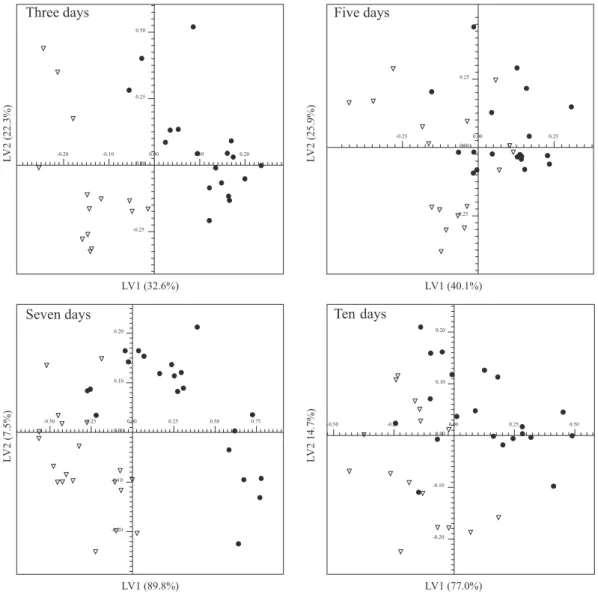
To evaluate the influence of genetic diversity, the same investigation was performed, although replacing Swiss with isogenic Balb-C mice. In general, chemometric analysis revealed lower discriminations for Ehrlich
tumour-inoculated Balb-C mice than the one observed for Swiss mice (Figure 4). A partial discrimination was achieved by PLS-DA of the 1H NMR spectra of blood
serum samples from five days tumour-inoculated mice (Figure 4). A clear discrimination was obtained for the seven and ten days tumour-inoculated and matched control groups (Figure 4). The X-loading plots (see Supplementary Information), after statistical significance analysis, revealed that nearly the same buckets were important, including those from lipids and lipoproteins (δ 0.90, 1.28-1.33,
2.05, 2.24, 2.26), lactate (δ 4.11-4.16) and choline and its derivatives (δ 3.23). Apart from these, other signals were
also significant for discrimination such as those at δ 1.20 and 1.22 in five days post-inoculation analysis, probably due to 3-hydroxybutyrate, and those at δ 0.88-0.92, 1.17, 1.19, 1.21, 1.26-1.38, 1.58-1.60, 2.02-2.07, 2.23-2.27, 2.57, 3.25, 3.43, 3.47, 3.50, 3.68, 3,72, 3.84, 3.89, 3.90,
Table 1. Chemical composition of blood serum samples of of Ehrlich tumour-inoculated Swiss mice by GC-MS
Compound Retention time / min
Composition / % Control Ehrlich tumour
Palmitic acid 6.55 31.45 26.93
Estearic acid 7.65 23.45 13.30
Oleic acid 7.78 15.66 22.90
Linoleic acid 8.07 29.43 36.87
Mannose 12.3 19.50 51.10
Glucose 12.9 and 13.6 68.01 41.16
Galactose 13.9 12.30 7.73
3.92-3.93 and 4.13 in seven and ten days post-inoculation analyses, corresponding to lipids and lipoproteins, glucose, 3-hydroxybutyrate and lactate. Bonferroni corrected
α-values of 1.02 × 10⁻³, 8.33 × 10⁻⁴, 1.11 × 10⁻³ and
1.06 × 10⁻³ were found for analyses considering samples
three, five, seven and ten days post-induction, respectively. Survival assays have showed that Swiss and Balb-C mice can survive 18.3 ± 2.9 and 21.0 ± 2.65 days after Ehrlich tumour cell inoculation, respectively.
Swiss mice were also inoculated with Sarcoma 180 tumour cells and incubated for the same time in order to evaluate the influence of another tumour on the chemical composition of blood serum as well as the performance of the methodology in tumour detection. As the experiment performed on Ehrlich tumour-inoculated isogenic Balb-C mice did not reveal any genetic influence, the experiment with Sarcoma 180 tumour-inoculated isogenic Balb-C mice was not performed. PLS-DA score plot of LV1 vs. LV2
from the 1H NMR spectra showed overlaps for samples
of three and seven days post-induction (Figure 5), while it was possible to discriminate those ten days after tumour induction. X-loading plots (see Supplementary Information) revealed that signals associated with lipids and lipoproteins were statistically significant in three days samples and were present in higher contents in the control group. For samples seven and ten days after tumour inoculation, significant analysis indicated once again the signals from lipids and lipoproteins, glucose and lactate as significant. The Bonferroni corrected α-value was 1.04 × 10⁻³, 1.02 × 10⁻³
and 9.26 × 10⁻⁴, for chemometric analyses considering three,
seven and ten days post-induction samples, respectively. Chemometric analysis was performed with samples from mice inoculated with both kinds of tumour for the same incubation time in order to verify if the methodology is able to distinguish between samples according to tumour (i.e., the specificity of the methodology). The
chemometric analyses of the 1H NMR spectra showed
a clear discrimination between three days’ inoculation with Ehrlich and Sarcoma 180 tumour cells, and a partial discrimination in longer times (Figure 6). The X-loading plot (see Supplementary Information), after significant analysis, also indicated the signals from lipids and lipoproteins, glucose and lactate as significant. Bonferroni corrected α-values were 6.41 × 10⁻⁴, 6.58 × 10⁻⁴, 9.26 × 10⁻⁴
and 8.77 × 10⁻⁴, for analyses considering three, five, seven
and ten days post-inoculation, respectively.
In order to predict the presence of a tumour by means of 1H NMR-based metabonomics of blood serum samples
and chemometric analysis, around 80% of samples used in chemometric analysis were randomly selected (the training set) to construct a PLS-DA model in order to predict the class membership of the remaining samples (the test set, 20%).
The PLS-DA models calculated from 1H NMR spectra
of blood serum from Ehrlich tumour-induced Swiss and
Balb-C mice were able to predict the presence of tumours in both mice with 100% sensitivity with respect to the control and five days tumour-inoculated samples. However, class models from partial discriminations, such as those from three days tumour-inoculated and control groups, presented lower sensitivity of 42.9% and 63.6% for Swiss and Balb-C mice, respectively.
The appeal of the NMR-based metabonomics approach is its relatively simple methodology, though its success requires special attention to the standardisation of sample treatment23 specifically, long-term storage,24,25
freeze-thaw cycles,26 protein removal27 and extraction method.28
These variables can affect the quality, reliability and reproducibility of analysis. Unfortunately, NMR-based metabonomics analysis cannot be performed immediately after blood collection, thus requiring samples to be stored frozen. Therefore, to determine whether a freeze-thaw cycle causes changes in the chemical composition of mice
serum samples, stability assays were performed storing samples from different tumour-induced and control group mice either under refrigeration (–18 °C) and 10 °C for 40 days. The PLS-DA models developed to predict class membership were also used to verify sample stabilities. If changes in the chemical composition of the sample occurred as a consequence of storage, the sample will not be classified based on its original properties anymore. At 10 °C, all samples were incorrectly predicted after just one day of storage. On the other hand, at –18 °C, only a sample (n = 5) was incorrectly predicted after one day of storage, while after three-day storage, two samples (n = 5) were incorrectly predicted. After this period, all samples were incorrectly predicted, suggesting that it is not possible to store serum samples at 10 °C, whereas three days is the maximum length storage at –18 °C. After this window of time, samples presented changes in their chemical composition, including enhancement of signal at
δ 2.24 relative to aceto-acetate, reduction in lipid signals at δ 0.84-1.00, 1.28-1.32 and 1.60-2.80 and changes in δ 3.20-4.40 region relative to choline and its derivatives.
Effects of repeated freeze-thaw cycles on sample stability were also evaluated by 1H NMR-based metabonomics
analysis of blood serum samples over successive days. The PLS-DA models were again used to predict class membership of samples. In this, three samples (n = 7) were predicted as not belonging to any class, whereas the remaining four samples were properly classified suggesting that this process should be avoided, although no visual differences between before and after freeze-thaw cycles were observed in the 1H NMR spectra.
Discussion
According to the results obtained in this investigation, NMR-based metabonomic strategies show potential for early tumour diagnosis with good precision by means of
1H NMR spectra and chemometric analysis by PLS-DA.
The presence of Ehrlich tumours in both Swiss and Balb-C mice could be clearly detected on the fifth day after inducing the tumour. Considering that Swiss and Balb-C tumour-inoculated mice have a lifespan of 18.3 ± 2.9 and 21.0 ± 2.7 days, respectively, a diagnosis on the fifth day could be considered as an early diagnosis. However, it is important to notice that a partial discrimination could be achieved at three days after tumour induction, suggesting that there is something abnormal in the chemical composition of mice biofluids. In cancer treatment, a simple indication can be the key to the success of the treatment and save lives. This work shows in a small scale that it is possible to construct models in order to predict the presence of a tumour in
unknown samples, giving a glimpse of what can become a reality in the future.
In the animals inoculated with Sarcoma 180, it was more difficult to detect the presence of the malignance. Diseased groups were distinguished from matched control groups ten days post-incubation, which is unsatisfactory considering the average lifespan of tumour-inoculated animals of 18.0 ± 5.29 days. However, a partial discrimination was observed in early incubation times. These results can be explained by differences in tumour origin and its metabolic evolution. Sarcoma 180, known as Crocker’s tumour, originates from tissues and grows rapidly in most animals (≥ 90%) in which it is inoculated, although it regresses in approximately 8-10% of the cases.29 Tumour cells
translocate into almost every tissue and affects several metabolic pathways, which could explain chemometric results for the samples with the two kinds of tumours. On the other hand, Ehrlich tumour, which originates from epithelia, is a more specific type of tumour that grows rapidly.30 According to the findings there were
less changes in the chemical composition of blood serum in mice inoculated with Sarcoma 180 tumour cells than those inoculated with Ehrlich tumour cells. These changes were also observed when attempting to distinguish the animals according to the kind of tumour. At three days post-inoculation, the animals inoculated with Sarcoma 180 tumour cells could be clearly discriminated from those inoculated with Ehrlich tumour cells by PLS-DA. However, in later periods, partials discriminations were achieved, indicating similar changes in the chemical composition of mice blood serum, supporting the previous discussion. Moreover, the set scores of animals inoculated with Sarcoma 180 cells were allocated closer to those of the control groups compared to mice inoculated with Ehrlich tumour cells (data not showed). This supports that Sarcoma 180 causes less changes in the chemical composition of mice blood serum.
The X-loading plots indicated that the main regions statistically significant in discriminations were those from signals due to very low density lipoproteins (VLDL) and low density lipoproteins (LDL), lipids, lactate and glucose. In the 1980s, it was suggested that 1H NMR chemical shifts
of lipids be considered as potential non-invasive biomarkers of the malignancy.31,32 More recently, Bathen et al.33 used
NMR in association with neural networks to explore lipid profiles and lipoprotein levels in blood plasma from patients with a range of tumours and control groups. Their models were 83% accurate in predicting which patients had malignancies based on 1H NMR blood plasma lipid
between 1H NMR lipid signal intensities and tumour
grade, although they used in vivo NMR spectra. In the present study, the correlation between the presence of the malignance and lipid profile was evident in 1H NMR spectra
of blood serum. Thus, the lipid profile in blood serum can be considered as biomarker of disease. This correlation can be explained by the tumour cells’ primary diet of lipids carried by LDL and albumin.35 Another explanation could
be due to cancer cachexia occurrence. O’Connell et al.10
observed that cachectic mice present higher levels of lipids and lipoproteins when compared to their matched controls. Therefore, NMR-based metabonomic strategies can be used to discover disease biomarkers and assist in early evaluation of several malignancies.
The changes in fatty acid composition of blood serum as consequence of tumour were supported by GC-MS analysis, in which the decrease in saturated fatty acid content, such as palmitic (C16:0) and stearic (C18:0) acids, in tumour-induced
animals was verified, when compared to their matched controls (Table 1). Saturated fatty acids were identified as tumour biomarkers due to changes in its levels associated with proliferation, inflammation, necrosis and apoptosis.36
Lactate is considered a tumour biomarker. In this work, high content of lactate was found in tumour-induced groups. Tumours generally exhibit a high-energy demand that cannot be supported only by aerobic metabolism. Thus, most cancer cells rely on aerobic glycolysis and exploit the Cori cycle (which extracts ATP from glucose by anaerobic conversion to lactate) to provide the necessary energy for cellular processes. This phenomenon is referred to as “the Warburg effect”.10,36,37
In Ehrlich tumours, GC-MS analysis showed changes in sugar contents, especially mannose (Table 1). This is an interesting result, since it was not observed by NMR (it is not possible to identify this sugar in the 1H NMR spectra)
and highlighted the importance of other analytical tools for metabonomics. The decrease in glucose content in tumour-inoculated mice when compared to control groups can be explained by the increase in ATP production from glucose by anaerobic conversion to lactate, which was also observed in cachectic mice by O’Connell et al..10
Besides these metabolites, some other compounds were also observed in one or more discriminations, including choline and derivatives, valine and 3-hydroxybutyrate. In humans, choline deficiency may result in lack of VLDL and, as consequence, fatty liver condition and general liver damage. It is also associated with increased incidence of liver cancer.38 Several studies had already associated
alterations in the choline metabolism to several cancers. Non-invasive NMR spectroscopy and positron emission tomography techniques have been used for investigation
of choline metabolism for diagnosis, staging and therapy assessment in cancer patients.39,40 Valine, along with leucine
and isoleucine, is considered to be involved in stress, energy and muscle metabolism.38 Considering that an amino acid
imbalance is involved in alterations in intracellular protein synthesis, the deprivation of valine and methionine has been proposed as inhibitor of tumour growth.41 In turn,
3-hydroxybutyrate along with lactate are the end-products of aerobic glycolysis. Furthermore, Bonuccelli et al.
observed that those metabolites can also stimulate tumour growth and metastasis.42
Regarding the changes in the chemical composition of tumours, the X-loading plot indicated that the same metabolites, such as lipids and lipoproteins, lactate and glucose, were responsible for the observed discrimination. However, they were more evident in the first three days post-inoculation, while at longer times the tumour groups were overlapped, suggesting that mechanisms of both tumours become similar with tumour progression.
The genetic diversity was shown to have no influence, since identical results were obtained when using isogenic Balb-C mice and heterogeneous Swiss lineages. This finding suggests that the changes in biofluid chemical composition due to tumours are more significant than those from genetic diversity.
When samples from animals with food restrictions before blood collection were submitted to chemometric analysis, identical discrimination was achieved by PLS-DA, indicating that diet did not have any significant influence. This is a very important finding, meaning that the malignancy can be diagnosed independently of patient’s diet. The effect of diet on metabonomics is an important issue. Teahan et al.26 indicated that dietary effects provide a
huge potential bias for metabolomic studies of human blood serum. Though the diet did not represent a bias source in our investigation, since all animals had access to the same food, studies involving humans will require taking this factor into consideration.
The stability assay revealed that serum samples can be stored at –18 °C at a maximum of three days after preparation. After this time changes in chemical composition were detected. These changes can be associated with lipid and sugar degradation by changes in pH. Barton et al.43 showed changes in proteins and protein
fragments of human blood serum stored at 4 °C for 36 hours. Thus, stability evaluation should be performed on metabonomic investigation, and when possible storage should be avoided. If not possible, samples should be at least stored at the lowest temperature possible.
accordance with those observed by Teahan et al.26 for
human blood serum samples. The authors commented that although there were minimal differences, the compounds affected might be the biomarkers of interest. They also stated that the error might be systematic, and therefore cause an artificial discrimination between the groups upon chemometric investigation. The fact that three of the seven samples tested were incorrectly predicted by PLS-DA models support the authors’ conclusion that the freeze-thaw cycles must be kept to a minimum.
Conclusions
1H NMR spectroscopy allied with multivariate
analysis, such as PLS-DA, proved to be a valuable tool for tumour diagnosis in early stages. With this strategy it was possible to detect Ehrlich and Sarcoma 180 tumours five and seven days after cell inoculation, respectively. Lipids, lipoproteins, lactate, sugars, choline and derivatives, valine and 3-hydroxybutyrate were found to be the main metabolites (i.e., biomarkers), which had their content altered according to tumour onset and progress. The changes in the chemical composition of biofluids due to the tumour were more significant than those from genetic diversity and starvation. This work shows in a small scale that it is possible to construct calibration models in order to predict the presence of tumours in unknown samples, giving a glimpse of what can become a reality in the future.
Supplementary Information
Supplementary data are available free of charge at http://jbcs.sbq.org.br as PDF file.
Acknowledgments
The authors are grateful to CAPES (ADM 1948/05-9), CNPq (477374/2007-7), Finep, Fundação Araucária and UFPR for financial support and fellowships. C. W. P. S. G thanks CNPq for scholarship.
References
1. Streckfus, C. F.; Dubinski, W. P.; Expert Rev. Proteomics 2007,
4, 329.
2. Wulfkuhle, J. D.; Liotta, L. A.; Petricoin, E. F.; Nat. Rev. Cancer
2003, 3, 267.
3. Nicholson, J. K.; Lindon, J. C.; Holmes, E.; Xenobiotica 1999,
29, 1181.
4. Nicholson, J. K.; Lindon, J. C.; Nature 2008, 455, 1054.
5. Ellis, D. I.; Dunn, W. B.; Griffin, J. L.; Allwood, J. W.; Goodacre, R.; Pharmacogenomics 2007, 8, 1243.
6. Sumner, L. W.; Mendes, P.; Dixon, R. A.; Phytochemistry 2003,
62, 817.
7. Weljie, A. M.; Dowlatabadi, R.; Miller, B. J.; Vogel, H. J.; Jirik, F. R.; J. Proteome Res. 2007, 6, 3456.
8. Odunsi, K.; Wollman, R. M.; Ambrosone, C. B.; Hutson, A.; McCann, S. E.; Tammela, J.; Geisler, J. P.; Miller, G.; Sellers, T.; Cliby, W.; Qian, F.; Keitz, B.; Intengan, M.; Lele, S.; Alderfer, J. L.; Int. J. Cancer 2005, 113, 782.
9. Jordan, K. W.; Cheng, L. L.; Expert Rev. Proteomics 2007, 4, 389.
10. O’Connell, T. M.; Ardeshirpour, F.; Asher, S. A.; Winnike, J. H.; Yin, X.; George, J.; Guttridge, D. C.; He, W.; Wysong, A.; Willis, M. S.; Couch, M. E.; Metabolomics 2008, 4, 216. 11. Griffin, J. L.; Kauppinen, R. A.; J. Proteome Res. 2007, 6, 498. 12. Akira, K.; Masu, S.; Imachi, M.; Mitome, H.; Hashimoto, M.;
Hashimoto, T.; J. Pharm. Biomed. Anal. 2008, 46, 550. 13. Salek, R. M.; Maguire, M. L.; Bentley, E.; Robtsov, D. V.;
Hough, T.; Cheeseman, M.; Nunez, D.; Sweatman, B. C.; Haselden, J. N.; Cox, R. D.; Connor, S. C.; Griffin, J. L.; Physiol. Genomics 2007, 29, 99.
14. Jiang, N; Yan, X.; Zhou, W.; Zhang, Q.; Chen, H.; Zhang, Y.; Zhang, X.; J. Proteome Res. 2008, 7, 3678.
15. Spraul, M.; Neidig, P.; Klauck, U.; Kessler, P.; Holmes, E.; Nicholson, J. K.; Sweatman, B. C.; Salman, S. R.; Farrant, R. D.; Raha, R.; Beddell, C. R.; Lindon, J. C.; J. Pharm. Biomed. Anal.
1994, 12, 1215.
16. Eriksson, L.; Johansson, E.; Kettanah-Wold, N.; Wold, S.;
Introduction of Multi and Megavariate Data Analysis Using
Projection Methods (PCA and PLS-DA); Umetrics AB: Malmo,
Sweden, 1999.
17. Westerhuis, J. A.; Hoefsloot, H. C. J.; Smit, S.; Vis, D. J.; Smilde, A. K.; Velzen, E. J. J.; Duijnhoven, J. P. M.; Dorsten, F. A.; Metabolomics 2008, 4, 81.
18. Goodpaster, A. M.; Romick-Rosendale, L. E.; Kennedy, M. A.;
Anal. Biochem. 2010, 401, 134.
19. Sassaki, G. L.; Souza, L. M.; Serrato, R. V.; Cipriani, T. R.; Gorin; P. A.; Iacomini, M.; J. Chromatogr. A 2008, 1208, 215. 20. Fan, T. W. M.; Lane, A. N.; Prog. Nucl. Magn. Reson. Spectrosc.
2008, 52, 69.
21. Nicholson, J. K.; Foxall, P. J. D.; Anal. Chem. 1995, 67, 793. 22. Liland, K. H.; TrAC, Trends Anal. Chem. 2011, 6, 827. 23. Potts, B. C. M; Deese, A. J.; Stevens, G. J.; Reily, M. D.;
Robertson, D. G.; Theiss, J.; J. Pharm. Biomed. Anal. 2001,
26, 463.
24. Saude, E. J.; Sykes, B. D.; Metabolomics 2007, 3, 19. 25. Maher, A. D.; Zirah, S. F. M.; Holmes, E.; Nicholson, J. K.;
Anal. Chem. 2007, 79, 5204.
27. Tiziani, S.; Emwas, A. H.; Lodi, A.; Ludwig, C.; Bunce, C. M.; Viant, M. R.; Guenther, M. L.; Anal. Biochem. 2008, 377, 16. 28. Wu, H.; Southam, A. D.; Hines, A.; Viant, M. R.; Anal. Biochem.
2008, 372, 204.
29. Sato, D. Y. O; Wal, R.; Oliveira, C. C.; Cattaneo, R. I. I.; Malvezzi, M.; Gabardo, J.; Buchi, D. F.; Homeopathy2005,
94, 26.
30. Segura, J. A.; Barbero, L. G.; Márquez, J.; FEBS Lett. 1997,
414, 1.
31. Mountford, C. E.; Tattersall, M. H. N.; Cancer Surv. 1987, 6, 285.
32. Hakumäki, J. M.; Kauppinen, R. A.; Trends Biochem. Sci. 2000,
25, 357.
33. Bathen, T. F.; Engan, T.; Krane, J.; Axelson, D.; Anticancer Res. 2000, 20, 2393.
34. Negendark, W.; Sauter, R.; Anticancer Res. 1996, 16, 1533. 35. Edwards, I. J.; Berquin, I. M.; Sun, H.; O’Flaherty, J. T.;
Daniel, L. W.; Thomas, M. J.; Rudel, L. L.; Wykle, R. L.; Chen, Y. Q.; Clin. Cancer Res. 2004, 10, 8275.
36. Griffin, J. L.; Shockcor, J. P.; Nat. Rev. Cancer 2004, 4, 551.
37. Vander Heiden, M. G.; Cantley, L. C.; Thompson, C. B.; Science
2009, 324, 1029.
38. Wishart, D. S.; Jewison, T.; Guo, A. C.; Wilson, M.; Knox, C.; Liu, Y.; Djoumbou, Y.; Mandal, R.; Aziat, F.; Dong, E.; Bountra, S.; Sinelnikov, I.; Arndt, D.; Xia, J.; Liu, P.; Yallou, F.; Bjorndahl, T.; Perez-Pineiro, R.; Eisner, R.; Allen, F.; Neveu, V.; Greiner, R.; Scalbert, A.; Nucleic Acids Res. 2013, 41, D801. 39. Glunde, K.; Jacobs, M. A.; Bhujwalla, Z. M.; Nat. Rev. Cancer
2006, 11, 835.
40. Glunde, K.; Bhujwalla, Z. M.; Ronen, S. M.; Expert Rev. Mol. Diagn. 2011, 6, 821.
41. He, Y. C.; Cao, J.; Chen, J. W.; Pan, D. Y.; Zhou, Y. K.; World J. Gastroenterol. 2003, 9, 771.
42. Bonuccelli, G.; Tsirigos, A.; Whitaker-Menezes, D.; Pavlides, S.; Pestell, R. G.; Chiavarina, B.; Cell Cycle 2010, 13, 3506. 43. Barton, H. R.; Nicholson, J. K.; Eliott, P.; Holmes, E.; Int. J.
Epidemiol. 2008, 37, i31.
Submitted: November 18, 2013