Printed in Brazil - ©2006 Sociedade Brasileira de Química 0103 - 5053 $6.00+0.00
Article
* e-mail: [email protected]
Two-Dimensional Low Resolution Raman Spectroscopy Applied to Fast Discrimination of
Clinically Relevant Microorganisms: A Whole–Organism Fingerprinting Approach
Cesar Mello,*,a Katia J. Ciuffi,a Eduardo Nassar,a Diórginis Ribeiroa and Ronei Jesus Poppib
a
Instituto de Química, Universidade de Franca, CP 82, 14404-600, Franca - SP, Brazil
b
Instituto de Química, Universidade Estadual de Campinas, CP 6154, 13084-971, Campinas - SP, Brazil
A diferenciação de bactérias causadoras de gastrenterites através de métodos microbiológicos clássicos é muito eficiente, na maior parte dos casos. Todavia, o elevado custo dos reagentes e o tempo necessário para tais determinações, cerca de 4 dias, podem causar sérias conseqüências, quando os pacientes são crianças, idosos ou adultos com baixa resistência imunológica. Assim, a pesquisa por métodos espectroscópicos de baixo custo, que permitam tais determinações com pouco uso de reagentes e em curtos intervalos de tempo é extremamente relevante. Neste trabalho os principais microrganismos causadores de gastrenterites, E. coli, S. chroleraesuis, S. flexneri
foram avaliados. Foram preparadas sessenta dispersões para cada um dos microrganismos, usando solução fisiológica como solvente, e seus espectros adquiridos. Os espectros obtidos foram muito similares, tornando muito difícil a diferenciação dos microrganismos. Entretanto, aplicando a teoria de correlação generalizada em 2D, foi possível diferenciar os microrganismos avaliados usando o espectro síncrono como “impressão digital do organismo” em um curto intervalo de tempo (~10h).
The discrimination of the bacteria that cause gastroenteritis through classical microbiological methods is very efficient in the great majority of the cases. However, the high cost of chemicals and the time spent for such identifications, about four days, could generate serious consequences for the patients. Thus, the search for low cost spectroscopic methods which would allow a fast and reagentless discrimination of these microorganisms is extremely relevant. In this work the main microorganisms that cause gastroenteritis: E. coli, S. chroleraesuis, S. flexneri were studied. For each of the microorganisms sixty different dispersions were prepared using physiological solution as solvent and its Raman spectra recorded. The 1D spectra obtained were similar, making it very difficult to differentiate the microorganisms. However, applying the 2D correlation method, it was possible to identify the microorganisms evaluated using the synchronous spectrum as “whole-organism fingerprinting” in a reduced time interval (~10 h).
Keywords: whole-organism fingerprinting, 2D Raman, microorganism, bioanalytical chemistry, gastroenteritis
Introduction
A very common situation during summer is the high prevalence of bacterial gastroenteritis. These infections are highly prevalent in children, elderly and adult patients with some forms of immunodeficiency or organic impairment, who may be severely compromised or may even have lethal consequences caused by the infection. The main difficulty found in the treatment of such cases is the time necessary to identify the etiologic agent of the infection, to permit selection of the best antibiotic to treat it. Usually, the time spent to identify the type of
bacteria, by classical biological methods, is approxi-mately four days. Any delay in identifying the etiologic agent may produce severe consequences or even the death of the patient. Until the identification of the etiologic agent and the result of antibiogram,1 the clinical
of bacteria in solid or liquid culture media is a research field with intense activity.2
Nowadays some molecular biology techniques have been developed,3-4 which are able to identify
micro-organisms, pathogenic or not. Most of these methods use, basically, DNA amplification methods and immune-electrophoresis,5-8 to identify the type of microorganism.
However contamination during the DNA amplification phase may produce false positive or false negative results. Methods using infrared microspectrometry are also being developed, with excellent results for the discrimination of microorganisms in shorter time intervals (~6 hours).9-11
However, for their application in clinical environments, intensive therapy centers and clinical analyses laboratories, the cost of the microspectrometer becomes a limiting factor. Methods using Surface Enhanced Raman Spectroscopy (SERS) are also being studied, obtaining good results in the discrimination of the microorganisms in short time intervals.12
Again, the high cost of the instrument and the necessary chemical manipulations to obtain a reproducible rugged surface to increase the Raman signal make their application difficult in clinical analysis laboratories and intensive care units. Thus, the development of simple spectroscopic methods, with minimum sample manipulation and no special reagents, which would use low cost spectrometers, is a research field with intense activity.
The Low Resolution Raman Spectroscopy (LRRS) is a good alternative for quantitative or qualitative analytical applications of Raman spectroscopy,13 considering the low
cost, portability, the use of a laser in the near infrared range, and the easy of coupling with optical fibers, making measurements possible on-line and in situ in practically any type of environmental condition. However, the most important characteristic of LRRS is its similarity to near infrared spectroscopy (NIR) which is a well-established spectroscopic technique widely used in Analytical Chemistry.14 As in NIR, the bands observed in LRRS are
also broad, due to the low resolution of the Raman spectrometer (~ 15 cm-1) but, while in the NIR these bands
are based on overtones,15 in the LRRS the bands are based
on vibrational transitions.16 Thus, although all spectral
features are not clearly resolved in LRRS, there is the possibility of band assignments that are very difficult in NIR spectroscopy. Besides, in LRRS the strong interference of water absorption, which occurs in the NIR spectroscopy is not observed, increasing the possibilities of analytical applications, mainly in biomedical and bioanalytical problems. However, as with NIR spectroscopy, chemometric methods are required to obtain quantitative or qualitative information from LRRS spectra. The two dimensional Raman spectroscopy is a chemometric method especially useful in
LRRS, since the use of an extra dimension to represent the spectra permits the acquisition of information about overlapping, superposition and displacement of spectral bands not readily observable in complex 1D spectra.
The generalized two-dimensional spectroscopy
The generalized two-dimensional spectroscopy proposed by Isao Noda in 1993 is nowadays a well-established technique and has wide popularity, particularly among vibrational spectroscopists.17 The basic concept used
to build 2D correlation spectrum is the analysis of dynamic spectrum, i.e., the spectral analysis in the frequency domain of the spectral characteristics that changes in the time domain, due to external perturbations. These perturbations may be of diverse nature: electrical, chemical, mechanical, magnetic or others. In this work the perturbation used was the increase of the bacteria concentration dispersed in a physiological solution that causes a nonlinear response of bacterial amide groups, the critical piece of this work.18
The 2D correlation spectroscopy comprises, basically, two types of correlation spectra, the synchronous (Φ(ν1,ν2))
and asynchronous (Ψ(ν1,ν2)) spectra.
The synchronous and asynchronous spectra for discrete perturbations can be obtained using matrix algebra operations.19 Thus the synchronous spectrum can be
obtained through the dot product of a mean-centered spectral matrix (with the spectra in rows), of dynamic spectra X~ (ν) defined by (equation 1):
(1)
where n is the number of samples and n is the wavenumber (cm-1).
The asynchronous spectrum is the cross product of the original mean-centered spectral matrix of dynamic spectra (X~ ) and the matrix orthogonal to it, defined by (equation 2):
(2)
where Nk,j is the Hilbert-Noda matrix,20 defined by
(equation 3) :
(3)
variance of the data. The synchronous spectrum can easily sort out nonoverlapped bands. However, if the bands overlap, the asynchronous spectrum it is of greater value to analyze intricate 1D spectrum from complex systems.
Experimental
Growth conditions and bacterial dispersions
The bacteria Escherichia coli (ATCC 25922), Salmonella Chroleraesuis (ATCC 13312) and Shigella flexneri (ATCC 12022) were sowed, separately, in Petri plates containing Agar-Mueller Hinton solid culture media and incubated for growth in a bacteriological oven at 36.5 ºC for 10 hours. After 10 hours, the biomass of each was carefully collected by using sterile plastic inoculating loops and dispersed in isotonic physiological solution. When the bacteria are dispersed in an isotonic media the solution becomes turbid. This fact was used to correlate, through McFarland’s Scale (which is basically a nefelometric scale of barium sulfate solutions),21 the number of bacteria
dispersed in the isotonic solutions. Thus, comparing the turbidity of the bacteria dispersions with the standards of McFarland’s Scale, it is possible to obtain a good estimate of the number of bacteria dispersed in the isotonic medium. Sixty successive increments of 100 μL each were added into a quartz cuvette containing 1.1 mL of isotonic solution, of a stock dispersion that contains approximately 15x108
bacteria per mL each were added. This was repeated for each bacterial type separately. This procedure was chosen, after initial tests, to avoid high gradients from Rayleigh scattering due to successive additions and the weak Raman signal, due to the diluted dispersions. By following this procedure different dispersions ranging from 0 to 1.4x10⁸
bacteria per mL were obtained, as shown in Figure 1.
As it can be observed in Figure 1, the applied perturbation in this work was the increase of bacteria concentration changing the solvation degree of amide groups in a nonlinear way, enabling the application of two-dimensional correlation spectroscopy.
Raman measurements and sample set
Raman spectra were collected using an OceanOptics low resolution Raman spectrometer (Dunnedin, FL, USA) mod. R-2001, with a near-infrared 785 nm multimode diode laser adjusted to deliver 300 mW on the sample and a thermoelectrically cooled 2048-element CCD array detector to measure spectra from 200 to 2800 cm-1,
resulting in an overall spectral resolution of approximately 15 cm-1. The instrument was wavelength calibrated with
isopropyl alcohol and the dark current was subtracted from all spectra acquired.
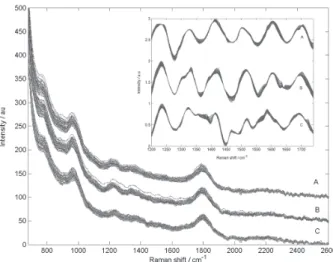
For each of the bacterial dispersions and for all bacteria evaluated in this work, three low resolution Raman spectra were acquired with a integration time of 10 seconds and the final spectrum was taken as the average of these three spectra, resulting in 60 spectra for each bacteria, in the increasing order of cell concentration, one summed spectra for each of 60 additions. The Rbase version 3.0.1 (Raman Systems Inc., Watertown, MA, USA) software was used for spectrometer control and data capture. The low resolution Raman spectra before and after pre-processing for Escherichia coli, Salmonella Choleraesuis and Shigella flexneri are shown in Figure 2.
Figure 1. Number of bacteria dispersed in the isotonic solution as func-tion of solufunc-tion addifunc-tions.
Figure 2. Typical low resolution Raman spectra before pre-processing showing the three spectral sets used in this work plotted together. The spectra are vertically offset, for better visualization: (A) Escherichia coli; (B) Salmonella chroleraesuis and (C) Shigella flexneri. Insert: Typical pre-processed low resolution Raman spectra showing the three spectral sets used in this work plotted together. The spectra are vertically offset, for better visualization: (A) Escherichia coli; (B) Salmonella chroleraesuis
Spectra pre-processing
The spectra were pre-processed in the following order: noise minimization by using a wavelet filter with Daubechies (db4) base function with two levels of decomposition and thresholding of 50%,22,23 subtraction
of isotonic medium and cuvette spectrum using the Gram-Schmidt method.24 The spectra were then range autoscaled
and truncated to select the region around the amide I band (~1680 cm-1), the principal region of interest for 2D
analyses.25,26
Computer programs
The programs for noise minimization, Gram-Schmidt method, and 2D calculations/visualizations were implemented by utilizing sub-routines from Matlab 4.0.
Results and Discussion
The pre-processed low resolution Raman spectra for Escherichia coli, Salmonella Choleraesuis and Shigella flexneri are shown as insert in Figure 2.
Figure 2 shows 60 low resolution Raman spectra for each bacteria evaluated in this work. It can be seen from the insert in Figure 2, that spectral changes during the addition are relatively small. Moreover, the differences among the spectra from different bacteria types are also small and an attempt to discriminate these bacteria through meticulous analysis of the spectra, with the naked eyed, is very cumbersome due to band overlapping.
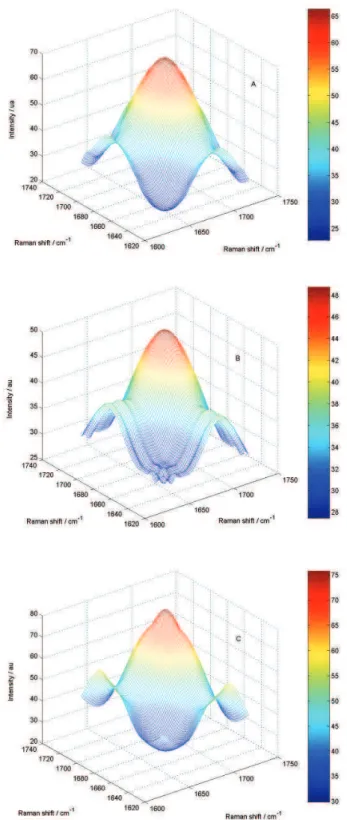
The 2D synchronous and asynchronous spectra were obtained in the region of the amide I band. This band was chosen after taking into account the fact that the cell walls of all bacteria used in this work consist of peptidoglycan crosslinked by polypeptide bridges, which vary among different species by changing the conformation of the bacterial wall. Localized amide I mode frequencies in a given polypeptide are strongly affected by the localized inter-peptide interaction and solvation, because the electronic and molecular structures of peptide bond change due to interactions with surrounding peptides and solvent molecules. Thus the critical piece of this work is the nonlinear response of bacterial amide groups as the cell concentration is changed. Solvation-induced amide I mode frequency shift and fluctuations in liquids, such as water and methanol, have been studied by using molecular dynamics simulation method in combination with an extrapolation method recently developed.27,28 Indeed in
the IR region, the frequencies due to amide, I, II and III vibrations are sensitive to the secondary structure elements of proteins due to solvation.29 Figure 3 shows
the synchronous surfaces of each bacterium in the region of amide I (~1680 cm-1).
Figure 3. Representative synchronous surfaces, around the amide I band, obtained for each one of bacteria: (A) Escherichia coli; (B) Salmonella
chroleraesuis and (C) Shigella flexneri, where the color bar indicates the
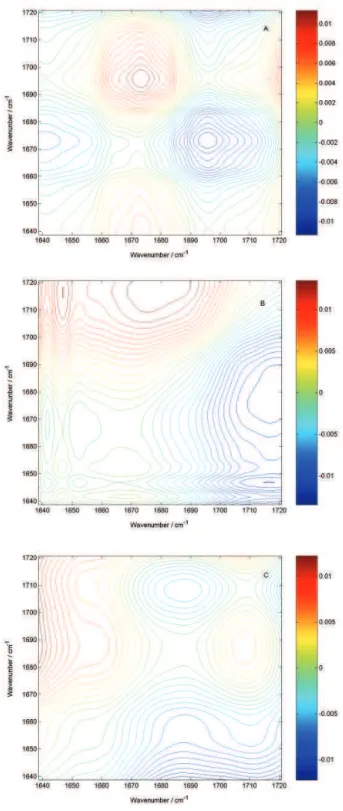
By analyzing only the synchronous surfaces of each bacterium, it is possible to discriminate them. The basis for this conclusion is obtained through analysis of the asynchronous spectra, shown in Figure 4.
Analysis of the asynchronous contour plots spectrum shows that a synchronous cross peak develops in a very
narrow region around 1680 cm-1, indicating that there is a
highly overlapped, amide I band, in the region around 1700 cm-1 , not observable in 1D spectrum.
This fact indicates that the differences observed in the synchronous surfaces are due to solvation of the amide groups, which changes the conformation of these polypeptides and inter-peptide interactions, affecting the amide I mode frequencies, and that it can be used as a powerful analytical tool for the fast discrimination of bacteria in biological samples.
Conclusions
As shown in this article, the approach based on LRRS in conjunction with generalized two-dimensional correlation spectroscopy (2D-LRRS) enables the discrimination of E. coli, S. chroleraesuis and S. flexneri bacteria, which display very similar Raman spectra. However to establish the proper antibiotic treatment, antibiogram tests need to be carried out, once the different strains of the same type of bacteria may bear different levels of resistance to a given antibiotic. The developed method can be used to build a wide and reliable “whole-organism fingerprinting” data bank or systems based on neural networks, for pattern recognition for fast bacteria discrimination in Intensive Care Units (ICU) and clinical environments.
Acknowledgments
The authors thank the Coordenadoria de Aperfei-çoamento de Pessoal de Ensino Superior (CAPES) and Fundação de Amparo à Pesquisa do Estado de São Paulo (FAPESP) for fellowships and financial support of their research projects. Thanks are also due to Professor C. H. Collins for critically reading the manuscript. Thanks are also due to Professor Y. Ozaki and Dr. Isao Noda for helpful discussions during the Second International Symposium on Two Dimensional Correlation Spectroscopy (2DCOS-2), Nottingham, U.K, 2003.
References
1. Chadwick, D.; Goode, J.; Antibiotic Resistance: Origins,
Evolution, Selection and Spread, John Wiley & Sons:
Chichester, 1997.
2. Mulvaney, S. P.; Keating, C. D.; Anal. Chem. 2000,72, 145R. 3. Tang, Y. W.; Ellis, N. M.; Hopkins, M. K.; Smith, D. H.; Dodge,
D. E.; Persing, D. H.; J. Clin. Microbiol. 1998, 36, 3674. 4. Tang, Y. W.; Procop, G. W.; Persing, D. H.; Clin. Chem. 1997,
43, 2021.
5. Fredricks, D. N.; Relman, D. A.; J. Clin. Microbiol. 1998, 36, 2810.
6. Mullis, K. B.; Faloona, F. A.; Methods Enzymol. 1987, 155, 335.
7. Grabar, P.; Burtin, P.; Immunoelectrophoresis, Elsevier: Amsterdam, 1964.
8. Bishop, M. L.; Duben-Engelkirk, J. L.; Fody, E. P.; Clinical
Chemistry: Principles, Procedures and Correlations, 4th ed.,
Lippincott, Willians & Wilkins: London, 2000.
9. Maquelin, K. L-P.; Choo-Smith.; Van Vreeswijk, T.; Endtz, H. Ph.; Smith, B.; Bennet, R.; Bruining, H. A.; Puppels, G.J.; Anal. Chem. 2000, 72, 12.
10. Naumann, D.; Helm, D.; Labischinski, H.; Nature1991, 351,81. 11. Helm, D.; Labischinski, H.; Naumann, D.; J. Microbiol. Meth.
1991, 14,127.
12. Jarvis, R. M.; Goodacre, R.; Anal. Chem. 2004, 76, 40. 13. McCaffery, T. R.; Durant, Y. G.; J. Appl. Polym. Sci.2002, 86,
1507.
14. Clarke, R. H.; Londhe, S.; Womble, M. E.; Spectroscopy1998,
13, 28.
15. Willian, P.; Norris, K.; Near-infrared Technology in Agricultural
and Foods Industries, American Association of Cereal
Chemistry: St. Paul, 1990.
16. Wetzel, D. L.; Anal. Chem. 1983, 55, 1165A. 17. Noda I.; Appl. Spectrosc.1993,47, 1329.
18. Zuo, L.; Sun, S. –Q.; Zhou, Q.; Tao, J. –X.; Noda, I.; J. Pharm.
Biomed. Anal. 2003, 30,1491.
19. Noda, I.; Dowrey, A. E.; Marcott, C.; Ozaki, Y.; Story, G.M.;
Appl. Spectrosc. 2000, 54, 264A.
20. Noda, I.; Appl. Spectrosc. 2000, 54, 994.
21. MacFaddin, J. F.; Biochemical Tests for Identification of
Medical Bacteria, Lippincott, Williams & Wilkins: London,
2000.
22. Walczak, B.; van den Bogaert, B. V.; Massart, D. L.; Anal. Chem. 1996, 68,1742.
23. Galvão, R. K. H.; Araújo, M. C. U.; Saldanha, T. C. B.; Visani, V.; Pimentel, M. F.; Quim. Nova2001, 24, 874.
24. Arfken, G. B.; Weber, H. J.; Mathematical Methods for
Physicists, 4th ed., Academic Press: San Diego, 1995.
25. Miyazawa, T.; Poly-α-Amino Acids, Marcel Dekker: New York, 1967.
26. Krimm, S.; Bandekar, J.; Adv. Protein Chem. 1986, 38, 181. 27. Ham, S.; Kim, J. H.; Lee, H.; Cho, M.; J. Chem. Phys. 2003,
118, 3491.
28. Ham, S.; Cho, M.; J. Chem. Phys. 2003, 118, 6915.
29. Harris, P. I.; Chapman, D. In Infrared Spectroscopy of
Biomolecules; Mantsch, H.H.; Chapman, D., eds.; John Wiley
& Sons: New York, 1996, p. 239.
Received: March 14, 2005 Published on the web: November 24, 2005