Artigo
*e-mail: [email protected]
DETERMINATION OF FLAVONOIDS IN STAMEN, GYNOECIUM, AND PETALS OF Magnolia grandiflora L. AND THEIR ASSOCIATED ANTIOXIDANT AND HEPATOPROTECTION ACTIVITIES
Nadia M. Sokkara,b,*, Mohamed A. Rabehb, Gamal Ghazalc and Amani M. Slemd
aNatural Products and Alternative Medicine Dept., Faculty of Pharmacy, King Abdulaziz University, Jeddah, 80200, Kingdom of
Saudi Arabia
bPharmacognosy Dept., Faculty of Pharmacy, Cairo University, Cairo, 11562, Egypt
cNational Organization for Drug Control and Research, 6 Abou-Hazem Street, Pyramids Ave. P.O.B. 29, Giza, Egypt dNational Research institute Dokki, Giza, Egypt
Recebido em 04/10/2013; aceito em 29/01/2014; publicado na web em 27/03/2014
Chromatographic analysis of flavonoids in ethyl acetate fractions of the stamen, gynoecium, and petal of Magnolia grandiflora L. by HPLC-PDA-MS/MS-ESI in the negative ionization mode was performed in this study. The results revealed the presence of eight flavonoids: apigenin 8-C-glucoside, luteolin 8-C-glucoside, quercetin 3-O-rutinoside, quercetin 3-O-galactoside, quercetin, 3-O-glucoside, kaempferol 3-O-rutinoside, isorhamnetin 3-O-glucoside, and isorhamnetin. Their quantification revealed that luteolin 8-C-glucoside is the major flavonoid and that the total phenolic content is concentrated primarily in the stamen. The antioxidant and hepatoprotective effects of ethanolic extract of the flower organs were evaluated against hepatotoxicity induced by CCl4, compared with the effects of silymarin.
Keywords: Magnolia grandiflora L.; antioxidant flavonoids; hepatoprotection.
INTRODUCTION
Magnolia is a genus comprising approximately 120 species and belongs to the family Magnoliaceae. Magnolia grandiflora L., com-monly known as the Southern Magnolia or bull bay, is native to the Southeastern United States and is cultivated in many Mediterranean countries, including Egypt. Phytochemical investigations of the flower have resulted in the identification of flavonoids,1 sesquiterpenes,2 and
volatile oils.3-8 Preparations from the flower have been extensively
documented in traditional Chinese medicine.9 Biological studies on
the extract of the flower have been conducted to investigate its effects on the cardiovascular system.2,10 The antimelanogenic, antioxidant,
antimicrobial,3,11 and anticancer effects of the volatile constituents
have also been investigated.5 Despite the importance of the flower of
M.Grandiflora, little information about its flavonoids is available. Hence, in the present investigation, we used HPLC-PDA-MS/MS-ESI to investigate the flavonoid content in the extracts of the stamen, gynoecium, and petal of Magnolia grandiflora cultivated in Egypt and studied the extracts’ antioxidant and hepatoprotective effects. EXPERIMENTAL
Standards and reagents
Vitexin, orientin, rutin, nicotiflorine, hyperoside, and isorham-netin were kindly supplied by the Pharmacognosy Dept., Faculty of Pharmacy, Cairo University. Folin–Ciocalteu reagent was obtained from Fluka (Switzerland). 2,2-Diphenyl-1-picrylhydrazyl (DPPH) was purchased from Sigma-Aldrich (Chemie GmbH, Steinheim, Germany). Silymarin was purchased from Grand Pharma Co., and chemicals for biochemical work were purchased from Sigma, BDH, and Merck (Darmstadt, Germany).
Solvents
Methanol, formic acid, and acetonitrile HPLC-grade solvents were purchased from Merck. All other chemical reagents and solvents were analytical grade (DBH). Double-distilled water was used in the HPLC mobile phase.
Plant material
The white flowers of M. grandiflora L. were properly collected from Wally’s private farm, Giza, Egypt in 2011. A sample was authenticated by Dr. Mohammad El-Gibali, senior botanist at the National Research Centre, Giza, Egypt. Voucher specimens of the separate floral parts (M-545) were deposited in the herbarium of Pharmacognosy Dept., Faculty of Pharmacy, Cairo University. The parts of the flower under investigation, i.e., the stamen, gynoecium, and petal, were air-dried and ground. The powders (120 g each) were defatted with petroleum ether for 24 h, and the marc of each organ was separately macerated in 70% ethanol until exhaustion. The concentrated residues of the stamen (EES), gynoecium (EEG), and petal (EEP) were used for the biological experiments.
General equipment
The mass detector was performed on Thermo LCQ Advantage Max ion trap mass spectrometer (Thermo Finnigan, San Jose, CA, USA). The analysis was performed using the following settings: the gas (air) was heated to 400 °C, capillary voltage was 4 kV, nebulizer gas was air, curtain gas was N2, collision gas was He, ionization was
performed in negative mode [M-H]−, and collision energy was 35.
The full-scan mass infusion was performed using a syringe pump (Hamilton syringe, 500 µL) directly connected to the electrospray io-nization unit and operated at a flow rate of 10 µL mL−1. The technique
HPLC analyses were performed using a PDA detector and an Intersil ODS-2 C18 column (2.1 × 50 mm2, particle size 3 µL, Alltech). The
solvent system consisted of (A) 0.1% formic acid in water and (B) acetonitrile:methanol (60:40 v/v). The gradient program was 70% A (0–2 min), 50% A (2–6 min), 30% A (6–9 min), 70% A (9–12 min); flow rate was 0.2 mL min−1, and injection volume was 20 µL. The
Xcalibur software (version 1.4) linked to the instrument was used to calculate the corresponding concentrations. TLC was performed on plates precoated with silica gel F254 (Fluka) (Merck, Germany). The TLC solvent systems for flavonoids were ethyl acetate:water:formic acid (85:15:10 v/v) and hexane:ethyl acetate:formic acid (20:19:1 v/v). The flavonoid spots were visualized under UV light (254 and 366 nm) before and after they were exposed to ammonia vapor or sprayed with natural products (NP) reagent.
Sample preparation for TLC and HPLC
Air-dried powdered samples of the stamen, gynoecium, and petal of M. grandiflora (5 g each) were defatted with petroleum ether for 24 h. The marc of each organ was extracted with 70% methanol by sonication at room temperature (1 h) and was subsequently filtered and concentrated under reduced pressure. The concentrated residues were separately suspended in water (50 mL) and fractionated between chloroform and ethyl acetate (5 × 100 mL, each). The concentrated ethyl acetate fraction of each organ was accurately dissolved in 10 mL of methanol (HPLC grade) for the chromatographic analysis. HPLC-PDA-LC-MS/MS quantification of flavonoids
The sample solutions were injected into the mass detector against reference standards of vitexin, orientin, rutin, nicotiflorine, hyperoside, and isorhamnetin (0.031–2 mg mL−1, each). The stock
solutions were stored at −20 °C. The stock and standard solutions were filtered through 0.45-µm filters before being injected into HPLC and were diluted as necessary with methanol. Each concentration of the standards was analyzed in triplicate. Quantification of the flavo-noid compounds was achieved by measuring the peak area against six concentrations of the standards and plotting standard curves; the concentrations of the compounds were determined as the mean values of three replicate injections. Quantitative determinations of vitexin, orientin, rutin, and nicotiflorine were performed as vitexin, orientin, rutin, nicotiflorine; hyperoside and isoquercetrin were determined as hyperoside; and isorhamnetin 3-O-glucoside and isorhamnetin were determined as isorhamnetin. Linear regression analysis for the curve was performed to determine y = ax + b, where a and b are the coefficients of the regression equation, x is the concentration of the standard compounds (µg mL−1), y is the peak area; the correlation
coefficient r was also calculated.
The limit of detection was calculated as the concentration cor-responding to three times the intensity of the background noise. The precision tests were performed by injecting each of the sample solu-tions six times. Measurements of the intra- and inter-day variability were used to determine the repeatability of the developed method. The intra-day variability was determined by analyzing each sample three times within the same day, and the inter-day reproducibility was performed on three different days. Relative standard deviation (RSD) was considered as the measure of precision.
Colorimetric determination of total phenols
A stock solution was prepared from the concentrated residues of another 70% methanol extract of the air-dried and defatted powdered stamen, gynoecium, and petal; the powders were dissolved in distilled
water to a concentration of 1 mg mL−1. Polyphenols were determined
using the Folin–Ciocalteau colorimetric method12 and expressed
as mg of gallic acid equivalents g−1 of the dry plant material. The
standard solution was prepared by dissolving 1 mg of gallic acid in 100 mL of water. A calibration curve was constructed in the range of 2–10 µg mL−1 by diluting the stock solution in water. The stock
and standard solutions (1 mL each) were separately mixed with 0.25 mL of Folin–Ciocalteau reagent and diluted to 25 mL using 290 g L−1 sodium carbonate in water. The absorbance was measured after
30 min at 730 nm against a blank prepared simultaneously using 0.5 mL of water as a compensating liquid.
Determination of median lethal dose (LD50)
The (LD50) of the hydro-ethanolic extracts of the stamen, gyno-ecium, and petal of M. grandiflora was estimated according to the method of Lorke.13
In vitro antioxidant effect
The antioxidant effect of the hydro-ethanolic extracts of the sta-men, gynoecium, and petal was measured using the stable radical of 2,2-diphenyl-1-picryl-hydrazyl (DPPH).14 The prepared test samples
(4 mg mL−1 methanol, each) and silymarin (2 mg mL−1) were added in
equal volumes (10 µL each) to a methanolic solution of DPPH (190 µL) and incubated in the absence of light at room temperature for 30 min. The absorbance values were measured against methanol at 517 nm on a spectrophotometer (Unicam UV–VIS spectrophotometer, Japan). All tests were performed in triplicate. The inhibition (%) was calculated according to the formula:
% of inhibition = (1 – Test absorbance/Control absorbance × 100) Hepatoprotective effect
The hepatoprotective effect of the hydro-ethanolic extracts of the stamen, gynoecium, and petal (100 mg kg−1 body weight, each)
were measured according to the method of Klassen and Plaa.15
Intra-peritoneal injection of 25% CCl4 in liquid paraffin (5 mL kg −1) was
used to induce liver toxicity in adult male albino Sprague–Dawley rats (120–155 g). The serum alanine aminotransferase (ALT), aspar-tate aminotransferase (AST), and alkaline phosphatase (ALP) were measured at time intervals of zero and two weeks before toxicity induction and 72 h and two weeks after CCl4 injection. The results
were compared with that of a silymarin reference (25 mg kg−1 body
weight). The negative control was considered for liver damaged rats receiving a daily dose of 1 mL saline.
Statistical analysis
The results were statistically analyzed using the Statistical Package for Social Sciences (SPSS, version 17; SPSS Inc., Chicago) for Windows, followed by Dennett’s multiple comparison test (DMCT); P < 0.05 was considered as significant.
RESULTS AND DISCUSSION
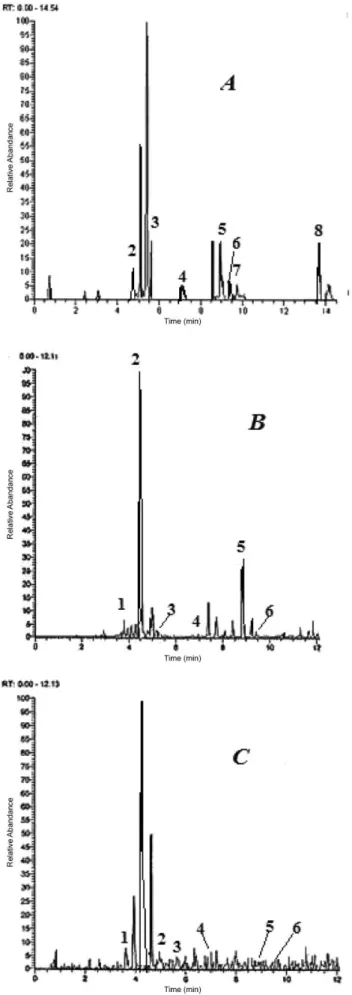
Qualitative detection of the flavonoids in the ethyl acetate fraction was performed by TLC and subsequently by HPLC-PDA. The HPLC chromatogram (Figure 1) revealed that methanolic acetonitrile with 0.1% formic acid gave the best separation of the flavonoid peaks.16 In the present work, a gradient flow was used to
phase applied in this experiment was the most suitable for the in-vestigation of the C-glycosides vitexin (1) and orientin (2), where their peaks showed a relative retention greater than 1. They were characterized on the bases of their product ion spectra, comparisons with reference samples, and literature data.17 TIC of LC-MS
n (n =
2) chromatograms detected another six flavonols: O-glycosides (3–7) and O-methylated aglycone (8). A comparison of the re-tention times, UV and mass spectra of the deprotonated molecule [M-H]– of glycosides and the ion corresponding to the deprotonated
aglycone [A-H]– with data compiled for known standards confirmed
their identification as rutin (3), nicotiflorine (4), hyperoside (5), isoquercetrin (6), and isorhamnetin (8). Isorhamnetin (8) exhibi-ted a specific fragmentation because of the loss of 15 units of the methyl radical to give m/z 300. The identification of compound 7 was supported by the loss of 162 units from the pseudomolecular ion m/z 477 [M-H]−. The MS
2 product-ion analysis of the parent
ion provided a fragmentation pattern of isorhamnetin glucoside, similar to the results previously reported in the literature.18 The
molecular ion at m/z =315 was suitable for the identification of isorhamnetin (Table 1).
Validation data
All the references standards (vitexin, orientin, rutin, nicotiflo-rine, hyperoside, and isorhamnetin) showed linearity (r2 = 0.985,
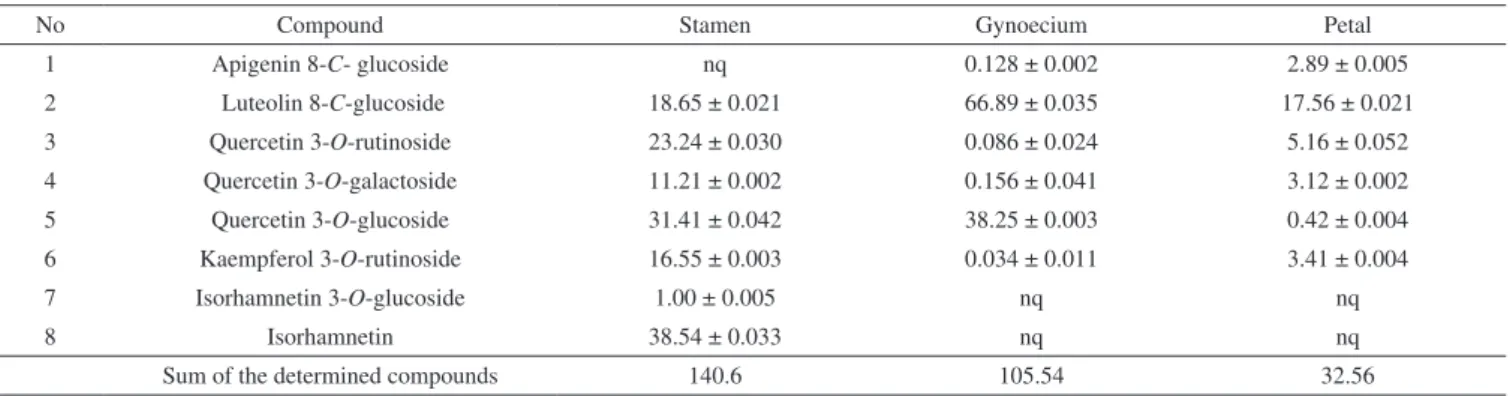
0.999, 0.951, 0.9437, 0.975, and 1, respectively) in a relatively different and wide concentration range. The RSD values of the inter-day precision experiments were 1, 1.88, 1.35, 2.14, 2.11, and 2.32%, respectively, and the intra-day variations were 2.04, 1.01, 1.10, 2.67, 1.89, and 2.11%, respectively. Their average regres-sion equations were: y = 0.119 + 462785x (vitexin); y = 0.369 + 137922x (orientin); y = 0.5612x + 0.0457 (rutin); y = 0.3393x − 0.6307 (nicotiflorine); y = 0.0851x + 0.1497 (hyperoside); and y = 1.7831x − 0.1302 (isorhamnetin). The accuracy was determined by calculating the recovery values for each of the quantified flavonoids and was found to be 96.65 ± 0.64%, 96.53 ± 3.22%, 98.21 ± 2.45%, 99.34 ± 2.23%, 96.89 ± 3.43%, and 94.45 ± 1.34%, respectively. The limits of detection were 7.14 (vitexin), 2.22 (orientin), 5.46 (rutin), 7.58 (hyperoside), 5.21 (nicotiflorine), and 5.83 (isorhamnetin). The identified compounds in the extracts of the floral parts of M. grandiflora L. were quantified by HPLC-PDA. The results (Table 2) show that the stamen extract contained the largest amounts of the identified flavonoids (ca. 140.6 mg g−1). Orientin was present in the
highest concentration (ca. 66 mg g−1) and was mainly concentrated in
the gynoecium. To the best of our knowledge, this study represents the first report of the presence of these flavonoids in the stamen, gynoecium, and petal of the M. grandiflora L.
In the case of quantitative determination of total polyphenols, the linear regression analysis was y = 0.0925x − 0.0244 (gallic acid), r2 =
0.992. The polyphenols content of the stamen was the richest (0.7359 ± 0.010 mg g−1 dry weight), followed by that of the petal (0.429 ±
0.012 mg g−1 dry weight) and gynoecium (0.2890 ± 0.022 mg g−1 dry
weight). The reported results are the means of three determinations. Toxicological studies revealed that the ethanolic extracts of the organs under investigation were safe in a dose up to 5.7 g kg−1 body
weight and can therefore be considered safe.19
In vitro antioxidant effect
Results of the in vitro antioxidant activity (Table 3) based on DPPH scavenging radical activity showed significant results for all the plant samples compared with that of the silymarin reference; EES was the most significant, with 67.26% potency, followed by EEG (52.71%) and EEP (47.14%).
Table 1. MW, Rt, UV, and MS2 in the negative mode of the flavonoids in the ethyl acetate extract of M. grandiflora
No Compound MW [M-H]
- m/z
Rt
min. UV max Precursor ions [m/z], MS2 1 Apigenin 8-C-glucoside 432 431 3.60 268, 335 311(100%), 341 (30%) 2 Luteolin 8-C-glucoside 448 447 4.96 256, 269, 350 327 (100%), 357(70), 428 (M-18),
343 (60%), 373 (45%) 3 Quercetin-3-O-rutinoside 610 609 5.61 257, 267sh, 359 301(100%) 4 Quercetin 3-O-galactoside 464 463 6.97 253, 260 sh, 350 447(100%), 301 (30%) 5 Quercetin 3-O-glucoside 464 463 8.94 253, 260 sh, 350 301 (30%)
6 Kaempferol 3-O-rutinoside 594 593 9.38 264, 346 315
7 Isorhamnetin 3-O-glucoside 478 477 9.74 258, 305, 361 477, 315
8 Isorhamnetin 316 315 13.96 253, 267 sh, 306 sh, 372 315, 300
Table 3. In vitro antioxidant effect of EES, EEG, and EEP of M. grandiflora
compared with that of silymarin
Treatment Change from control (%)
Control 56.1
Slymarin 89.8
EES 67.26
EEG 52.71
EEP 47.14
EES, ethanolic extracts of stamen; EEG, ethanolic extracts of gynoecium; EEP, ethanolic extracts of petal.
Table 2. Quantitative determination of the identified flavonoids in the ethyl acetate extracts of the stamen, gynoecium, and petal of M. grandiflora (mg g−1 ± SD) a
No Compound Stamen Gynoecium Petal
1 Apigenin 8-C- glucoside nq 0.128 ± 0.002 2.89 ± 0.005
2 Luteolin 8-C-glucoside 18.65 ± 0.021 66.89 ± 0.035 17.56 ± 0.021 3 Quercetin 3-O-rutinoside 23.24 ± 0.030 0.086 ± 0.024 5.16 ± 0.052 4 Quercetin 3-O-galactoside 11.21 ± 0.002 0.156 ± 0.041 3.12 ± 0.002 5 Quercetin 3-O-glucoside 31.41 ± 0.042 38.25 ± 0.003 0.42 ± 0.004 6 Kaempferol 3-O-rutinoside 16.55 ± 0.003 0.034 ± 0.011 3.41 ± 0.004
7 Isorhamnetin 3-O-glucoside 1.00 ± 0.005 nq nq
8 Isorhamnetin 38.54 ± 0.033 nq nq
Sum of the determined compounds 140.6 105.54 32.56
nq: not quantified. a Each result is the mean of three determinations ± standard deviation.
Table 4. Effect of EES, EEG, and EEP of M. grandiflora compared with that of silymarin on serum enzymes level in liver-damaged rats (n = 6)
Liver enzymes Zero 15 d 72 h 15 d % change
Control
AST(u/L) 29.4 ± 0.9 28.6 ± 0.4 78.4 ± 5.1 84.4 ± 5.9 ab -ALT (u/L) 31.6 ± 1.1 30.9 ± 0.7 88.9 ± 6.1 91.4 ± 5.7b -ALP (KAU) 6.8 ± 0.1 7.1 ± 0.1 28.9 ± 1.8 33.4 ± 2.3b
-EES
AST(u/L) 25.7 ± 1.1 28.1 ± 0.6 63.9 ± 2.4 38.9 ± 1.3 ab 35.5 ALT (u/L) 27.6 ± 0.4 27.1 ± 0.3 68.9 ± 2.6 30.1 ± 1.7 ab 56.3 ALP (KAU) 7.1 ± 0.1 8.8 ± 0.1 19.2 ± 0.8 10.8 ± 0.6b 43.2
EEP
AST(u/L) 38.9 ± 0.8 29.8 ± 0.7 67.3 ±2.5 39.1 ± 1.7 ab 35.2 ALT (u/L) 31.4 ± 1.1 30.7 ± 0.9 74.9 ± 3.2 48. 2 ± 2.1 ab 35.6 ALP (KAU) 7.4 ± 0.1 8.2 ± 0.1 20.7 ± 0.6 14.9 ± 0.7 ab 28
EEG
AST(u/L) 27.6 ± 1.2 30.8 ± 1.1 82.4 ± 2.7 56.8 ± 2.1 ab 31.1 ALT (u/L) 33.2 ± 1.2 33.5 ± 1.1 91.6 ± 3.8 63.2 ± 3.4 ab 21.4
ALP (KAU) 7.2 ± 0.1 7.4 ± 0.1 24.9 ± 41 22.9 ± 0.9b 8
Silym
AST(u/L) 28.3 ± 1.1 30.6 ± 0.9 55.3 ± 1.3 32.9 ± 0.6 a 40.5 ALT (u/L) 27.8 ± 0.5 26.8 ± 0.4 56.2 ± 1.8 29.2 ± 0.8 a 48 ALP (KAU) 7.3 ± 0.1 6.9 ± 0.1 18.3 ± 0.6 6.9 ± 0.1 a 62.3 aStatistically significant from 72 h time at p < 0.01; bStatistically significant from zero time at p < 0.01; silym, silymarin; EES, ethanolic extracts of stamen; EEG, ethanolic extracts of gynoecium; EEP, ethanolic extracts of petal.
Hepatoprotection effect
The results in Table 4 reveal that the administration of CCl4
induced acute liver toxicity, as evident from the increased levels of AST, ALT, and ALP. However, administration of doses of the test extracts under investigation or silymarin significantly preserved biochemical changes during CCl4 intoxification and confirmed their
and 35.2%, respectively.
The results of this investigation reveal that the stamen extract exhibited a protective effect against oxidative liver damage because of its high flavonoid content, which is not affected by the oxidative enzymes that induce a certain change in the color of other floral parts during drying or grinding1 and, consequently, may affect their
constituents. CONCLUSION
An investigation of the stamens, gynoecia, and petals of the flower of M. grandiflora was conducted for the first time and led to the identification of six flavonols in addition to vitexin and orientin. The ethanolic extracts of the organs under investigation exhibited bio-activities when examined for their antioxidant and hepatoprotection effects. The stamen extract exhibited a higher potency because of its total flavonoid content; these flavonoids exhibit hydrogen-donating--antioxidant activity and the ability to bind divalent metal cations. REFERENCES
1. Sato, M.; Hiraoka, M.; Watanabe, A.; Phytochemistry 1992,31, 3413. 2. Del Valle, M. L.; Tenorio, L. F. A.; Torres, N. J. C.; Zarco, O. G.;
Paste-lín, H. G.; Phytother. Res. 2009, 23, 666.
3. Guerra, B. L.; Alvarez, R. R.; Salazar, A. R.; Torres, C. A.; Rivas, G. V. M.; Waksman, T. N.; González, G. G. M.; Pérez, L. L. A.; Nat. Prod. Commun. 2013, 8, 135.
4. Báez, D.; Pino, J. A.; Morales, D.; Nat. Prod. Commun. 2012, 7, 237. 5. Farag, M. A.; Al-Mahdy, D. A.; Nat. Prod. Res. 2013, 27, 1091. 6. Jimenez, M. D.; Cordero, G. A.; Rojas, L. B.; Rodriguez, A. M.;
Abstract Book of XXI Italo Latin American Congress of Ethnomedicine; Revista de la Facultad de Farmacia 2007,49, 1.
7. Mohamed, S. M.; Ibrahim, N. A.; Ali, M. A.; Faraid, M. A.; 54th Annual
Congress of Medicinal Plants, Book of Abstracts Plant. Med.; University of Helsinki, Finland 2006, 72, 113.
8. Garg, S.; Kumar, S.; J. Essent. Oil Res. 1999,11, 633.
9. Leung, A. Y.; In Chinese Medicinals; Janick, J.; Simon, J. E., eds.; Advances in new crops. Timber Press: Portland, 1990, 499.
10. Mellado, V.; Chavez, S. M. A.; Lozoya, X.; Arch. Invest. Med. (Mex)
1980, 11, 335.
11. Huang, H. C.; Hsieh, W. Y.; Niu, Y. L.; Chang, T. M.; BMC Complementary Altern. Med. 2012, 12, 72.
12. Mruthunjaya, K.; Hukkeri, V. I.; Pharmacogn. Mag. 2008,4, 42. 13. Lorke, D.; Arch. toxicol. 1983, 275.
14. Williams, W. B.; Cuvelier, M. E.; Berset, C.; Lebensm. Wiss. Technol.
1995, 28, 25.
15. Klassen, C. D., Plaa, G. L.; Biochem. Pharmacol. 1969, 18, 2019. 16. Cuyckens, F.; Claeys, M.; J. Mass Spectrom. 2004,39, 1.
17. El-Hawary, S. A.; Sokkar, N. M.; Ali, Z. Y.; Yehia, M. M.; J. Food Sci.
2011, 76, 1195.
18. Schieber, A.; Keller, P.; Streker, P.; Klaiber, I.; Carle, R.; Phytochem. Anal. 2002, 13, 87.