Article
Printed in Brazil - ©2017 Sociedade Brasileira de Química0103 - 5053 $6.00+0.00*e-mail: [email protected]
Spectroscopic Characterization of Charge Transfer Complexes of TCNE with
Aromatic Amines - The First Step of Tricyanovinylation Reaction
Natália M. Monezi and Rômulo A. Ando*
Laboratório de Espectrocopia Molecular, Departamento de Química Fundamental, Instituto de Química, Universidade de São Paulo (USP), 05508-000 São Paulo-SP, Brazil
The first step of electrophilic aromatic substitution reactions generally involves the formation of charge transfer complexes. Tetracyanoethylene (TCNE) in the presence of aromatic amines forms π-type complexes that subsequently lead to tricyanovinylation reaction. Although this kind of reaction was investigated in the past, the spectroscopic characterization of the charge transfer complexes is still lacking, since in many cases the first step of the reaction is too fast to allow their characterization by conventional techniques. In this paper, it is shown the UV-Vis and resonance Raman characterization of the charge transfer complexes formed between TCNE and substituted anilines. The magnitude of the charge transfer could be linearly correlated with the electronic absorpion energies, as well as to the Raman shifts observed for the characteristic ν(C≡N) mode of TCNE. In addition, the results were correlated to ionization potentials of amines, and theoretical calculations by density functional theory/time-dependent density functional theory (DFT/TDDFT) methods were performed to support the experimental data.
Keywords: charge transfer, tetracyanoethylene, ionization potential, resonance Raman spectroscopy, DFT
Introduction
Molecular charge transfer complexes play a key role as intermediate species in a wide variety of organic reactions
involving nucleophiles and electrophiles species.1,2 The
typical reaction is the electrophilic aromatic substitution, where the formation of a charge transfer complex comprises
the first step of the reaction mechanism.2 Tetracyanoethylene
(TCNE) is a characteristic strong electron acceptor due to the presence of four cyano groups in its structure, which
leads to a deficient electron density at ethylenic group3
increasing its susceptibility to be attacked by nucleophilic
species in vinylic substitution reactions.4,5 When aromatic
amines acting as nucleophilic species interact with TCNE, the electrophilic aromatic substitution reaction called
tricyanovinylation takes place.6 The tricyanovinylation
reaction was investigated extensively in the past and the reaction mechanism consists essentially of three steps:
the formation of a π charge transfer complex, followed by
the formation of a σ-complex (Wheland complex) and the
final product.7-10 In the presence of secondary or tertiary
aromatic amines the substitution of the tricyanovinyl group
occurs at para position of phenyl ring, whereas in the
case of primary aromatic amines at the nitrogen atom.11
In other words, the different position of the tricyanovinyl group substitution in aromatic amine molecule depends whether the amine is primary or secondary/tertiary and which geometric configuration is favored in the charge transfer complex formation in solution. Therefore, it is important to have molecular structure information from this first step of the mechanism of the tricyanovinylation reaction, and the use of proper spectroscopic techniques can help in the understanding of this model charge transfer initiated reaction.
Charge transfer complexes generally show characteristic low energy allowed electronic transitions at visible region, resulting from the electronic excitation from HOMO (highest occupied molecular orbital) of electron donor species to LUMO (lowest unoccupied molecular orbital)
of electron acceptor species.12 The energy associated to
such transition is related to the magnitude of the charge transfer between the species. Therefore, the analysis of the UV-Vis spectra considering both the molar absorptivity
coefficient, ε, and the excitation energy can provide
the ε and lower the transition energy, higher is the charge
transfer interaction in both ground and excited states.13 In
this context, the use of resonance Raman spectroscopy is extremely convenient, since the vibrational modes associated to the charge transfer transition will result in selectively enhanced bands in the Raman spectra, particularly when the laser excitation energy is similar to
the respective electronic transition.14
Considering the application of vibrational spectroscopy in the study of TCNE and its compounds, a vast literature is available. A complete review illustrating the huge chemical versatility of TCNE and the application of vibrational spectroscopy in the characterization of its different
compounds was published by Miller.15 The use of infrared
and Raman spectroscopies is widespread in the study of
TCNE since the force constant associated to the C≡N
bond is significantly sensitive to any variation of charge on
TCNE.15 As the C≡N π* antibonding orbitals are populated,
the wavenumbers associated to the stretching modes of C≡N
decrease accordingly. In particular, considering the TCNE interaction with electron donor species, more specifically with methyl-substituted benzenes, the degree of the charge transfer can be linear correlated to the decrease of the band
assigned to the asymmetric b2uν(CN) stretching mode, as
demonstrated by Kubiak and co-workers16 using infrared
spectroscopy.
As mentioned before, the interaction of TCNE with substituted aromatic amines leads to the formation of a tricyanovinylation product. The tricyanovinylation is a bimolecular reaction whose polarity of the medium affects
drastically the reaction rate.17 In a recent paper we showed
the role played by the solvent in the tricyanovinylation
reaction between TCNE and N-methyl-diphenylamine in
acetonitrile and dichloromethane.18 In the case of polar
solvents, e.g. acetonitrile, the formation of the charge transfer complex is followed by the rapid formation of an intermediate zwitterionic species, which is promptly transformed in the tricyanovinylation product. In the case of dichloromethane, if the reactants are at 1:1 molar proportion, the consumption of the charge transfer complex is slower and the zwitterionic species is stabilized allowing its spectroscopic characterization by conventional
techniques.18 The fact that in particular conditions the
charge transfer complexes formed between TCNE and a family of aromatic amines are stabilized in solution for at least few minutes or hours, prompted us to characterize them by UV-Vis and resonance Raman spectroscopies.
Therefore, our main objective in the present paper is to show the vibrational characterization of such complexes and the correlation of the amine properties to the observed charge transfer transition energies and wavenumbers of the
characteristic vibrational modes. The complexes between electron donor species and TCNE are considered model compounds, and the interest in the complexes of TCNE and methyl substituted benzenes has been renewed in the context of the reliability of computational methodologies in describing the charge transfer interaction.19-22 To the best of
our knowledge, no work shows the experimental vibrational characterization of the complexes formed between TCNE and the family of methyl-substituted anilines studied here. The aromatic amines used in this work were aniline
(ANI), N-methylaniline (NMA), N,N-dimethylaniline
(DMA) and 4,N,N-trimethylaniline (TMA). Such series
was chosen since the basicity is gradually increased as the number of methyl groups increases, so it is expected that their association with TCNE leads to the formation of molecular complexes with gradual lower transition
energies,19 depending on the donor ionization potentials.16
In order to support the experimental data, theoretical calculations based on density functional theory (DFT) and time-dependent density functional theory (TDDFT) were performed to obtain the complexes geometries, vibrational spectra, electronic transition energies and atomic charges.
Experimental
Aromatic amines, aniline, ANI, (99.5%), N-methylaniline,
NMA, (99.5%), N,N-dimethylaniline, DMA (99.5%),
4,N,N-trimethylaniline, TMA (98%), tetracyanoethylene,
TCNE (98%) and dichloromethane, CH2Cl2 (99.9%
Chromasolv®) were acquired from Sigma-Aldrich. The aromatic amines were distilled under low pressure prior to use and TCNE was used without further purification. The solutions of aromatic amines and TCNE were prepared in dichloromethane at 1:1 molar proportion with concentration
at 3.0 × 10⁻² mol L-1 for the UV-Vis-NIR (near infrared)
measurements, and at higher concentration (0.3 mol L-1) for
the Raman measurements. The UV-Vis-NIR spectra were obtained in a Shimadzu UV PC 3101 spectrophotometer using a 1 mm optical path quartz cuvette. The Raman spectra were obtained in a Renishaw InVia Reflex equipped with a CCD detector thermoelectrically cooled and coupled to a
Leica DM2500 microscope. The laser excitations at λ0 = 532,
633 and 785 nm from Renishaw were used. Due to the reaction between TCNE and aromatic amines, the UV-Vis and Raman spectra were acquired immediately after the mixture of reactants in triplicate.
Theoretical methods
calculations using the exchange-correlation energy pure
functional B97D to consider the dispersion effect23 and
the 6-311++G(3df,3pd) as atomic basis set. The theoretical absorption UV-Vis-NIR spectra were calculated using
the TDDFT protocol24 and in order to account for solvent
effects, the SMD (solvation model based on density) model
was used considering dichloromethane.25 The calculated
UV-Vis spectra were plotted using a Gaussian shape fitting function implemented in GaussView5 software, which considers the vertical energy and the oscillator strength associated to each transition. The calculated Raman spectra were obtained also at B97D/6-311++G(3df,3pd) level and to account for BSSE (basis set superposition error) the counterpoise correction was applied. To plot the Raman
spectra no scaling factor was used and a bandwidth of 5 cm-1
was considered. The potential energy distribution analysis to obtain detailed vibrational assignments was performed
using the VEDA 4 program.26 In order to account for the
degree of charge transfer between the donor species and TCNE the atomic charges were computed using natural population analysis (NPA) from natural bond orbital (NBO)
analysis.27 All the calculations were performed with the aid
of the Gaussian 09 software.28
Results and Discussion
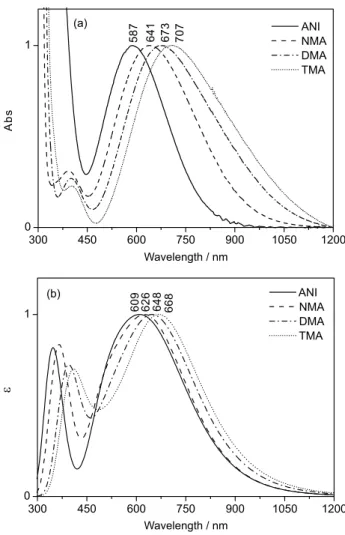
Figure 1a shows the experimental absorption spectra (UV-Vis-NIR) of the charge transfer complexes formed
between TCNE and aniline (ANI), N-methylaniline (NMA),
N,N-dimethylaniline (DMA), and 4,N,N-trimethylaniline,
(TMA) in CH2Cl2 solution. It is clearly observed a well
behaved trend of the charge transfer electronic transition energies as the number of methyl groups in the amine increases. The complex TCNE-ANI absorbs at 587 nm, while the TCNE-TMA, with three methyl groups, at 707 nm, i.e., as the basicity of the electron donor increases
(pKb values ANI 9.4, NMA 9.2, DMA 8.9 and TMA
8.4), the charge transfer transition energy decreases. Figure 1b shows the respective theoretical absorption
spectra obtained for the complexes in CH2Cl2 (SMD) at
B97D/6-311++g(3df,3pd) level using the TDDFT protocol. Although there is a discrepancy in the transition energies, the exact same trend was observed regarding the number of methyl groups in the donor species. The complexes geometries, as well as the frontier orbitals (HOMO and LUMO) are shown in Figures S1 and S2, respectively, in Supplementary Information. It is worth mentioning that the same calculations were performed using the B3LYP hybrid functional, but the calculated transition energy values were all underestimated by ca. 100 nm. It is known that the B3LYP functional usually overestimates the charge transfer
interaction in molecular complexes,29 especially when the
interaction between species is weak or moderate as is the case of the complexes studied in this work. Therefore, the B97D functional was chosen, since in contrast to B3LYP,
it accounts for a dispersion interaction term,30 and in fact
showed a better agreement with the experimental results.
The trend observed for the transition energies of the complexes formed between TCNE and substituted anilines is very similar to the well behaved trend observed for the complexes of TCNE with methyl substituted benzenes
and TCNE. Chan and Liao31 showed in a systematic study
for 13 substituted benzenes with increasing number of methyl groups, that the maximum absorption values range from 385 nm for TCNE-benzene complex to 535 nm for
TCNE-hexamethylbenzene in CCl4 solution. In addition,
the authors showed a linear correlation between the ionization potential of the donor species and the electronic
Figure 1. (a)Experimental UV-Vis-NIR spectra of the charge transfer complexes formed between TCNE and aromatic amines in CH2Cl2 at
concentration of 3.0 × 10⁻² mol L-1; (b) the respective theoretical electronic
spectra obtained by TDDFT calculations at B97D/6-311++G(3df,3dp) level considering CH2Cl2 as solvent (SMD). *Abs and ε were normalized
transition energies of the charge transfer complexes
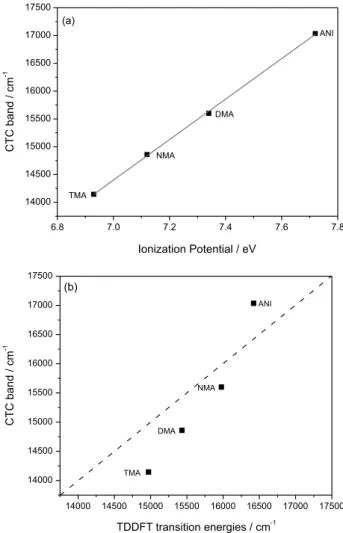
investigated.31 In fact, in Figure 2a, it can be observed a
linear correlation between the transition energies (in cm-1)
and the experimental ionization potentials,32 where the
relation is hν (cm-1) = 0.45IP – 11105 (R2 = 0.9993).
Figure 2b shows the comparison of the experimental values observed for the charge transfer transition bands and the respective calculated values obtained by TDDFT. It can be observed that the slope of the calculated curve is greater than the ideal correlation. In order to determine the main source of such discrepancy a more systematic theoretical investigation is needed comprising different computational methodologies and solvation models, which is out of the scope of the present work.
As mentioned before, the vibrational spectroscopy is a powerful tool to characterize compounds containing the TCNE molecule, since it has a relatively simple structure and high symmetry, which result in very characteristic
vibrational modes, especially the stretching modes
associated to C≡N and C=C bonds.15 As the molecule
belongs to the D2h point group, the most prominent Raman
active modes are from Ag symmetry species, i.e., the ν(C≡N)
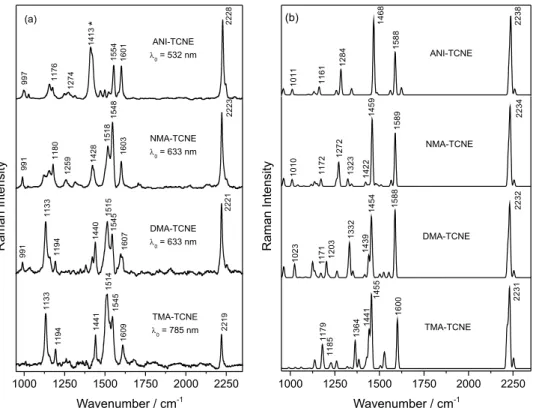
and (C=C) symmetric stretching modes.33 Figure 3a shows
the Raman spectra of the complexes formed between TCNE
and ANI, NMA, DMA, and TMA in CH2Cl2 solution. In
order to maximize the resonance conditions, the spectra were obtained using the available excitation laser more similar in energy as possible to the maximum electronic absorption of each complex, according to the UV-Vis spectra. Figure 3b shows the respective calculated Raman spectra obtained at B97D/6-311++g(3df,3pd) level. Table 1 shows the experimental and calculated values of the characteristic bands, as well as the approximate vibrational assignments, and the potential energy distribution (PED) to show the contribution of the more relevant internal coordinates in the normal mode.
The resonance Raman spectra of the charge transfer complexes investigated show similar features. However, there are subtle changes in both wavenumbers and relative intensities. The most characteristic vibrational band is
the symmetric stretching mode, ν(C≡N) in the 2220 cm-1
region. Figure S3 (Supplementary Information) shows
the experimental Raman spectrum of TCNE in CH2Cl2
solution, where the ν(C≡N) band appears at 2230 cm-1. As
expected, there is a gradual decrease of the wavenumber
of the ν(C≡N) with the increasing number of methyl
groups in the aromatic amines. In ANI-TCNE it appears at
2228 cm-1, in NMA-TCNE at 2223 cm-1, in DMA-TCNE at
2221 cm-1 and in TMA-TCNE at 2019 cm-1. The calculated
Raman spectra showed a very good agreement considering
the ν(C≡N) stretching mode, where the same trend with
the increasing number of methyl groups was observed.
The calculated values range from 2238 to 2231 cm-1 in
ANI-TCNE and TMA-TCNE, respectively. Figure S3 (Supplementary Information) also shows the calculated
Raman spectrum for TCNE in CH2Cl2 (SMD).
Another important vibrational mode is the ν(C=C)
stretching of ethylenic group at ca. 1550 cm-1, that
also responds to the degree of charge transfer. In fact,
in ANI-TCNE complex it is observed at 1554 cm-1, in
NMA-TCNE at 1548 cm-1 and in DMA-TCNE and
TMA-TCNE at 1545 cm-1. In the calculated Raman spectra,
such mode gives origin to intense bands at ca. 1455 cm-1,
i.e., the vibrational frequency is underestimated by
ca. 100 cm-1 in comparison to the experimental values.
Although there is a discrepancy between the wavenumbers, it can be noted the calculated values reproduced the same trend observed in the experimental spectra, i.e.,
in the calculated ANI-TCNE spectrum the ν(C=C) was
Figure 2. (a)Transition energies in cm-1 of charge transfer complexes
Table 1. Experimental and calculated Raman wavenumbers (cm-1), the vibrational assignments and the respective potential energy distribution for charge
transfer complexes formed between TCNE and aromatic amines
Experimental Calculated Assignmentsa PEDb / %
ANI-TCNE 997 1176 1274 1413* 1554 1601 2228 1011 1161 1284 1468 1588 2238 φ1 φ9a
ν(C−N) + δNH ν(C−N) *product
ν(C=C) φ8a
ν(C≡N)
νCC(51) δCH(76) νCN(55) νCC(69) νCC(38) νCN(88) NMA-TCNE 991 1180 1259 1428 1518 1548 1603 2223 1010 1172 1272 1323 1422 1459 1589 2234 φ1 φ9a
ν(C−N) + δNH ν(C−N) + δCH3
ν(C=C) + δCH3
ν(C=C) φ8a
ν(C≡N)
νCC(53) + νCN(10) νCC(10) + δHCC(10) + δCCC(25) νCN(25) + δHNC(10) + δCCC(12) νCC(14) + νCN(17) + δHCC(32) δHNC(14%) + δHCC(23) + δHCH(12)
νCC(71) νCC(39) νCN(88) DMA-TCNE 991 1133 1194 1440 1515 1545 1607 2221 1023 1171 1203 1332 1439 1454 1588 2232 φ1
δCH3
φ9a
ν(C−N) + δCH3
ν(C=C) + δCH3
ν(C=C) φ8a
ν(C≡N)
νCC(58)
νCC(10) + νCN(12) + δHCC(11) + δHCN(14) + τHCNC(12) δHCC(65)
νCN(21) νCC(14) + δHCH(38) νCC(43) + δHCH(12)
νCC(42) νCN(77) TMA-TCNE 1133 1194 1441 1514 1545 1609 2219 1179 1185 1364 1441 1455 1600 2231
δCH3
φ9a
ν(C−N) + δCH3
ν(C=C) + δCH3
ν(C=C) φ8a
ν(C≡N)
νCC(13) + δHCC(13) δHCC(10) + τHCNC(44)
νCN(40) νCC(16) + δHCH(37) νCC(42) + δHCH(25)
νCC(39) νCN(88)
aVarsanyi notation, φ (ring modes), ν (stretching) and δ (deformation); bpotential energy distribution obtained using VEDA 4 program.26
Figure 3. (a)Resonance Raman spectra of the charge transfer complexes formed between TCNE and aromatic amines in CH2Cl2 at concentration of
observed at 1468 cm-1, in NMA-TCNE at 1459 cm-1 and
in DMA-TCNE and TMA-TCNE at 1455 cm-1. In the case
of the amines substituted with methyl groups, i.e., NMA,
DMA and TMA, the ν(C=C) mode couples to δ(CH3)
deformation (Table 1) giving origin to a lower frequency
component at ca. 1515 cm-1 clearly seen in the experimental
Raman spectra (Figure 3a). As expected, the wavenumber of such band decreases and its relative intensity increases as the number of methyl groups increases. In the calculated Raman spectra, this mode appears with significant intensity only in the spectra of DMA-TCNE and TMA-TCNE at
1439 and 1441 cm-1, respectively.
The intense band at 1413 cm-1 (marked with an asterisk,
Figure 3a) appears in the spectrum of ANI-TCNE complex
and is assigned to the ν(C−N) of the tricyanovinylation
product (N-tricyanovinylaniline).34 It can be confirmed by
the comparison of the Raman spectra of the ANI-TCNE
charge transfer complex and the N-tricyanovinylaniline
product shown in Figure S4 (Supplementary Information). In the case of aniline, even at 1ANI:1TCNE proportion in
CH2Cl2 solution, the reaction is faster in comparison to the
other amines, causing the appearance of the product spectral features in the charge transfer spectrum. As shown in Figure S4, the product bands do not interfere in the analysis of the ANI-TCNE charge transfer Raman spectrum.
The characteristic aromatic amine bands appear at
ca. 1600, 1440, 1270, 1180, 1130 and 990 cm-1, whose
approximate vibrational assignments are listed in Table 1, as well as the corresponding calculated values. Figure S5 (Supplementary Information) shows the experimental and theoretical spectra of the pure and isolated amines, respectively, and Table S1 (Supplementary Information) shows the wavenumbers and vibrational assignments.
Finally, in order to check if the wavenumbers of
the Raman active symmetric stretching mode, ν(C≡N),
observed for the complexes formed between TCNE and aromatic amines, also has a linear correlation with the ionization potentials (IP) of the donor species, as in the case of the experimental electronic transition energies (Figure 2a), the experimental values of νs(C≡N) were plotted
in function of the IP of the amines, as shown in Figure 4.
The linear correlation gives ν(cm-1) = 11.3IP + 2140
(R2 = 0.9899), showing how the Raman spectroscopy can be
used to estimate the ionization potential of a donor species interacting with TCNE.
In the work of Kubiak and co-workers,16 the authors
also showed a linear correlation of the infrared active
asymmetric stretching, ν(C≡N), with the ionization
potentials of the methyl substituted benzenes. Moreover, the authors showed a linear correlation of the infrared
wavenumber of ν(C≡N) and the degree of the charge
transferred from the donor species to TCNE, based on the
ν(C≡N) values observed for the three possible species of
TCNE, neutral (TCNE0), radical anion ([TCNE]•-1) and
dianionic ([TCNE]-2).16 Unfortunately, we could not find a
reliable value for the Raman active ν(C≡N) mode for the
[TCNE]-2 dianionic species, so using a similar approach
of the paper of Kubiak and co-workers,16 and considering
only the values of TCNE0 (2235 cm-1)15 and [TCNE]•-1
(2194 cm-1),15,35 we determined the following linear
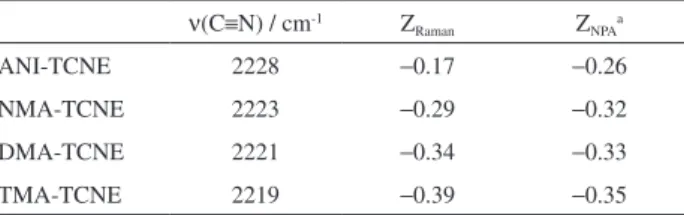
relationship ν(C≡N) / cm-1 = −41Z + 2235, where Z is the
estimated charge transferred to TCNE from experimental
ν(C≡N) Raman values. Table 2 shows the estimated values
of Z for the charge transfer complexes investigated. In order to make a comparison, the amount of charge transferred to TCNE was obtained from the DFT calculations performing a natural population analysis (NPA) from natural bonding
orbital (NBO),27 whose values are also shown in Table 2.
Although in ANI-TCNE there is a discrepancy, it can be observed a fair agreement between the charge transfer values estimated from the Raman spectra, and the calculated
Table 2. Experimental ν(C≡N) Raman wavenumbers (cm-1) for the
complexes of TCNE with aromatic amines, the amount of charge transferred (ZRaman) estimated from the ν(C≡N) values and the calculated
charge transferred from natural population analysis (ZNPA)
ν(C≡N) / cm-1 Z
Raman ZNPAa
ANI-TCNE 2228 −0.17 −0.26
NMA-TCNE 2223 −0.29 −0.32
DMA-TCNE 2221 −0.34 −0.33
TMA-TCNE 2219 −0.39 −0.35
aThe degree of the charge transfer Z
NPA was obtained from the difference in
the atomic charges of the isolated TCNE and its complexes with amines. TCNE: Tetracyanoethylene; ANI: aniline; NMA: N-methylaniline; DMA: N,N-dimethylaniline; TMA: 4,N,N-trimethylaniline.
values from NPA for the complexes. Considering that in the case of the complex of TCNE with hexamethylbenzene the estimated charge transfer is in the order of −0.10,16 the
values obtained in this work for the complexes of TCNE with aromatic amines are reasonable, since they are better donor species than aromatic hydrocarbons.
Conclusions
The charge transfer complexes formed by TCNE and methyl substituted anilines were characterized by UV-Vis, resonance Raman and DFT calculations. The UV-Vis spectra showed a linear correlation of the charge transfer transition energies and the ionization potential of the amines depending on the number of methyl groups. The resonance Raman characterization for the complexes investigated was shown for the first time, and it was possible since in particular conditions the charge transfer complexes could be stabilized for at least few minutes or hours. Moreover, the resonance Raman condition allowed the characterization of the complexes without the interference of other eventual species in solution. As in the case of the charge transfer
transition energies, the symmetric stretching ν(C≡N)
mode, also showed a linear dependence of the observed wavenumber with the ionization potential of amines.
Using a simple relation of the Raman ν(C≡N) values
observed for the neutral and anionic TCNE species the charge transfer values were estimated and are within the values expected for amines. Although few discrepancies were noticed, the theoretical DFT calculations for the UV-Vis and Raman spectra, and also for the estimated charge transfer, reproduced well the trends observed in the experimental data. As the charge transfer complexes formed by TCNE are considered model compounds, and particularly in the case of aromatic amines is the first step of the tricyanovinylation reaction, the results presented herein can contribute in the understanding of the charge transfer process and how it related to the mechanism of electrophilic aromatic substitutions.
Supplementary Information
Supplementary information contains the DFT optimized structures of the complexes; the HOMO-LUMO contour orbitals; experimental and theoretical Raman spectra of tetracyanoethylene; experimental Raman spectrum of the product of reaction between TCNE and aniline; experimental and theoretical Raman spectra of aromatic amines, as well as the vibrational assignments. This material is available free of charge at http://jbcs. sbq.org.br as PDF file.
Acknowledgments
This work was supported by the Fundação de Amparo à Pesquisa do Estado de São Paulo (FAPESP 2012/13119-3). R. A. A. thanks the Conselho Nacional de Desenvolvimento Científico e Tecnológico for the research fellowship (CNPq 306690/2015-2). N. M. M. thanks the Coordenação de Aperfeiçoamento de Pessoal de Nível Superior for the fellowship (CAPES 132249/2012-0).
References
1. Kochi, J. K.; Angew. Chem., Int. Ed.1988, 27, 1227. 2. Rosokha, S. V.; Kochi, J. K.; J. Org. Chem.2002, 67, 1727. 3. Dhar, D. N.; Chem. Rev.1967, 67, 611.
4. Rappoport, Z.; J. Chem. Soc.1963, 4498.
5. Ohashi, M.; Suwa, S.; Osawa, Y.; Tsujimoto, K.; J. Chem. Soc.,
Perkin Trans. 11979, 2219.
6. Farrell, P. G.; Newton, J.; J. Chem. Soc. B1970, 1630. 7. Rappoport, Z.; Horowitz, A.; J. Chem. Soc.1964, 1348. 8. Henderson, R; Sheppard, W. A.; J. Org. Chem.1967, 32,
858.
9. Farrell, P. G.; Wojtowsk, R. K.; J. Chem. Soc. C1970, 1390. 10. Nogami, T.; Hasegawa, Y.; Shirota, Y.; Mikawa, H.; Bull. Chem.
Soc. Jpn.1975, 48, 3048.
11. Rappopor, Z; Shohamy, E.; Isr. J. Chem.1968, 6, 865. 12. Mulliken, R. S.; J. Am. Chem. Soc.1952, 74, 811.
13. Dewar, M. J.; Lepley, A. R.; J. Am. Chem. Soc.1961, 83, 4560. 14. Clark, R. J. H.; Dines, T. J.; Angew. Chem., Int. Ed.1986, 25,
131.
15. Miller, J. S.; Angew. Chem., Int. Ed.2006, 45, 2508. 16. Stires, J. C.; McLaurin, E. J.; Kubiak, C. P.; Chem. Commun.
2005, 3532.
17. Isaacs, N. S.; J. Chem. Soc. B1966, 1053.
18. Monezi, N. M. A.; Ando, R. A.; J. Raman Spectrosc.2017, 48, 758.
19. Liao, M. S.; Lu, Y.; Parker, V. D.; Scheiner, S.; J. Phys. Chem.
A2003, 107, 8939.
20. Kysel, O.; Budzak, S.; Mach, P.; Medved, M.; Int. J. Quantum
Chem.2010, 110, 1712.
21. Silverstein, D. W.; Jensen, L.; J. Chem. Theory Comput.2010,
6, 2845.
22. Kuchenbecker, D.; Jansen, G.; ChemPhysChem2012, 13, 2769. 23. Grimme, S.; J. Comput. Chem.2006, 27, 1787.
24. Stratmann, R. E.; Scuseria, G. E.; Frisch, M. J.; J. Chem. Phys.
1998, 109, 8218.
25. Marenich, A. V.; Cramer, C. J.; Truhlar, D. G.; J. Phys. Chem.
B2009, 113, 6378.
26. Jamroz, M. H.; Spectrochim. Acta, Part A2013, 114, 220. 27. Glendening, E. D.; Landis, C. R.; Weinhold, F.; Wiley
28. Frisch, M. J.; Trucks, G. W.; Schlegel, H. B.; Scuseria, G. E.; Robb, M. A.; Cheeseman, J. R.; Scalmani, G.; Barone, V.; Mennucci, B.; Petersson, G. A.; Nakatsuji, H.; Caricato, M.; Li, X.; Hratchian, H. P.; Izmaylov, A. F.; Bloino, J.; Zheng, G.; Sonnenberg, J. L.; Hada, M.; Ehara, M.; Toyota, K.; Fukuda, R.; Hasegawa, J.; Ishida, M.; Nakajima, T.; Honda, Y.; Kitao, O.; Nakai, H.; Vreven, T.; Montgomery Jr., J. A.; Peralta, J. E.; Ogliaro, F.; Bearpark, M. J.; Heyd, J.; Brothers, E. N.; Kudin, K. N.; Staroverov, V. N.; Kobayashi, R.; Normand, J.; Raghavachari, K.; Rendell, A. P.; Burant, J. C.; Iyengar, S. S.; Tomasi, J.; Cossi, M.; Rega, N.; Millam, N. J.; Klene, M.; Knox, J. E.; Cross, J. B.; Bakken, V.; Adamo, C.; Jaramillo, J.; Gomperts, R.; Stratmann, R. E.; Yazyev, O.; Austin, A. J.; Cammi, R.; Pomelli, C.; Ochterski, J. W.; Martin, R. L.; Morokuma, K.; Zakrzewski, V. G.; Voth, G. A.; Salvador, P.; Dannenberg, J. J.; Dapprich, S.; Daniels, A. D.; Farkas, Ö.; Foresman, J. B.; Ortiz, J. V.; Cioslowski, J.; Fox, D. J.; Gaussian
09 ed.; Gaussian, Inc.: Wallingford, CT, USA, 2009.
29. Dreuw, A.; Head-Gordon, M.; J. Am. Chem. Soc.2004, 126, 4007.
30. Grimme, S.; Antony, J.; Ehrlich, S.; Krieg, H.; J. Chem. Phys.
2010, 132, 19.
31. Chan, R. K.; Liao, S. C.; Can. J. Chem.1970, 48, 299. 32. CRC Handbook of Chemistry and Physics; 90th ed.; Lide, D.
R., ed.; Taylor and Francis: Boca Raton, FL, 2009.
33. Miller, F. A.; Sala, O.; Devlin, J. P.; Overend, J.; Lippert, E.; Lunder, W.; Moser, J.; Varchim, J.; Spectrochim. Acta1964, 20, 1233.
34. Farrell, P. G.; Ngo, P.; J. Chem. Soc., Perkin Trans. 21973, 974. 35. Jeanmaire, D. L.; Suchanski, M. R.; Vanduyne, R. P.; J. Am.
Chem. Soc.1975, 97, 1699.
Submitted: October 21, 2016