A
R
T
IG
Prevalence of Vocal Problems in
Portuguese Primary and Secondary
School Level Teachers
Ana. P. Mendes*
Luis Salema**
Américo Rodrigues**
Iolanda Conceição*** Íris Bonança***
Margarida Santos***
Abstract
This study compared the prevalence of vocal problems in two Portuguese groups: 73 teachers that use their voice as professional tool (teachers’ group) and 73 non-voice professionals (control group). It also identiied the risk factors that contributed to teachers’ group voice problems. A questionnaire was applied to both goups in order to obtain information about vocal health, hygiene and behavior, profes-sional activity and general physical health. Statistical results revealed that the teachers’ group presented a higher prevalence of vocal problems than the control group: 52% reported hoarseness, 46.6% vocal fatigue and 45.2% vocal discomfort compared with 31.5%, 20.5 % e 28.7%, respectively. Environmental factors (eg., smoke and cold temperatures), vocal abuse and upper respiratory pathologies (e.g., colds, laryngitis and pharyngitis) seemed to increase teachers’ voice disorders (p-value < .05). In conclusion, the absence of vocal pedagogy in the curricular plan of teachers’ higher education associated to poor working environmental conditions and professional voice demands explained the higher prevalence of vocal problems in teachers’ group.
Keywords: prevalence, vocal problems, teachers, portuguese.
Resumo
Este estudo avalia e compara a prevalência dos problemas vocais em dois grupos: 73 professores que usam a sua voz como ferramenta proissional (grupo experimental) e 73 sujeitos que não usam, prois-sionalmente, a voz (grupo de controlo). Foram também identiicados os fatores de risco dos problemas vocais. Foi aplicado um questionário a ambos os grupos no sentido de obter informação sobre compor-tamento e higiene vocais, atividade proissional e saúde geral. Os resultados estatísticos revelaram que o grupo dos professores apresentou maior prevalência de problemas vocais que o grupo controle: 52% reportaram rouquidão, 46,6% fadiga vocal e 45,2% desconforto vocal, comparados com 31,5%, 20,5% e 28,7%, respectivamente. Fatores ambientais, tais como fumo e frio, abuso vocal e patologias do trato respiratório superior, tais como constipações, laringites ou faringites foram considerados como fatores de risco dos problemas vocais dos professores (p-value < 0.05). Concluí-se que a ausência de técnica vocal
A
R
T
IG
O
no plano curricular da formação acadêmica de professores, associada às fracas condições ambientais detrabalho e à exigência vocal da atividade proissional justiicam a prevalência das perturbações vocais, entre os professores.
Palavras-chave:prevalência, problemas vocais, professores, portugueses
Resumen
Este estudio evalua y compara la prevalencia de los problemas vocales en dos grupos: 73 profe-sores que usan su voz como herramienta profesional (grupo experimental) y 73 sujetos que no usan, profesionalmente, la voz (grupo de control). Han sido también identiicados los factores de riesgo de los problemas vocales. Ha sido aplicada una encuesta a ambos grupos para obtener informaciones sobre comportamiento e higiene vocales, actividade profesional y salud general. Los resultados estadísticos han revelado que el grupo de los profesores ha presentado una mayor prevalencia de problemas vocales que el grupo de control: el 52% ha referido ronquera, el 46,6% fatiga vocal y el 45,2% malestar vocal, comparados con el 31,5%, el 20,5% y 28,7%, respectivamente. Factores ambientales, como humo y frio, abuso vocal y patologías del trato respiratorio superior, como constipaciones, laringitis o faringitis han sido considerados como factores de riesgo de los problemas vocales de los profesores (p-value < 0.05). Se concluye que, la ausencia de técnica vocal en el plan curricular de la formación académica de los profesores, asociada a las débiles condiciones ambientales de trabajo y a la exigencia vocal de la actividad profesional, justiican la prevalencia de las perturbaciones vocales, entre los profesores.
Palabras claves:prevalencia, problemas vocales, profesores, portugueses
et al, 2006; Motta et al, 2004; Roy et al, 2004; Roy, 2005; Sliwinska-Kowalska et al, 2006; Thomas et al, 2006). In the presence of one or several symp-toms referred above, the diagnosis of dysphonia is applied. Dysphonia may result from lesions such as nodules (the most common laryngeal growth), polyps and edema of vocal folds (Brum, 2004).
Brazilian Laryngology and Voice Academy revealed that 2% of Brazilian teachers present vo-cal disturbances, which compel them to take other educational tasks besides lecturing (Brum, 2004). USA studies reported that 43% of teachers redu-ced their lecturing activity and 18% were absent from work due to vocal problems. 11% of the 3.3 million American teachers referred constant vocal complaints and 58% experienced vocal problems during their career (Roy, 2005). Vocal complaints from American teachers were more than double when compared with other professional groups: 67% versus 33% (Smith et al, 1997). In spite of the research methodology used to study teachers’ vocal problems, the literature review reveals that vocal disorders prevail in this professional group (Brum, 2004; de Jong, 2006; Dragone et al, 1999; Guimarães, 2004; Kooijman et al, 2006; Motta et
Introduction
Vocal problems compromise the communica-tive eficiency of those whose voice is their main professional tool. The biggest voice professional group in this situation is the group of teachers (Brum, 2004; de Jong, 2006; Dragone et al, 1999; Guimarães, 2004; Kooijman et al, 2006; Motta et al, 2004; Roy et al, 2004; Roy, 2005; Sliwinska-Kowalska et al, 2006; Thomas et al, 2006). Tea-chers use their voice for several hours during their working day. However, the majority of them are not familiar with the phonation mechanisms involved for voice production. Furthermore, teachers are fre-quently known to have vocal misuse and abuse (ie., they tend to speak with strong intensity in order to be heard over the classroom noise, drink few liquids and have inadequate breathing patterns) and this is relected on the quality of their communication in the classroom (Brum, 2004; Dragone et al, 1999; Motta et al, 2004).
A
R
T
IG
O
al, 2004; Roy et al, 2004; Roy, 2005; Sliwinska-Kowalska et al, 2006; Thomas et al, 2006; Smith et al, 1997). From a clinical point of view, teachers were among the top ten professions who most fre-quently seek solutions for vocal problems (Smith et al, 1997; Cooper, 1977; Herrington-Hall et al, 1988; Fritzell, 1996).
Portuguese comparative studies revealed that teachers’ group prevailed as the one who presented the most vocal complaints and was among the top four professions in which presented dysphonia without laryngeal alterations. Questionnaires revealed the percentage of vocal problems as: 1) 20% of 61 teachers (Guimarães, Cruz, 1997), 2) 54% of 48 primary-level school teachers (Ferreira, 2003) and 3) 40% and 47% of 32 itness teachers (Larcher, 2002).
The present study’s main objective was to eva-luate and compare the prevalence of vocal problems in two groups: a group of 73 primary and secondary level school teachers and a control group composed of 73 subjects who were not teachers nor used their voice professionally. Secondary objectives were to identify vocal problems in teachers and potential risk factors.
Method
Subjects
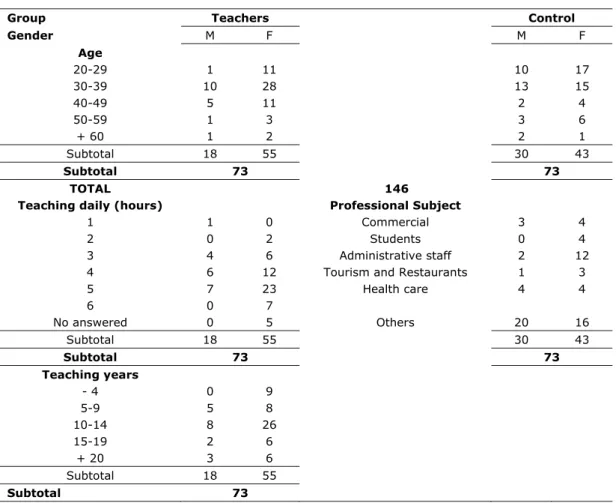
146 subjects participated in this study and were divided into two groups: a group of teachers and a control group. Each group had 73 subjects. Teachers’ group had 18 males and 55 females, with 52.1% ranging between 30 and 39 years old. Teachers were from 12 different schools and taught at the following levels: 8 (11%) were on primary- school-level; 9 (12.3%) were on secondary-school-level General Certiicate of Secondary Education (GCSE) level; 18 (24,7%) were on secondary A-level; 32 (43,8%) were on secondary school GCSE level and on the secondary A-level; and lastly, 6 teachers (8,2%) did not indicate the level, although the courses’ designation allowed one to induce that they either taught at Secondary School GCSE level or at the Secondary A-level.
17,8% of teachers had 5 to 9 years of teaching experience and 46,6% had 10 to 14 years. Each teacher taught an average of 4.4 ± 1.05 hours a day. The control group included 31 males and 42 females, with 38,5% ranging between 30 and 39 years old. Subjects had several different professions
and none of them required voice use as a profes-sional tool. Their jobs were mostly secretaries, administrative assistants and clerks.
Due to cost efficiency and accessibility reasons, 8 Portuguese geographic regions were selected for data collection, for both groups. They were: Aveiro, Castelo de Paiva, Estremoz, Guarda, Lamego, Ovar, Seixal and Vila Nova de Famalicão. Subjects’ characteristics were included in Table 1.
Instruments
Two questionnaires were developed, one for the teachers’ group and another for the control group. The questionnaires collected data on vocal health, hygiene and behavior, professional activi-ty and general physical health. They speciically included four main sections: 1) socio-professional characterization, 2) vocal symptoms and signs, 3) consequences of the voice disorders and 4) poten-tial risk factors of the voice disorders.
Questionnaires were designed based on Roy’s studies (Roy et al, 2004; Roy, 2005). Most ques-. Most ques-Most ques-tions required a dichotomic yes/no answer, how-ever at the end written remarks could be included. Complementary questions were included for form and content adaptation to the Portuguese reality.
A Likert scale, from 1 to 5, was used to obtain the frequency of vocal symptoms or signs. The scale could be rated as follow: 1) “never”, 2) “once”, 3) “rarely”, 4) “sometimes” and 5) “frequently”. The voice signs and symptoms correspond to those referred in the literature (i.e. hoarseness, vocal fatigue, vocal strain, among others) (Brum, 2004; de Jong, 2006; Dragone et al, 1999; Guimarães, 2004; Kooijman et al, 2006; Motta et al, 2004; Roy et al, 2004; Roy, 2005; Sliwinska-Kowalska et al, 2006; Thomas et al, 2006; Roque, 1999; Behlau, 2001; Colton, Casper, 1996). New items were included in order to allow subjects to insert other voice problems or different ways of solving them. Technical and scientiic terminologies were avoided to ensure greater success rate.
Control group’s questionnaire didn’t present questions about teaching but included questions about job’s type and description.
A
R
T
IG
O
control group. General health questions were added about respiratory system, medication and chronic health problems.
Procedures
146 questionnaires were personally handed out and collected. The return rate of both questionnaires was 100%.
Statistical analysis
Data was analyzed using the Statistical Pa-ckage for Social Sciences (SPSS) – version 11.5. Boxplots were used to observe the differences of the vocal symptoms between the two groups. The mode and the median values were found to be the most adequate values to obtain their frequency using a Likert scale. The end points of the boxplots went from the highest to the lowest expected value, up to 1.5 of the boxplot length. Each boxplot, started
from 25 up to 75 percentile with the thickest line indicating the median value according to the scale in use. The isolated values are shown with the symbol (*).
The variables’ frequencies were obtained to visualize the most relevant features of the sample. Furthermore, a relationship between the most rel-evant variables was still established and as well as the statistical values of p < .05 to be statistically signiicant. The mentioned p-values, resulted from the χ2 Pearson Test application. The answers related
to the vocal symptoms or signs were dichotomized in order to satisfy the theoretical assumptions related to the χ2 Pearson Test application. All
an-swers “never” or “once” regarding one of the vocal symptoms were grouped into one single category, which was categorized as the number 1. All answers “rarely”, “sometimes” and “frequently” were also grouped into one category as number 2. The same procedures were done for potential risk factors of
Group Teachers Control
Gender M F M F
Age
20-29 1 11 10 17
30-39 10 28 13 15
40-49 5 11 2 4
50-59 1 3 3 6
+ 60 1 2 2 1
Subtotal 18 55 30 43
Subtotal 73 73
TOTAL 146
Teaching daily (hours) Professional Subject
1 1 0 Commercial 3 4
2 0 2 Students 0 4
3 4 6 Administrative staff 2 12
4 6 12 Tourism and Restaurants 1 3
5 7 23 Health care 4 4
6 0 7
No answered 0 5 Others 20 16
Subtotal 18 55 30 43
Subtotal 73 73
Teaching years
- 4 0 9
5-9 5 8
10-14 8 26
15-19 2 6
+ 20 3 6
Subtotal 18 55
Subtotal 73
A
R
T
IG
O
voice disorders, speciically in question 4 of sec-tion D (ie., Indicate how often you usually have the following health problems: Cold; Laryngitis; Pharyngitis). The answers were dichotomized in the following way: “never” with number 1, and all the other options (“rarely”, “sometimes”, and “fre-quently”) were coded with number 2. The question-naire variables that have not been mentioned in the results section did not achieve statistical signiicant.
Results
Prevalence of voice problems
The prevalence of voice problems was higher for the teachers’ group than for the control group. The teachers’s group presented a median frequency of 4 (“sometimes”) for voice symptoms as opposed to the control group which presented a median frequency of 3 (“rarely”). Figure 1 shows the voice symptoms frequency for both groups. Some teachers did not ill-in all the listed symptoms,
as a consequence the number of answers varied (i.e., N). For the symptom dry throat the teachers’ group registered an isolated value, indicated by (*), revealing an outlier, ie., subject 42 answered never having felt this symptom - frequency was of level 1 (“never”).
Teachers’ group presented high median fre-quencies voice symptoms, such as: hoarseness, vocal fatigue and vocal discomfort. 52% of the teachers reported hoarseness, 46,6% vocal fatigue and 45,2% vocal discomfort, comparatively to 31,5%, 20,5% and 28,7% reported by the control group, respectively. Vocal fatigue and vocal dis-comfort showed a median frequency always higher or equivalent to 3 (“rarely”) and with reduced variability. Hoarseness, vocal strain, voice loss and dificulty to project voice were symptoms that showed higher median frequencies for the teachers’ group. The majority of the teachers referred indexes from 3 to 5 (i.e., from “rarely” to “frequently” respectively).
73
71 73
71 73
71 73
70 73
70 72
68 73
72 N =
Symptoms or signs of vocal problems
control teachers
Fr
eq
ue
nc
y
in
de
x
6
5
4
3
2
1
0
Hoarseness
Vocal f atigue
Vocal discomf ort
Tension when speak.
Dry throat
Loss of v ocal range
Dif . project. v oice
42
A
R
T
IG
O
The control group presented a highervari-ability and asymmetry of values than the teachers’ group. Figure 1 presents wider boxplots for the control group than for the teachers´ group. The median frequency of the voice symptoms was lower when compared with the teachers group, 3 and 4, respectively. The median frequency for all voice symptoms was 3 (“rarely”) or lower. For symptoms vocal fatigue, vocal loss and dificulty to project the voice, 75% of the control group showed lower median frequencies (correspondent to level 3 – “rarely” – or less) than the teachers’ group. Only the dry throat symptom showed the same median frequency for both groups (“frequently”).
In order to verify if there was signiicant as-sociation between each vocal symptom and the type of profession the χ2 Pearson Test was
per-formed. Profession was signiicantly associated with hoarseness, (χ2 = 12, 216; p = 0,016), with
vocal fatigue, (χ 2= 36, 471; p = 0,000), with vocal
discomfort, (χ 2 = 21,613; p = 0,000), with throat
clear, (χ 2= 20,261; p = 0,000), with vocal loss,
(χ 2= 16, 240, p = 0,003), and with the dificulty in
projecting voice, (χ 2= 19,048; p = 0,001).
Due to the high prevalence of voice symptom s among the teachers’ group, when compared with the control group, it was important to identify the causes or the potential risk factors that may induce or perpetuate such symptoms (i.e., vocal behaviors, environmental conditions and general health state).
Potential risk factors of voice problems
Six potential risk factors were signiicantly different between the two groups (p <.05). They were: 1) environmental noise, 2) cold temperatures, 3) dust, 4) loud talk, 5) tea consumption, and 6) smoking. Table 2 shows the statistical results of the potential risk factors. 65.8 % of the teach-ers’ group were expose to environmental noise compared with 35.6% of the control group, (χ2:1,
N = 48; 13.3, p = 0,000). 56.2% of teachers reported cold temperatures in working place, vs. 30.1% of the control group, (χ2:1, N = 41; 10.1, p = 0,001).
58.9% of teachers reported dust in the working place against 37% of the control group, (χ 2:1,
N = 43; 7.0, p = 0,008).
Three vocal behaviors were studied as potential risk factors: fast talk, loud talk and talk too much. Only loud talk showed a signiicant difference be-tween the two groups. 72.6% of teachers reported loud talk, against 30.1% of the control group (χ 2:1,
N = 53; 26,3, p = 0,000).
For the individual intrinsic factors, tea con-sumption presented a signiicant difference between the two groups, with higher values for teachers’ group compared with control group (ie., 64.4% against 45.2%, respectively), χ2:1, N = 47; 5.4;
p = 0,020). Smoking habit was the only potential risk factor signiicantly higher for the control group than for the teachers’ group (ie., 35.6% against 16.4%, respectively), χ 2:1, N = 26; 6,9; p = 0,008).
To investigate other factors that might contrib-ute to the prevalence of voice problems, among the teachers’ group, the working environment conditions and the voice symptoms or signs were crossed. The χ 2 Test was run with each working
environment conditions and vocal symptoms to see if they were associated for the teachers’ group. Considering only the teachers group, the following variables were signiicantly associated cold temperatures and voice tremor (χ 2 = 4,219;
p = 0,040), cold temperatures and neck pain (χ 2 =
8,213; p = 0,004), presence of chemical products at the working place and shortage air (χ2 = 3,896;
p = 0,048), humidity and throat clear (χ2 = 5,507;
p = 0,019), smoke and excessive throat secretions (χ2 = 3,924; p = 0,048), and lastly, smoke and
short-age air (χ2 = 3,917; p = 0,048).
Clinical history of respiratory pathologies was signiicantly associated to voice symptoms. Colds, laryngitis and pharyngitis showed signiicant as-sociations with most voice symptoms, especially for the teachers group. Asthma was signiicantly associated with the excessive throat secretions for the teachers’ group, (χ2 = 5,018; p = 0,025). Table
3 shows the χ 2 Pearson test results. The association
between the variables years of teaching and number of daily teaching hours to each of the voice symp-toms did not show a signiicant statistical result.
Other results
66.7% of the teachers’ group revealed changing classroom activities and 38.4 % missed work due to vocal problems. 16.4% of the teachers received speciic training on how to use their voice. 4.1%, from these 16.4%, obtained this information during their teaching curriculum and all others throughout their continuum education programs.
A
R
T
IG
O
Potential risk factors Teachers Control χ2 df p-value
N % N %
Respiratory allergies Yes
No 33 36 47,8 52,2 23 45 33,8 66,2
2,8 1 0,096
Asthma Yes
No 52 7 11,9 88,1 55 9 14,1 85,9
0,1 1 0,717
Colds Never Rarely Sometimes Frequently
0 19 38 15
0 16,4 52,8 20,8
1 29 36 7
1,4 39,7 49,3 9,6
6,0 3 0,110
Smoking Yes
No 12 61 16,4 83,6 26 47 35,6 64,4
6,9 1 0,008*
Alcohol Yes
No 65 8 11 89 16 57 21,9 78,1
3,2 1 0,074
Drinking coffee Yes
No 48 25 65,8 34,2 57 16 78,1 21,9 2,7 1
0,097
Drinking tea Yes
No 47 26 64,4 35,6 33 40 45,2 54,8 5,4 1
0,020*
Interior noise Yes
No 48 25 65,8 34,2 26 47 35,6 64,4 13,3 1
0,000*
Cold Yes
No 41 32 56,2 43,8 22 51 30,1 69,9 10,1 1
0,001*
Dust Yes
No 43 30 58,9 41,1 27 46 37 63 7,0 1
0,008*
Fast talk Yes
No 31 42 42,5 57,5 25 48 34,2 65,8 1,0 1
0,307
Loud talk Yes
No 53 20 72,6 27,4 22 51 30,1 69,9 26,3 1
0,000*
Talk too much Yes
No 29 44 39,7 60,3 20 53 27,4 72,6 2,5 1
0,115
Table 2 – Results for potential risk factors among the teacher’s group and the control group (c2 Pearson’s test)
A
R
T
IG
O
Discussion
The main objective of this work was to com-pare the prevalence of voice problems between two Portuguese groups: primary and secondary school level teachers’ group and a control group. Results revealed that the teachers’ group presented a higher
prevalence of vocal problems than the control group. Hoarseness, vocal fatigue and discomfort were the voice symptoms most frequently referred by the teachers’ group: 52%, 46.6% and 45.2%, compared with 31.5%, 20.5% and 28.7% reported by the control group. Throat clear, loss of voice and dificulty to project it, were symptoms signiicantly Symptoms
Patology
Cold p-value
Laryngitis p-value
Pharyngitis p-value
Hoarseness Teachers
Control group 0,009* 0,461 0,000* 0,052 0,008* 0,066
Vocal fatigue Teachers
Control group 0,049* 0,338 0,076 0,074 0,045* 0,358
Discomfort related to voice Teachers
Control group 0,007* 0,002* 0,016* 0,053 0,243 0,105
Monotonous voice Teachers
Control group 0,067 0,846 0,038* 0,190 0,002* 0,812
Speech tension Teachers
Control group 0,085 0,734 0,010* 0,426 0,079 0,098
Shortage air Teachers
Control group 0,044* 0,209 0,110 0,258 0,014* 0,924
Throat clearing the voice Teachers
Control group 0,005* 0,521 0,028* 0,151 0,002* 0,411
Dry throat Teachers
Control group 0,194 0,514 0,017* 0,964 0,006* 0,832
Excessive throat secretions Teachers
Control group 0,010*0,519 0,048* 0,004* 0,001* 0,221
Neck pain Teachers
Control group 0,007* 0,055 0,016* 0,207 0,062 0,120
Shoulder pain Teachers
Control group 0,034* 0,103 0,220 0,068 0,030* 0,356
Trembled voice Teachers
Control group 0,012* 0,082 0,023* 0,061 0,053 0,214
Loss of voice reach Teachers
Control group 0,016* 0,096 0,020* 0,061 0,013* 0,041*
Difficulty projecting voice Teachers
Control group 0,010* 0,237 0,004* 0,492 0,010* 0,812
A
R
T
IG
O
associated with the academic profession. These voice symptoms were also reported by the teachers’ group to be a consequence of the intrinsic demands of their profession.
The prevalence of this symptomatology may be associated with voice demands of teachers in order to reach a large group of students. The classroom noise level leads teachers to talk with a strong vocal intensity ranging between 58 and 78 dB (Kooijman et al, 2006; Vilkman, 2000). These factors associa-ted with the absence or incorrect vocal technique, vocal misuse, deicient acoustic and environmental conditions of some schools, justify the higher pre-valence of voice problems in the teachers group (Brum, 2004; de Jong, 2006; Dragone et al, 1999; Guimarães, 2004; Kooijman et al, 2006; Motta et al, 2004; Roy et al, 2004; Sliwinska-Kowalska et al, 2006; Thomas et al, 2006; Larcher, 2002; Morton, Watson, 1998).
There are several intrinsic and extrinsic etio-logical factors that can contribute to the higher prevalence of voice problems in teachers’ group. Potential risk factors such as environmental noise, cold temperatures, dust, tea consumption and loud talk were signiicantly higher for teachers’ group than for the control group. 56.2% and 58.9% of the teachers reported cold temperatures and dusty environments, respectively. These two factors were signiicantly different between the two groups (p = 0,001 and 0,008, respectively). The dust from the chalk causes a dry atmosphere and irritability of the vocal folds’ mucous membrane (Sliwinska-Kowalska et al, 2006). The teachers should not talk when writing or cleaning the blackboard avoiding dust exposition and also should project the voice towards the students (Brum, 2004). Furthermore, teachers should use a more nasal than oral brea-thing, in order to iltrate, warm and humidify the inhaled air. This breathing pattern can be used as a defense strategy against cold temperatures, dry and dusty air, which characterized the working environment conditions of many teachers.
Tea consumption was other potential risk factor signiicantly higher for the teachers’ group (p = 0,020). Black tea and coffee have diuretic properties contributing to dehydration and causing dry mouth, throat clearing and/or cough (Guima-rães, 2004), vocal behaviors also reported by the teachers’ group. In order to keep a healthy voice, one needs to have vocal hygiene habits. Drinking water is the best way to maintain a good general
hydration level including the vocal system. The adult vocal folds’ vibration during phonation is 100 to 250 cycles/second, demanding the mucous membrane to be hydrated and reducing attrition. Only 38.4% of the teachers’ group reported to have water drinking habits.
Teachers’ group reported a daily average of teaching hours of 4 to 5. This variable was signi-icantly associated with vocal symptoms such as hoarseness, vocal fatigue, and others. The results of this comparative study were in agreement with the previous international investigations (Dragone et al, 1999; Kooijman et al, 2006) and conirmed that the symptom vocal fatigue was associated with vocal misuse and not with the number of hours of use. This leads to the importance of the vocal pedagogy for these voice professionals. 83.6% of the teachers’ group did not have any education about vocal technique usage, which explained the reported vocal misuse and abuse behaviors: 72.6% spoke loudly, 42.5% spoke fast and 39.7% spoke too much. The generalized absence of vocal pedagogy among teachers was also conirmed in other studies. Arnoux-Sindt et al. (Larcher, 2002) reported that 63.4% of the teachers did not have any information on voice production, basic principles on vocal hygiene, voice problems prevention and vocal quality optimization. Teachers have dificulty in identifying vocal misuse and abuse behaviors and understand the consequences of voice problems. A teacher, who feels pains or throat irritation, tends to adopt strategies that perpetuate the vocal effort, aggravating the existing problems. Therefore, vocal technique knowledge seems to be essential to the teacher’s performance in order to prevent voice or other health problems and maximize vocal quality and endurance. These competencies should be tau-ght during the teacher’s curricular plan and before the internships.
There were working environmental condi-tions that were signiicantly associated with voice symptoms: 1) cold temperature and voice tremor, 2) cold temperatures and neck pain, 3) smoke and excessive throat secretions, 4) smoke and shortage air, 5) presence of chemical products and shortage air and 6) humidity and throat clearing. Some of these conditions were also conirmed by others (Thomas et al, 2006) as favorable to the occurrence of voice problems.
A
R
T
IG
O
problems. Table 3 shows the association betweenthese respiratory problems and voice symptoms. The teachers’ group presented more signiicantly associated respiratory pathologies with voice symptoms than the control group. These patho-logies cause edema of the respiratory and vocal tract mucous membrane leaving the vocal folds more sensitive (Brum, 2004). Arnoux-Sindt et al. (Motta et al, 2004) evaluated laryngoscopically 256 teachers, with voice problems. 34.4% of them pre-sented laryngeal pathology. Le Huchee and Allali (1990) studied 73 cases and revealed that teachers presented a bigger incidence of vocal nodules.
The impact of vocal problems, in the teachers’ professional life was absenteeism and limitations of their professional decisions as well as options. According to Sapir, Keidar and Mathers-Schimdt (Morton, Watson, 1998), 9% of the teachers related that voice problems were the reason for stress and frustration; and 21% pointed out that these proble-ms interfere with professional activity. Present stu-dy revealed that 66,7% of teachers’ group changed their classroom activities and 38,4% missed work due to vocal problems.
This study reveals that Portuguese primary and secondary school level teachers presented a higher prevalence of voice problems than control group. This was the result of a multifactorial analysis, as underlined by several previous international studies on this thematic resulting from the interaction of the working environmental conditions with the vocal misuse and abuse behaviors as well as general physical health. The teachers’ voice symptoms can result from a multiplicity of factors and, therefore, the diagnosis of the voice problems implies several factors in order to achieve the best treatment.
Conclusion
The results from this study revealed that the teachers’ group presented a higher prevalence of voice symptoms than the control group composed by non-voice professional subjects. All voice symp-toms presented a higher frequency in the teachers’ group than in the control group.
Cold temperatures, noisy and dusty classrooms were statistically signiicant working environmen-tal factors that can affect the vocal quality. They can also be potential risk factors of respiratory or laryngeal pathologies, which affect the vocal tract function and ultimately voice production. The
high number of students per classroom increases the environmental noise and the vocal demands as well as vocal effort of the teachers.
In the present study working environmental factors seem to assume a relevant importance in the etiology of voice problems. The percentage of teachers that reported noise, cold temperature and dust in the classroom (65.8%, 56.2% and 58.9%, respectively) was near the percentage of teachers that reported hoarseness (65.7%), vocal fatigue (65.8%) and vocal discomfort (60.2%). These working environmental conditions precipitate vocal misuse and abuse behaviors. Consequently, they precipitate voice problems and affect the level of the teaching praxis. The high percentage of teachers that modiied classroom activities and the high absenteeism, caused by the voice problems, are, equally, consequences that help us understand the dimension of this issue.
In conclusion, the prevalence of the voice problems, among teachers, seems to result from a multiplicity of factors. The vocal misuse and abuse (loud talk, inadequate respiratory patterns), the working environmental conditions of the school and the general health of the teacher concur to the appearance of voice problems. The environmental conditions precipitate certain behaviors placing vocal health at risk. These factors can also be associated to the emotional factors (Kooijman et al, 2006; Sliwinska-Kowalska et al, 2006; Thomas et al, 2006) (professional instability, indiscipline, the constant curricular and legislative changes at school level).
A
R
T
IG
O
The work carried out points to the need of pre-vention programs on voice problems for teachers. At a moment in which the academic training of teachers is being reconsidered under the light of the Bologna process, it is important to consider the existence of a course concerned with vocal pedagogy and technique in initial teacher training curriculum.
Acknowledgements
The authors wish to thank Ana Catarina Mateus, Ana Cristina Martins, Carolina Santos, Cláudia Silveira, Maria Raquel Pinheiro and Ofé-lia Ferreira for their assistance in translation and editing support.
References
Brum DM. A voz do professor merece cuidados. Rev Textual [periódico na internet];2004 [acesso em 01 maio 2005];maio:14-18. Disponível em: http://www.saudeetrabalho.com.br/downlo-ad/voz-do-professor.pdf
De Jong FICRS, et al. Epidemiology of voice problems in Dutch teachers. Folia Phoniatr Logop 2006;58(3):186-98.
Dragone MLS, Nagano L, Behlau M. Visão atual sobre o proble-ma vocal do professor. Intercâmbio [periódico na internet];1999 [acesso em 01 maio 2005];8:39-48. Disponível em: http:// www2.lael.pucsp.br/~tony/intercambio_anteriores/08index.htm Guimarães I. Os problemas de voz nos professores: prevalência, causas, efeitos e formas de prevenção. Rev Port Saúde Publ 2004;22(2):33-41.
Kooijman PGC, et al. Risk factors for voice problems in tea-chers. Folia Phoniatr Logop 2006;58(3):159-74.
Motta AR, et al. Aspectos relacionados ao uso vocal em pro-fessoras de creches comunitárias de Belo Horizonte. In: Anais do 7º Encontro de Extensão da Universidade Federal de Minas Gerais [evento na internet]; 12-15 set 2004. Belo Horizonte, BR. Belo Horizonte: UFMG; 2004. [acesso em 03 maio 2005]. Disponível em: http://www.ufmg.br/proex/arquivos/7Encontro/ Trabalho25.pdf
Roy N et al. Prevalence of voice disorders in teachers and the general population. J Speech Lang Hear Res 2004;47(2):281-93. Roy N. Teachers with voice disorders: recent clinical trials research. ASHA 2005;10(5):8-10.
Sliwinska-Kowalska M, et al: The prevalence and risk factors for occupational voice disorders in teachers. Folia Phoniatr Logop 2006;58(2): 85-101.
Thomas G, et al. Prevalence of voice complaints, risk factors and impact of voice problems in female student teachers. Folia Phoniatr Logop 2006;58(2):65-84.
Smith E, et al. Frequency and effects of teachers’ voice proble-ms. J Voice 1997;11:81-7.
Cooper M. Modern techniques of vocal rehabilitation, 3.ed. Springield, GB: Charles Thomas; 1977.
Herrington-Hall B, et al. Description of laryngeal pathologies by age, sex, occupation in a treatment seeking sample. J Speech Hear Disord 1988; 53:57-64.
Fritzell B. Voice disorders and occupations. Logoped Phoniatr Vocol 1996;21:7-12.
Guimarães I, Cruz M. Prevenção vocal: uma experiência por-tuguesa. In: 3º Congresso Europeu do Comité Permanente de Ligação dos Terapeutas da Fala da União Européia; maio 1997. Lisboa, PO. Lisboa: CPLOL; 1997.
Ferreira R. Impacto psicossocial da voz em professores. Alcoi-tão, PO: Escola Superior de Saúde do Alcoitão; 2003. Larcher I. A utilização vocal em professores de itness. Alcoitão, PO: Escola Superior de Saúde do Alcoitão; 2002.
Roque L. Problemas vocais na proissão docente: uma proposta de formação no âmbito da voz. Porto, PO: Escola Superior de Tecnologia da Saúde do Porto; 1999.
Behlau M. Voz: o livro do especialista. Rio de Janeiro: Re-vinter; 2001.
Colton R, Casper J. Understanding voice problems: a physiolo-gical perspective for diagnosis and treatment. 2.ed. Baltimore, US: Williams & Wilkins; 1996.
Vilkman E. Voice problems at work: a challenge for occupa-tional safety and health arrangement. Folia Phoniatr Logop 2000;52:120-5.
Morton V, Watson D. The teaching voice: problems and percep-tions. Logoped Phoniatr Vocol 1998;23:133-9
Le Huche F, Allali A. La voix. Paris: Masson; 1990.
Recebido em novembro/09; aprovado em dezembro/09.
Endereço para correspondência Ana P. Mendes
Escola Superior de Saúde Instituto Politécnico de Setúbal Campus do IPS, Estefanilha 2914 - 503 Setúbal PORTUGAL