SIGNS AND SYMPTOMS OF THE AUTONOMIC
DYSFUNCTION IN TEACHERS
Sinais e sintomas da disfunção autônoma em professores
Carolina Farah Paes(1), Fabiana Copelli Zambon (2), Mara Behlau (3)
(1) Centro de Estudos da Voz - CEV, São Paulo, SP, Brazil.
teacher from São Paulo public schools showed relation between voice disorder and stress, due teachers in their own work environment to have a high psychic demand related to low control of their activities, which may make them susceptible to illness8.
Emotional disorders frequently cause autonomic dysfunction9. The autonomic nervous system (ANS)
is composed by two main types, sympathetic and parasympathetic, working coordinated and antago-nistic in order to regulate involuntary functions10.
It has central components as thalamus and limbic system, which are associated to emotions and visceral behavior. This system is responsible to
INTRODUCTION
Teachers have higher risk to develop voice disturb when compared to general population1,
which may inluence the professional performance2
and cause economic losses for these professionals and the educational system3.
The work environment in which the teacher acts may offer risk to development of voice distur-bances4-7. Besides the environment inluence, there
is the emotional factor involving the professional coping to stress situations at work. A study with
ABSTRACT
Purpose: to compare signs of general autonomic dysfunction related to the voice in teachers with and without complaints. Methods: adhibition of the Questionnaire of Autonomic Dysfunction (QAD) in 83 teachers, including 60 women and 23 men, with an average age of 37,6. The participants were
distributed in two groups, with or without voice complaints, deined according to number of symptoms
marked in the Protocol of Signs and Voices Symptoms. Results: the group with voice complaints presented an average of 13,7 symptoms in the QAD of autonomic dysfunction and the group without complaints 7,7 (p=0,001). Considering only voice related neurovegetative signs, the group with complaints presented an average of 4,7 symptoms and the group without complaints 1,8 (p<0,001). When compared to the group without voice complaints the most predominant voice related symptoms in the group with voice complaints were: fatigability when speaking (p<0,001), need of constantly swallowing (p=0,014), sore throat (p=0,001), neck pain while speaking (p=0,003), temporomandibular pain or discomfort (p=0,017), constant need to yawn (p=0,023), frequent throat clearing (p=0,010) and tension in the head while speaking (p=0,019). The symptoms observed in the group without complaints
were: nose obstruction (33,3%), dificulty breathing through the nose (29,2%) and sneezing (25%).
Conclusion: the group with voice complaints showed more number of neurovegetative symptoms, particularly on issues related to the voice, than the group without complaints.
women and 23 men, with mean age of 37.6 years, teaching at elementary or high schools of 6 schools (1 private and 5 public), from Rio de Janeiro city. A teacher of each school was previously trained to deliver the protocols of Vocal Signs and Symptoms (VSSQ)1,17 and Autonomic Dysfunction (QAD) to
the other teachers. All the subjects that accepted to participate of the research had to sign an informed consent term.
The sample was divided in two groups, according to the presence or absence of vocal complaint by the teacher. This division was done in two steps to evaluate the perception of the teacher to its own
complaint. In the irst step it was considered the
self-reported complaints with a closed-question
and two answer options (“yes” or “no”), regarding
the presence or absence of vocal complaints at that moment. In the second step it was considered the number of vocal symptoms observed in VSSQ, translated/adapted to Brazilian Portuguese17. The
mean of symptoms expected in Brazilian teachers is 3.717. Therefore, subjects having until three vocal
symptoms were included in the group without vocal complaint and the subjects with four or more symptoms were included in the group with vocal complaint.
With the purpose to observe the teacher´s perception regarding its own vocal complaint, self-reported complaint was compared to measured one (mean number of vocal symptoms presented at VSSQ). Statistical data were obtained based on measured complaint at VSSQ. After formatting the groups with and without vocal complaint, the focus of the research was to analyze QAD.
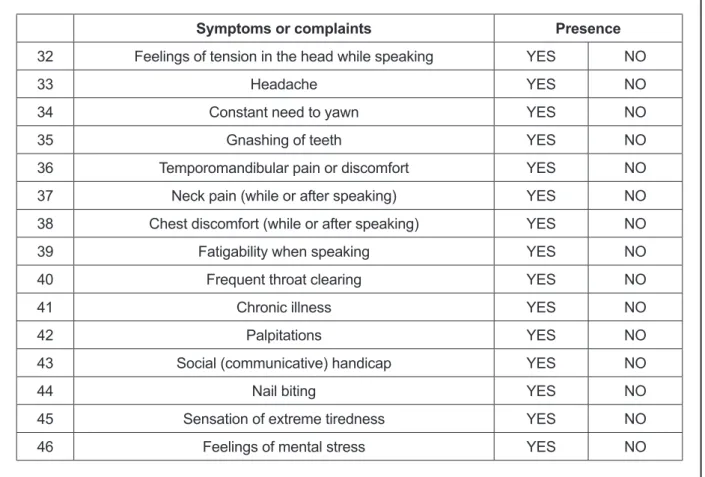
QAD is a list of 46 neurovegetative symptoms,
with “yes” or “no” response options, 22 are related
to ANS but without direct relation to voice, 16 are related to ANS and voice, 6 are not-relevant, that is, without relation with neurovegetative or voice aspects, and 2 are reliability questions, in order to evaluate the participant’s consistence in answering the questions15 (igure 1).
The statistical analysis was done using ANOVA
Test and the Kappa concordance coeficient. The
softwares used were SPSS V16, Minitab 15, and
Excel Ofice 2007. The signiicance level adopted
was 0.05 (5%). the body to activity and it acts to modulate the
organs functions as heart, gastro intestinal tract, and sweat glands. Besides, it increases the body activities to assure the body may respond to stress. The parasympathetic system has the antagonist function, decreasing body activities, in order to restore energy10. Voice has the role to express
emotion (barometer of emotion) and there for the voice disturbance may be interpreted as stress sign12.
Besides voice, mental and behavior distur-bances, gastric and cardiovascular dysfunctions are related to organization factors13. Stress, anxiety,
and depression may appear in patients with vocal folds lesions, paradoxical vocal fold disorder, and muscle-tension dysphonia14. In females, functional
dysphonia may be a manifestation of stress and anxiety, with hyperactivity of ANS11. Patients with
behavioral dysphonia have higher occurrence of neurovegetative symptoms15.
The Questionnaire of Autonomic Dysfunction (QAD) was used in some researches to quantify the number of neurovegetative symptoms in subjects with dysphonia compared to subjects without voice disturbances11,15,16, without reporting the profession
of participants. The QAD was developed initially in a research performed in Utrecht University, Netherlands, in order to relate functional dysphonia and ANS dysfunction11. After, it was translated/
adapted to Brazilian Portuguese in the research relating behavioral dysphonia with nerovegetative symptoms15.
Considering teachers are professionals that have risks to develop voice disorders and stress, the purpose of this research is to compare the autonomic dysfunction signs in teacher with and
without vocal complaints, deined by clinical inves -tigation, using QAD.
METHODS
This research was evaluated and approved by Ethical in Research Committee of Centro de Estudos da Voz (CEV), under the protocol number 0417/09.
Name:_______________________________________________________date:_______________
Mark the symptoms or complaints that you have been feeling lately. There is no right or wrong answers.
Symptoms or complaints Presence
1 Cold hands YES NO
2 Cold feet YES NO
3 Excessive transpiration YES NO
4 Excessive sensitiveness to coldness YES NO
5 Excessive sensitiveness to heat YES NO
6 Diarrhea YES NO
7 Constipation YES NO
8 Pufiness YES NO
9 Aerophagia YES NO
10 Nausea YES NO
11 Lack of appetite YES NO
12 Eructations YES NO
13 Hiccups YES NO
14 Heartburn YES NO
15 Dizziness YES NO
16 Tinnitus YES NO
17 Dancing spots before the eyes YES NO
18 Dificult concentration YES NO
19 Disturbed sleep YES NO
20 Lack of energy YES NO
21 Feelings of psychic tension YES NO
22 Renal problems YES NO
23 Need ofconstantly swallowing YES NO
24 Sore throat YES NO
25 Hyperventilation YES NO
26 Speciic allergy YES NO
27 Frequent sneezing YES NO
Symptoms or complaints Presence
32 Feelings of tension in the head while speaking YES NO
33 Headache YES NO
34 Constant need to yawn YES NO
35 Gnashing of teeth YES NO
36 Temporomandibular pain or discomfort YES NO
37 Neck pain (while or after speaking) YES NO
38 Chest discomfort (while or after speaking) YES NO
39 Fatigability when speaking YES NO
40 Frequent throat clearing YES NO
41 Chronic illness YES NO
42 Palpitations YES NO
43 Social (communicative) handicap YES NO
44 Nail biting YES NO
45 Sensation of extreme tiredness YES NO
46 Feelings of mental stress YES NO
RESULTS
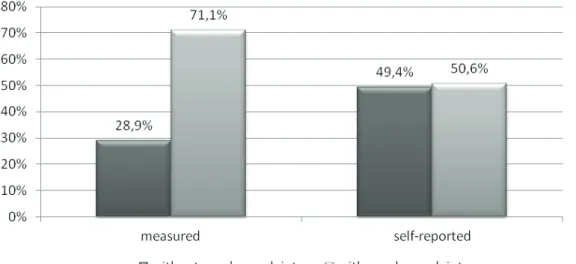
Analyzing the perception of vocal complaint report by the teacher, it was observed that 42
subjects afi rmed to have vocal complaint and
41afi rmed not to have vocal complaint (p=0.877).
But, when the sample was grouped according to the number of vocal symptoms, the group of teachers with vocal complaint increased up to 59 participants and the group without complaint decreased to 24
participants (p<0.001, i gure 2).
Figure 2 – Relation between measured complaint (according to the numbers of symptoms marked in vocal sign and symptoms protocol) and the reported complaint.
Both studied groups had nerovegetative symptoms with predominance in teachers with vocal complaint (table 1). In this group the mean of total neurovegetative symptoms was 13.7, while in the group without vocal complaint the mean was
7.7 (i gure 3). Considering the mean of symptoms
Signs and symptoms Without vocal complaint With vocal complaint p-value
N % N %
Symptoms not related to voice
Cold hands 0 0.00% 6 10.20% 0.105
Cold feet 1 4.20% 9 15.30% 0.159
Excessive transpiration 5 20.80% 15 25.40% 0.658
Excessive sensitiveness to coldness 4 16.70% 12 20.30% 0.701
Excessive sensitiveness to heat 9 37.50% 19 32.20% 0.644
Diarrhea 2 8.30% 6 10.20% 0.797
Constipation 8 33.30% 19 32.20% 0.921
Pufiness 10 41.70% 27 45.80% 0.734
Aerophagia 3 12.50% 17 28.80% 0.115
Nausea 1 4.20% 16 27.10% 0.019*
Eructations 6 25.00% 8 13.60% 0.207
Hiccups 3 12.50% 7 11.90% 0.936
Heartburn 9 37.50% 26 44.10% 0.583
Dizziness 3 12.50% 18 30.50% 0.087
Tinnitus 4 16.70% 14 23.70% 0.479
Dancing spots before the eyes 2 8.30% 13 22.00% 0.141
Dificult concentration 1 4.20% 19 32.20% 0.007*
Disturbed sleep 6 25.00% 30 50.80% 0.031*
Lack of energy 10 41.70% 36 61.00% 0.108
Palpitations 2 8.30% 16 27.10% 0.06
Nail biting 3 12.50% 7 11.90% 0.936
Sensation of extreme tiredness 6 25.00% 27 45.80% 0.08
Symptoms related to voice
Need of constantly swallowing 1 4.20% 17 28.80% 0.014*
Sore throat 1 4.20% 24 40.70% 0.001*
Hyperventilation 4 16.70% 8 13.60% 0.715
Frequent sneezing 6 25.00% 23 39.00% 0.226
Fluctuating nose obstruction 8 33.30% 25 42.40% 0.446
Dificulty breathing through the nose at rest 7 29.20% 20 33.90% 0.677
Habitual mouth breathing at rest 3 12.50% 17 28.80% 0.115
Feelings of tension in the head while
speaking 1 4.20% 16 27.10% 0.019*
Constant need to yawn 2 8.30% 19 32.20% 0.023*
Gnashing of teeth 3 12.50% 13 22.00% 0.318
Temporomandibular pain or discomfort 0 0.00% 12 20.30% 0.017*
Neck pain (while or after speaking) 1 4.20% 21 35.60% 0.003*
Chest discomfort (while or after speaking) 2 8.30% 9 15.30% 0.399
Fatigability when speaking 2 8.30% 31 52.50% <0.001*
Frequent throat clearing 1 4.20% 18 30.50% 0.010*
Social(communicative) handicape 0 0.00% 4 6.80% 0.191
Nonrelevant issues
Lack of appetite 0 0.00% 4 6.80% 0.191
Renal problems 3 12.50% 10 16.90% 0.613
Speciic allergy 8 33.30% 32 54.20% 0.084
Hearing loss 4 16.70% 9 15.30% 0.872
Headache 8 33.30% 30 50.80% 0.147
Chronic illness 3 12.50% 8 13.60% 0.897
Reliability
Feelings of mental stress 7 29.20% 29 49.20% 0.096
Feelings ofpsychictension 11 45.80% 41 69.50% 0.043*
The teacher dificulty in perceiving itself as a voice
professional may be an obstacle for the teacher to evaluate its own voice6.
The teachers participating of this research also
had dificulty to perceive their own complaints, fact
observed in the change in sample distribution. When composed from self-reported complaint (presence or absence of vocal complaint), the group with Comparing both sexes, women had higher
number of neurovegetative symptoms with predomi-nance in the group with vocal complaints (p=0.013, table 3).
DISCUSSION
Voice is a complex manifestation; depending on
Table 2 – Number of symptoms in autonomic dysfunction protocol (ADP)
Real complaint
Symptoms related to voice
Symptoms not related to
voice Not relevant
Without complaint With complaint Without complaint With complaint Without complaint With complaint Mean Median Standard deviation CV Min Max N CI 1.8 1 1.5 86% 0 5 24 0.6 4.7 4 3.6 77% 0 16 59 0.9 4.1 4 2.8 69% 0 10 24 1.1 6,2 6 3,5 56% 1 14 59 0,9 1,1 1 1,2 115% 0 5 24 0,5 1,6 2 1,1 67% 0 4 59 0,3
p-value <0.001* 0.009* 0.071
* Statistic signiicant p-value (p≤0.05) Statistic test ANOVA
Subtitles: SD = standard deviation; CV = coeficient of variation; N = number of subjects; CI = conidence interval
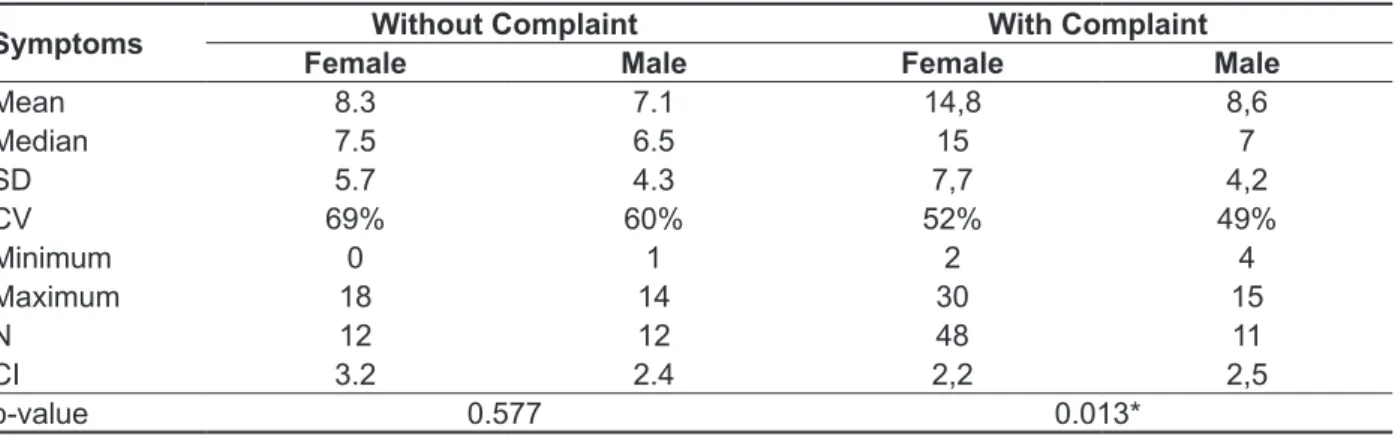
Table 3 –Comparison between sexes regarding number of neurovegetative symptoms in each group
Symptoms Without Complaint With Complaint
Female Male Female Male
Mean 8.3 7.1 14,8 8,6
Median 7.5 6.5 15 7
SD 5.7 4.3 7,7 4,2
CV 69% 60% 52% 49%
Minimum 0 1 2 4
Maximum 18 14 30 15
N 12 12 48 11
CI 3.2 2.4 2,2 2,5
p-value 0.577 0.013*
* Statistic signiicant p-value (p≤0.05) Statistic test ANOVA
and temporomandibularjoint dysfunction (TJD) in women, considering that as severe the TJD, higher the vocal disturb perception25. The symptoms
related to voice presented by the vocal complaint group showed that teachers of the present research may be susceptible to develop voice disturbances and autonomic dysfunction. Literature also points out studies relating the disturbances in ANS with QAD use, but in subjects with voice disorders from general population, without specifying the subjects’ profession11,15,16. Other studies observe the relation
between vocal complaint and ASN dysfunction symptoms with or without direct relation with voice in functional dysphonia, initially experienced only in female subjects11, and afterwards in both sexes, with
predominance in women16. Although the current
study did not evaluate whether the teachers with vocal complaint had deviated voices, it is worthy to point out that these data agree with a research with behavior dysphonia subjects15.
In table 3, comparing the symptoms according to sex, it is possible to observe that in vocal complaint group women had mean symptoms 14.8 while men had 8.6 (p=0.013). This higher number of symptoms in females may be explained by the accumulation of social roles played by women in social and work environment, which may generate an overload and increase in stress of these professionals.
The results points out the teachers from this study have risk to develop neurovegetative symptoms, mainly those direct related to voice. They also showed that the participants had little perception about their own vocal complaint, which reinforce the importance of using ADP in clinical help, as well as investment in vocal health programs, and guidance for teachers20.
It is worthy to highlight the importance of speech-language pathologist to pay attention the amount of neurovegetative symptoms that the teachers presents in ADP, mainly those related to vocal symptoms, in order to the teacher to be properly routed to the specialist, and the vocal rehabilitation may happen quickly.
CONCLUSION
The group of teachers with voice complaint had higher number of neurovegetative symptoms than the group without vocal complaint, mainly in issues related to voice, and predominantly in females. to use a more detailed investigation, identifying
possible vocal symptoms, with the help of speciic
tools, as VSSQ, and previous history, for example. Teachers have higher risk to develop psychic illness when compared to other groups22. The
interaction between subjects’ characteristics and environment demands may generate disturbances in behavior, cognitive and physiological aspects. Stress and depression may be responses to environment demands23. When the subject can
balance the stress situations and its environment, the ASN keep itself balanced, providing a better quality of life, and, therefore, of work.
The effects of environment demands in teachers’ life may be understood in table 1, in which the most relevant neurovegetative symptoms without direct relation to voice in the vocal complaint group were:
dificult concentration, disturbed sleep, nausea,
palpitations, and dizziness.
The mean of symptoms related to voice in complaint group was 4.7 and in the group without vocal complaint was 1.8 (Table 2), which demon-strates that teachers with vocal complaint have more autonomic dysfunction than the ones without vocal complaint. Perhaps this occurs due to the fact that teachers with vocal problems have to change communication strategy in classroom, which may affect the stress and, as consequence, the number of symptoms17.
Analyzing the group without vocal complaint, the most frequent symptoms were (Table 1): Fluctuating
nose obstruction (33.3%), dificulty breathing through
the nose at rest (29.2%), and frequent sneezing (25%). Although these symptoms had occurred of the same way between groups, these data points out that the groups without vocal complaint also
showed symptoms classiieds in QAD as related to
voice. Research with teachers shows that as higher the time teaching, higher is the lack of air complaint. Other study points out teachers have more tendency to develop sore throats and breathing allergies than non-teachers.
um estudo caso-controle. Cad. Saúde Pública. 2012;28(11):2115-24.
9. Goldman L, Ausiello D. Tratado de medicina interna. 22.ed. Rio de Janeiro: Elsevier. 2005. 10. Costanzo LS. Fisiologia. 3.ed. Rio de Janeiro: Elsevier. 2007.
11. Demmink-Geertman L, Dejonckere PH. Nonorganic habitual dysphonia and autonomic dysfunction. J Voice. 2002;16(4):549-59.
12. Seifert E, Kollbrunner J. Stress and distress in non-organic voice disorders. Swiss Med Wkly. 2005;135:387-97.
13. Carneiro SAM. Saúde do trabalhador público: questão para a gestão de pessoas – a experiência na Prefeitura de São Paulo. Revista do Serviço Público. 2006;57(1):23-49.
14. Dietrich M, Verdolini AK, Gartner-Schmidt J, Rosen CA. The frequency of perceived stress, anxiety, and depression in patients with common pathologies affecting voice. J Voice. 2008;22(4):472-88.
15. Park K, Behlau M. Sinais e sintomas da disfunção autônoma em indivíduos disfônicos. J. Soc. Bras. Fonoaudiol. 2011;23(2):164-9.
REFERENCES
1. Roy N, Merrill RM, Thibeault S, Gray SD, Smith EM. Voice disorders in teachers and the general population: effects on work performance, attendance, and future career choices. J Speech Lang Hear Res. 2004; 47:542-51.
2. Souza CL, Carvalho FM, Araújo TM, Reis EJFB, Lima VMC, Porto, LA. Fatores associados a patologias de pregas vocais em professores. Rev. Saúde Pública. 2011;45(5):914-21.
3. Roy N, Merrill RM, Thibeault S, Parsa RA, Gray SD, Smith EM. Prevalence of voice disorders in teachers and the general population. J Speech Lang Hear Res. 2004;47:281-93.
4. Verdolini K, Ramig LO. Review: occupational risks for voice problems. Log Phon Vocol. 2001;26(1):37-46.
5. Williams NR. Occupational groups at risk of voice disorders: a review of the literature. Occup Med. 2003;53(7):456-60.
6. Grillo MHMM, Penteado RZ. Impacto da voz na qualidade de vida de professore(a)s do ensino fundamental. Pró-Fono R. Atual. Cient. 2005;17(3):321-30.
RESUMO
Objetivo: comparar sinais de disfunção autônoma gerais e relacionados à voz em professores com e sem queixas vocais. Métodos: aplicação do Protocolo de Disfunção Autônoma (PDA) em 83 profes-sores, sendo 60 mulheres e 23 homens, com a média de idade de 37,6 anos. A amostra foi dividida
em dois grupos, com e sem queixas vocais, deinidas de acordo com o número de sintomas apresen -tados no Protocolo de Sinais e Sintomas Vocais. Resultados: o grupo com queixa vocal apresentou a média de 13,7 sintomas no PDA e o grupo sem queixa 7,7 (p=0,001). Considerando apenas os sin-tomas neurovegetativos relacionados com a voz, o grupo com queixa obteve a média de 4,7 sinsin-tomas e o grupo sem queixa 1,8 (p<0,001). Os sintomas relacionados com a voz que mais predominaram no grupo com queixa vocal, quando comparado com o grupo sem queixa, foram: cansaço quando fala (p<0,001), necessidade de engolir constantemente (p=0,014), dor de garganta (p=0,001), dor no pescoço enquanto fala (p=0,003), dor ou desconforto na ATM (p=0,017), necessidade constante de bocejar (p=0,023), pigarros constantes (p=0,010) e tensão na cabeça quando fala (p=0,019). Os sintomas observados no grupo sem queixa foram: nariz entupido (33,3%), respiração nasal difícil (29,2%) e espirros (25%). Conclusões: o grupo com queixa vocal apresentou maior número de sinais neurovegetativos, principalmente nas questões relacionadas à voz do que o grupo sem queixa.
O professor, as condições de trabalho e os efeitos sobre sua saúde. Educação e Pesquisa. 2005;31(2):189-99.
23. Margis R, Picon P, Cosner AF, Silveira RO. Relação entre estressores, estresse e ansiedade. Rev. Psiquiatr.2003;25(1):65-74.
24. Fuess VLR, Lorenz MC. Disfonia em professores do ensino municipal: prevalência e fatores de risco. Rev. Bras. Otorrinolaringol. 2003;69(6):807-12. 25. Pereira TC, Brasolotto AG, Conti PC, Berretin-Felix G. Temporomandibular disorders, voice and oral quality of life in women. J. Appl. Oral Sci. 2009;17(spe):50-6.
effects. J Voice. 2012;26(5):665e9-18.
18. Behlau M. Voz: o livro do especialista. Rio de Janeiro: Revinter; 2004. p.64-6.
19. Penteado RZ, Pereira IMTB. Qualidade de vida e saúde vocal de professores.Rev Saúde Pública. 2007;41(2):236-43.
20. Choi-Cardim K, Behlau M, Zambon F. Sintomas
vocais e peril de professores em um programa de
saúde vocal. Rev. CEFAC. 2010;12(5):811-9.
21. Servilha EAM. Consciência vocal em docentes universitários. Pró-Fono R Atual. Cient. 1997;9(2):53-61.
Received on: January 17, 2013 Accepted on: May 28, 2013
Mailing address: Carolina Farah Paes
Rua Machado Bittencourt, 361, Vila Mariana São Paulo – SP – Brasil
CEP: 04044-001