VOCAL SYMPTOMS OF FUTURE PROFESSIONAL
VOICE USERS
Sintomas vocais de futuros proissionais da voz
Carla Aparecida Cielo(1), Vanessa Veis Ribeiro(2),Carla Franco Hoffmann(1)(1) Departamento de Pós-Graduação em Distúrbios da
Comu-nicação Humana da Universidade Federal de Santa Maria/ UFSM, Santa Maria, RS, Brasil.
(2) Departamento de Pós-Graduação em Distúrbios da
Comu-nicação Humana da Universidade Federal de Santa Maria/ UFSM, Santa Maria, RS, Brasil; Departamento de Gra-duação em Fonoaudiologia da Universidade Estadual do Centro-Oeste do Parana/UNICENTRO, Irati, PR, Brasil. Support Source: CAPES; CNPq
Conlict of interest: non-existent
Thus, there has been an increase on the number
of research works that deal with the quality of life of individuals in relation to overall health and audiology
aspects1,2,5-10. In the area of voice, quality of life
has been assessed by means of self-perception
instruments1-3,7-12.
Self-perception of voice quality is a subjective parameter of paramount importance in obtaining data on how relevant vocal disorders can be for patients. It enables them to express their knowledge and how they perceive their own voices1,7,8.
With the intent to quantify vocal self-perception, different instruments have been developed and
can be used in research or clinical practice to assess and/or monitor the individual’s perception
of their voice disorder throughout therapy2,6,13. The
VoiceSymptomScale (VoiSS) stands out among these instruments, and it has been recently validated
and translated to Portuguese as Escala de Sintomas Vocais (ESV)13,14. International research, which
compared VoiSSa with other questionnaires used to assess voice quality of life, have found that VoiSS
INTRODUCTION
Health and quality of life are no longer considered to be merely the condition of not being ill, but instead, a state of complete physical and psychosocial well-being, which may change according to the life perspectives and social roles of each individual1-4.
The concern with the concept of quality of life refers to a movement that aims to value broader parameters than just symptom control, reduction of mortality or increase in life expectancy3-5.
ABSTRACT
Purpose: characterize the vocal symptoms of future professional voice users according to the age, gender and body mass index. Methods: the participants answered the Voice Symptom Scale, consisting of 30 questions, 15 being from limitation domain, eight from emotional domain and seven from the physical domain. Subjects were instructed to mark the answer that corresponds to the frequency of occurrence for each of the symptoms questioned. Also have been collected occupational data, anthropometric and general health. The data were analyzed descriptively and statistically using the nonparametric tests Spearman rank correlation, Mann Whitney and Kruskal-Wallis test with a signiicance level of 5%. Results: the sample consisted by 47 subjects, aged between 19 and 37 years (mean 22,17 years), being 28 (59,57%) females and 19 (40,43%) were males, the average was 11,38 vocal problems of a possible total of 30. There was greater frequency of symptoms “you cough or hem” and “you have dificulty to speak in noisy places”. Conclusion: the group of future professional voice users analyzed showed high average of vocal symptoms, highlighting the cough or hem and the dificulty to speak in noisy places, directly relating to incorrect vocal uses. With the increasing of the professional vocal demand, these individuals may be considered at risk for the development of voice
disorders.
METHODS
This is a cross-sectional, analytical, and quanti
-tative ield study approved by the Ethics Committee of Research under 23081.016945/2010-76. The participants were aware of the procedures and have signed an Informed Consent Form (ICF).
Data collection was conducted in public areas (parks, streets, etc.), and 65 volunteers underwent the inclusion and exclusion criteria to be selected for a convenience sample. Data were collected
during a vocal health movement, the World Voice
Day, held in the countryside of Rio Grande do Sul, the subjects who sought information on voice were invited to participate on this research study.
The convenience sample consisted of 47 subjects, aged from 19 to 37 (mean of 22.17), of which 28 (59.57%) were females and 19 (40.43%) were male, and who met the following inclusion criteria: signing of ICF; male or female; currently
attending a higher education course or technical
course geared towards a job that will require the use of voice. Exclusion criteria were: report of neurological or psychiatric diseases that might limit the reading comprehension of the ICF and of the data collection instrument (ESV), individuals who are currently using or have already used their voice as a work instrument, report of hearing problems or complaints, future singing voice professionals,
and incomplete data on the collection instruments.
Subjects considered to be future voice professional were exclusively those who were taking higher education or technical courses geared towards jobs that will require spoken professional voice use, regardless of their specialization areas, and who are not currently using and had never used their voice as a work instrument in the past.
The selected subjects illed out a protocol form with information on their proile, overall voice and speech records, history of professional performance
and anthropometric data, and completed the ESV.
Future career areas of the participants included education, physical education, special education, and social sciences (journalism and marketing).
BMI was determined according to the self-reported anthropometric data collected with the was submitted to a more complex development
and validation process, and it is thus more psycho
-metrically robust and widely used in the literature as a measure of vocal self-perception for dysphonic
individuals6,9. Its scale is sensitive to identify limita
-tions of communication, and physical and emotional symptoms present in adults with dysphonia15. This
scale has been recently validated13,14, and needs
to be applied to research involving the Brazilian
population, such as in this present study, which examines ESV results in future professional voice
users.
Professional voice users depend on a harmonic quality of voice, on the integrity of structures involved in the phonation process, and on favorable working conditions for proper and eficient personal relation -ships3,16,17. The preservation before the aggressive
agents and the maintenance of voice quality are important aspects of their overall health and quality of life18.
Although the primary function of speech is communication, in modern society, about a third of the workforce use it as a primary tool at their workplace3,19. Many of these professionals, who
lack proper care of their vocal health, can gradually develop some type of dysphonia as a consequence of their busy routines and intense vocal demands required at work20,21. Physical, social, environmental,
organizational, and psychological factors are known to also affect or predispose to the onset of vocal
changes22. Improper vocal use, overall health
conditions, anthropometric factors, and individual susceptibility may also favor the appearance of dysphonia16,23,24. Studies suggest that the
preva-lence of some degree of dysphonia in individuals that use their voice at work can reach 80.7%19,25,26.
Therefore, several studies have started to analyzed the quality of life of professional voice
users1,2,5-10, however, only a few of them concern
future professional voice users11,12.
Individuals that begin using their voice profes
each symptom, limitation and questioned vocal
problem. Occupational, overall health, and
anthro-pometric data were also collected.
Data were tabulated and the variables were descriptively and statistically analyzed through
nonparametric tests, Spearman correlation, Mann
Whitney and Kruskal-Wallis. Signiicance level of 5% was adopted, ie., all conidence intervals of the study were built with 95% statistical conidence.
RESULTS
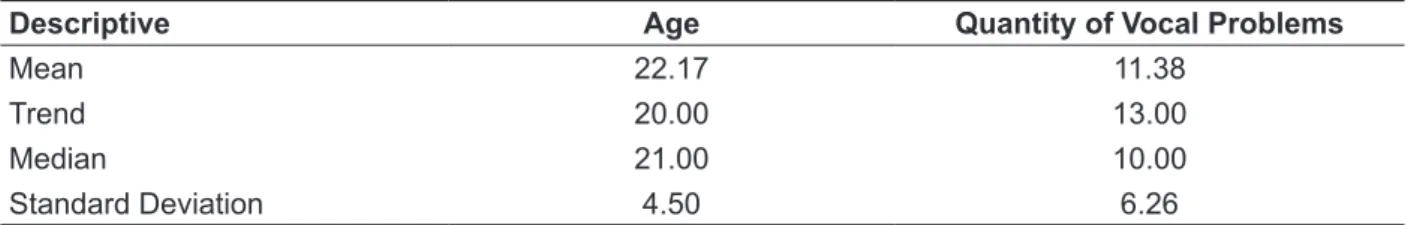
Table 1 shows the descriptive analysis on age and amount of vocal symptoms reported by future professional voice users from the ields of education, physical education, special education, and social sciences (journalism and marketing), with a mean of 11.38 problems, of a total possibility of 30.
weight = 17.0 ≤ BMI <18.5; normal = 18.5 ≤ BMI <25.0; overweight = BMI > 2527.
Participants answered the ESV, which consisted of 30 questions, of which 15 referred to the “limitation” (functionality) domain, eight refferred to the “emotional” (psychological effects) domain, and seven to the “physical” (organic symptoms)
domain14. Each question was scored according to
the frequency of symptoms: “never” (zero points), “rarely” (one point), “sometimes” (two points), “almost always” (three points) and “always” (four points)13-15.
Total ESV calculated by the simple summation of the value of each question indicates the general level of voice change. Maximum score is 120 points, where 60 points refer to the limitation subscale, 32 to the emotional and 28 to the physical subscale13.
Subjects were instructed to tick the response that corresponded to the frequency of occurrence of
Table 1 – Descriptive analysis of the quantity of problems reported by future professional voice users
Descriptive Age Quantity of Vocal Problems
Mean 22.17 11.38
Trend 20.00 13.00
Median 21.00 10.00
Standard Deviation 4.50 6.26
Descriptive Analysis
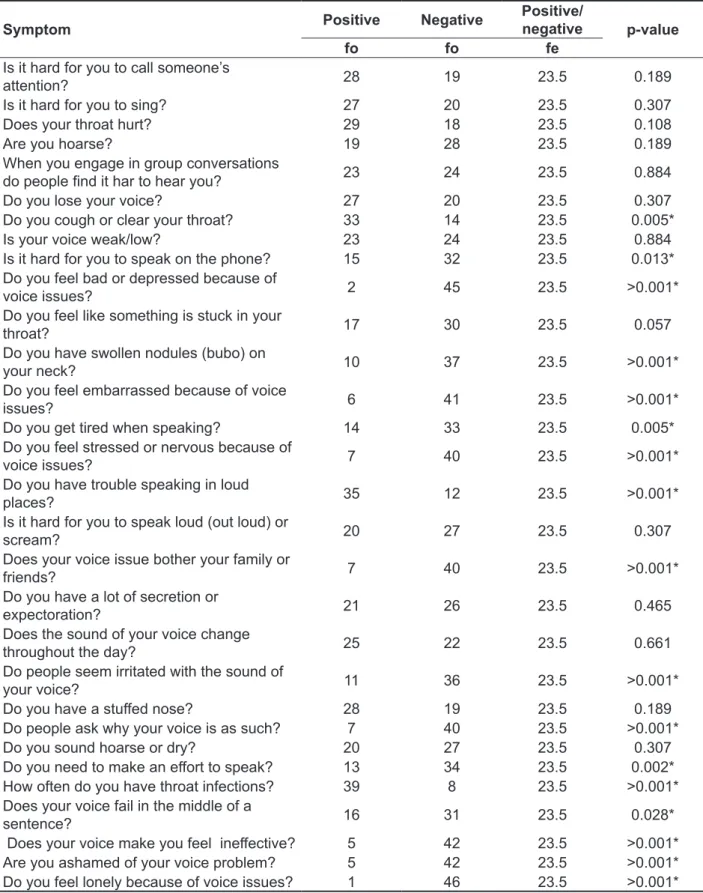
Table 2 shows data for the frequency of occur
-rence of vocal problems and limitations. There was greater frequency of “you cough or clear your throat” and “you have trouble speaking in loud places”, with statistically signiicant difference
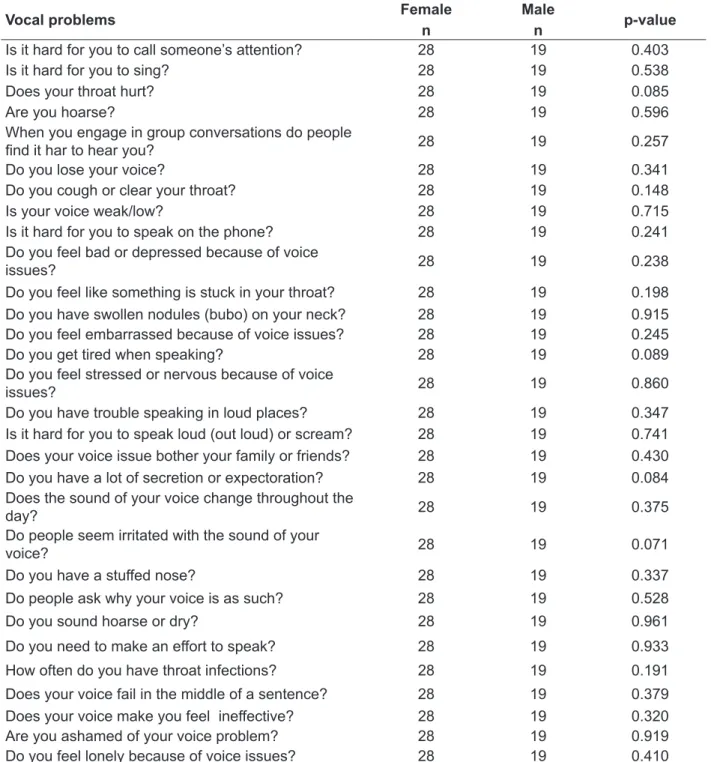
The occurrence of vocal problems and limita
-tions between genders is shown on Table 3. No signiicant difference was found when comparing men and women for any of the symptoms.
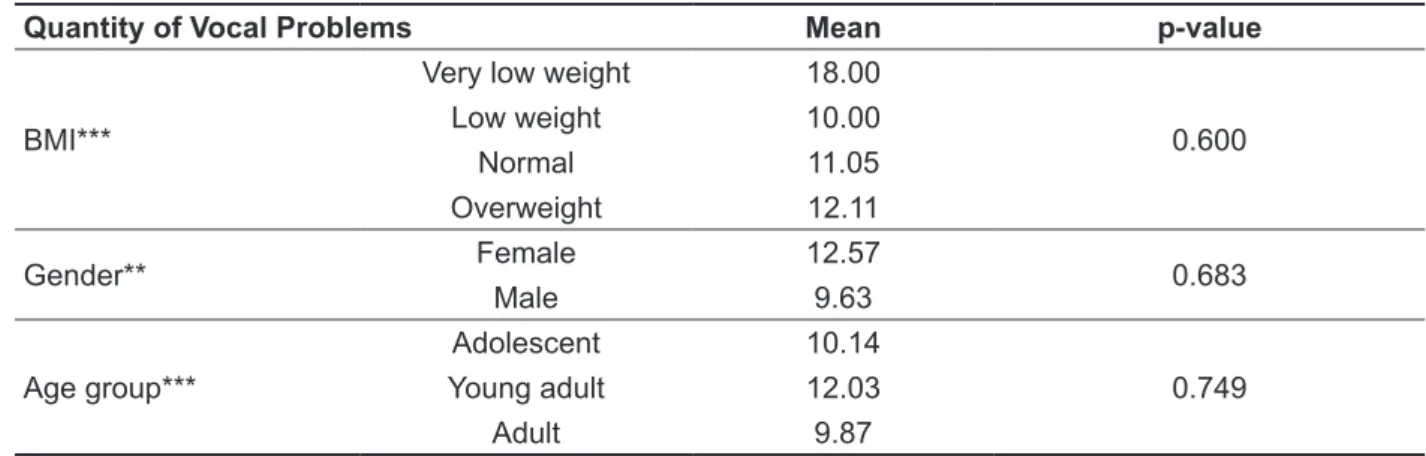
Table 4 shows comparisons of the amount of
vocal problems and limitations against gender, as
well as BMI against age group, with no signiicant differences.
Table 5 shows a correlation of the amount of
vocal problems and limitations against age and BMI
with no signiicant differences.
On Table 6 brings comparisons of men and women vocal problem subscales with no signiicant differences.
Regarding the domain cross of scales and age groups, Table 7 shows no signiicant differences.
Table 2 – Distribution of vocal problem frequency of occurrence
Symptom Positive Negative
Positive/
negative p-value
fo fo fe
Is it hard for you to call someone’s
attention? 28 19 23.5 0.189
Is it hard for you to sing? 27 20 23.5 0.307
Does your throat hurt? 29 18 23.5 0.108
Are you hoarse? 19 28 23.5 0.189
When you engage in group conversations
do people ind it har to hear you? 23 24 23.5 0.884
Do you lose your voice? 27 20 23.5 0.307
Do you cough or clear your throat? 33 14 23.5 0.005*
Is your voice weak/low? 23 24 23.5 0.884
Is it hard for you to speak on the phone? 15 32 23.5 0.013*
Do you feel bad or depressed because of
voice issues? 2 45 23.5 >0.001*
Do you feel like something is stuck in your
throat? 17 30 23.5 0.057
Do you have swollen nodules (bubo) on
your neck? 10 37 23.5 >0.001*
Do you feel embarrassed because of voice
issues? 6 41 23.5 >0.001*
Do you get tired when speaking? 14 33 23.5 0.005*
Do you feel stressed or nervous because of
voice issues? 7 40 23.5 >0.001*
Do you have trouble speaking in loud
places? 35 12 23.5 >0.001*
Is it hard for you to speak loud (out loud) or
scream? 20 27 23.5 0.307
Does your voice issue bother your family or
friends? 7 40 23.5 >0.001*
Do you have a lot of secretion or
expectoration? 21 26 23.5 0.465
Does the sound of your voice change
throughout the day? 25 22 23.5 0.661
Do people seem irritated with the sound of
your voice? 11 36 23.5 >0.001*
Do you have a stuffed nose? 28 19 23.5 0.189
Do people ask why your voice is as such? 7 40 23.5 >0.001*
Do you sound hoarse or dry? 20 27 23.5 0.307
Do you need to make an effort to speak? 13 34 23.5 0.002*
How often do you have throat infections? 39 8 23.5 >0.001*
Does your voice fail in the middle of a
Table 3 – Comparison of vocal problem occurrence between genders
Vocal problems Female
n
Male
n p-value
Is it hard for you to call someone’s attention? 28 19 0.403
Is it hard for you to sing? 28 19 0.538
Does your throat hurt? 28 19 0.085
Are you hoarse? 28 19 0.596
When you engage in group conversations do people
ind it har to hear you? 28 19 0.257
Do you lose your voice? 28 19 0.341
Do you cough or clear your throat? 28 19 0.148
Is your voice weak/low? 28 19 0.715
Is it hard for you to speak on the phone? 28 19 0.241
Do you feel bad or depressed because of voice
issues? 28 19 0.238
Do you feel like something is stuck in your throat? 28 19 0.198
Do you have swollen nodules (bubo) on your neck? 28 19 0.915
Do you feel embarrassed because of voice issues? 28 19 0.245
Do you get tired when speaking? 28 19 0.089
Do you feel stressed or nervous because of voice
issues? 28 19 0.860
Do you have trouble speaking in loud places? 28 19 0.347
Is it hard for you to speak loud (out loud) or scream? 28 19 0.741
Does your voice issue bother your family or friends? 28 19 0.430
Do you have a lot of secretion or expectoration? 28 19 0.084
Does the sound of your voice change throughout the
day? 28 19 0.375
Do people seem irritated with the sound of your
voice? 28 19 0.071
Do you have a stuffed nose? 28 19 0.337
Do people ask why your voice is as such? 28 19 0.528
Do you sound hoarse or dry? 28 19 0.961
Do you need to make an effort to speak? 28 19 0.933
How often do you have throat infections? 28 19 0.191
Does your voice fail in the middle of a sentence? 28 19 0.379
Does your voice make you feel ineffective? 28 19 0.320
Are you ashamed of your voice problem? 28 19 0.919
Do you feel lonely because of voice issues? 28 19 0.410
* Values statistically signiicant (p≤0.05) – Mann Whitney Test
Table 4 – Quantity of vocal problems in relation to Body Mass Index, gender, and age group
Quantity of Vocal Problems Mean p-value
BMI***
Very low weight 18.00
0.600
Low weight 10.00
Normal 11.05
Overweight 12.11
Gender** Female 12.57 0.683
Male 9.63
Age group***
Adolescent 10.14
0.749
Young adult 12.03
Adult 9.87
* Values statistically signiicant (p≤0.05) – Mann Whitney U Test and Kruskal-Wallis***
Legend: BMI=Body Mass Index
Table 5 – Quantity of vocal problems in relation to Body Mass Index and age
Quantity of Vocal Problems Corr p-value
BMI 0.010 0.943
Age -0.030 0.830
* Values statistically signiicant (p≤0.05) – Spearman Correlation
Legend: corr=coeficient of correlation; BMI=Body Mass Index
Table 6 – Subscale cross of vocal problems and gender
Domain Male
Mean
Female
Mean p-value
Limitation 40.69 43.98 0.240
Emotional 27.74 30.57 0.194
Physical 41.91 47.57 0.226
Total 44.84 49.50 0.212
* Values statistically signiicant (p≤0.05) – Mann Whitney Test
Table 7 – Subscale cross of vocal problems and age group
Domain Adolescent
Mean
Young adult Mean
Adult
Mean p-value
Limitation 41.18 43.38 41.03 0.888
however, has found one to two symptoms per subject for telemarketing operators31.
In the case of professional voice users, the large amount of vocal symptoms reported can be due to the lack of information and awareness on
voice issues, resulting in improper voice use32. In
the long term, and with increased demand, this may be a triggering factor for the development of voice
disorders.
In this present study, vocal symptoms with signif
-icant frequency of occurrence were “you cough or clears your throat” and “you have trouble speaking in loud places” (Table 2). Further studies made with college students and professional voice users show that throat clearing is a relevant symptom among such professionals18,26,28. A study that applied a
self-assessment questionnaire to 517 college students
has found dry mouth, throat and clearing as most common symptoms, respectively28. A Research
conducted with 40 teachers has also highlighted other symptoms as being frequent: voice failures; hoarseness; dificulty to speak and dryness26.
Another study with 37 teachers diagnosed as having normal voices, by means of audio perceptual analysis, has found that, while speech evaluation presented normal results, signiicant symptoms such as throat clearing and dry throat were noted. We stress the importance of researching future professional voice users, since, even before a vocal disorder is said to be installed, unfavorable vocal conditions can result in negative symptoms17.
Thus, it is important to investigate individual
self-perception, besides the vocal and audio perceptual
analysis of voice18.
Research on factors associated with throat clearing in college students has shown that possible causes were smoking, frequent respiratory infections and digestive problems. Throat clearing may also be associated with bad vocal habits and the results of this research indicate that future professional voice users are unaware of vocal health issues28.
As for the dificulty of speaking in loud places, the literature suggests that noise interferes with
DISCUSSION
Due to the multidimensional nature of dysphonia, different research instruments should be used for this matter. Thus, the use of self-assessment
questionnaires is indicated1,2,5-10. Assessing how
these symptoms may affect the personal and profes
-sional life of a subject is one of the advantages of
using such instruments.
According to the literature, the application of protocol forms presents result variability associated with the target population1,2,5-10, however, the
majority of studies on this subject have used
teachers as target audience, due to their high rate
of dysphonia7,8,11,16-18,20-22,24-26. Preparing them to the
market and working demands is believed to be paramount for these professionals. Thus, existing vocal symptoms should be veriied for future profes
-sional voice users, with the intent to prevent and / or care for their vocal health28.
The average amount of vocal symptoms reported by future professional voice users was 11.38 per participant – and the trend was 13 of a total of 30
options in the scale. According to the literature29,
more than three vocal symptoms per subject can be
considered a high average. From this perspective,
future professional voice users included in this study may already have a vocal disorder installed, or develop it with increased vocal demands. This may affect their quality of life and performance during work activity, increasing personal and social
damage.
Studies on the average vocal symptoms present in professional voice users show great discrepancy from the average found in individuals with no vocal use at work30-32. A 30-questions research on vocal
symptoms in church singers has also found high occurrence, 7.78 per subject32. A study comparing
two groups of teachers, one that attended vocal health workshops and other that did not participate, found an average of 3.5 vocal symptoms in partici -pants and 5.8 in non-partici-pants16. Another study,
Table 8 – Subscale cross of vocal problems and Body Mass Index
Scores
Very low weight
Mean
Low weight Mean
Normal Mean
Overweight
Mean p-value
Limitation 46.66 38.33 40.92 49.62 0.262
Emotional 37.50 25.00 28.80 31.54 0.409
Physical 53.57 39.28 44.53 48.01 0.768
Total 55.00 42.00 46.19 53.11 0.376
* Values statistically signiicant (p≤0.05) – Kruskal-Walis Test
no signiicant results were found for the number of symptoms among individuals with very low weight, low weight, normal and overweight (Table 4), as well as for increased weight and number of symptoms (Table 5), contradicting this inding in the literature23.
There was also no major impact on any of the
subscales assessed (Table 8).
Advanced age and greatest vocal demand are reported to cause voice issues26, however, in this
study, this association was not found (Table 5). No relationship was found between age group and number of symptoms (Table 4), nor the greatest impact of any of the domains that the scale covers
in a given age group (Table 7). Results can be
justiied by the unbalanced distribution of subjects in age groups, and the greatest amount of young adults, making it harder to compare age groups. The literature shows that structural changes start occurring in the larynx only from 45 years of age, and that the senescence period of voice occurs around 60, varying according to individual charac -teristics40. Considering that the average age in this
study was 22.17 and the older subject in the sample was 37 years old, vocal wear and tear of age has not yet affected these subjects.
High frequency of vocal problems or limitations in this present study shows that future professional voice users may already be considered a risk group for the development of voice disorders. This inding is quite relevant, because the expansion of vocal demand in the beginning of professional activity might increase the frequency of symptoms, and may result in an actual vocal impairment with signiicant impact on the quality of life and work performance of these professionals. Thus, primary and vocal health care are essential to prepare professionals for the expanded use of their voices.
CONCLUSION
The group of future professional voice users included in this study has showed high average of vocal symptoms, specially coughing, throat clearing, and dificulty of speaking in loud places. With increased professional vocal demand, these individuals may be at risk for the development of vocal self-monitoring and it is possibly associated
with: hoarseness, sore throat, and a greater effort to speak. Noise mainly disrupts the professional use of voice, as reported in research with professors who have associated noise with the dificulty in
developing lessons, in student learning and in their communication33.
Considering that in this present study only future spoken voice professionals have been analyzed, and that such future jobs include teachers of lower grades in elementary school, there are also other environmental aggravating factors in the classroom itself that should be mentioned, since children are between ive and ten years old and use their voice in a high sound level for their own personality and age proile, even competing vocally with other classmates. This creates a background noise in the room that goes from 50 to 80dB, and may exceed
35dB, the standard limit according to the American National Standard Institute (ANSI)34,35. This situation
makes teachers need to raise their sound pressure by about 9.1 dB and the usual frequency in half
an octave above the normal pattern, in order to
thereby exercise control of the class and mediate the content of classes25,34,36. Such increase in
loudness and the use of other vocal adaptations in the classroom, such as shouting, whispering, and interpreting other voices, without the proper support and use of proper vocal techniques, often lead to the onset of dysphonia resulting from inadequate
voice use19,21,24,37.
Regarding gender, there was no signiicant difference in the occurrence of vocal problems or limitations (Table 3), in the domains they refer (Table 6) nor in the amount of vocal problems or limitations (Table 4). These results are contrary to other studies that found increased susceptibility of females to the development of voice disorders, justiied by anatomical differences, more frequently in medical treatment, and choice for careers that require greater use of voice38,39.
As noted above, the anatomical or anthropometric
9. Branski RC, Cukier-Blaj S, Pusic A, Cano SJ, Klassen A, Mener D et al. Measuring quality of life in dysphonic patients: a systematic review of
content development in patient-reported outcomes
measures. J Voice. 2010;24(2):193-8.
10. Deary IJ, Wilson JA, Carding PN, Mackenzie K, Watson R. From dysphonia to dysphoria: mokken scaling shows a strong, reliable hierarchy of voice symptoms in the Voice Symptom Scale questionnaire. J Psychosom Res. 2010;68(1):67-71.
11. Servilha EAM, Mendes GB. Autopercepção vocal, cuidados e perspectivas de uso na docência por graduandos de Pedagogia. Distúrb Comum.
2007;19(3):313-23.
12. Miranda CCI, Ladeira AC, Gouveia VL, Costa
VR. Auto-análise vocal de alunos do curso de teatro.
Distúrb Comum. 2012;24(3):369-78.
13. Moreti F, Zambon F, Oliveira G, Behlau M. Adaptação transcultural da versão brasileira da escala de sintomas de voz: VoiSS. J Soc Bras
Fonoaudiol. 2011;23(4):398-400.
14. Moreti F. Validação da versão brasileira da Voice
Symptom Scale – VoiSS. Rev Soc Bras Fonoaudiol.
2012;17(2):238.
15. Deary IJ, Wilson JA, Carding PN, Mackenzie K. VoiSS: a patient-derived voice symptom scale. J Psychosom Res. 2003;54(3):483-9.
16. Choi-Cardim K, Behlau M, ZambonF. Sintomas vocais e peril de professores em um programa de saúde vocal. Rev CEFAC. 2010;12(5):811-9. 17. Musial PL, Dassie-Leite AP, Zaboroski AP, Casagrande RC. Interferência dos sintomas vocais
REFERENCES
1. Kasama ST, Brasolotto AG. Percepção vocal
e qualidade de vida. Pró-Fono R Atual Cient.
2007;19(1):19-28.
2. Behlau M, Oliveira G, Santos LMA, Ricarte A.
validação no Brasil de protocolos de auto-avaliação
do impacto de uma disfonia. Pró-Fono R Atual Cient. 2009;21(4):326-32.
3. Putnoki DS, Hara F, Oliveira G, Behalu M. Qualidade de vida em voz: o impacto de uma disfonia de acordo com o gênero, idade e uso proissional da voz. Rev Soc Bras Fonoaudiol. 2010;15(4):485-90. 4. Azevedo GPGC, Friche AAL, Lemos SMA.
Autopercepção de saúde e de qualidade de vida
de usuários de um ambulatório de fonoaudiologia. RevSocBrasFonoaudiol.2012;17(2):119-27.
5. Carmo RD, Camargo Z, Nemr K. Relação entre
qualidade de vida e autopercepção da qualidade vocal de pacientes laringectomizados totais: estudo piloto. Rev CEFAC. 2006;8(4):518-28.
6. Wilson JA, Webb A, Carding PN, Steen IN,
Mackenzie K, Dearly IJ. The Voice Symptom Scale (VoiSS) and the Vocal Handicap Index (VHI): a comparison of structure and content. Clin Otolaryngol Allied Sci. 2004;29(2):169-74.
7. Penteado RZ, Pereira IMTB. Qualidade de vida e saúde vocal de professores. Rev Saúde Pública.
2007;41(2):236-43.
8. Servilha E, Roccon P. Relação entre voz e
qualidade de vida em professores universitários. Rev CEFAC. 2009;11(3):440-8.
RESUMO
Objetivo: caracterizar os sintomas vocais de futuros proissionais da voz conforme as variáveis idade, sexo e índice de massa corporal. Métodos: os participantes responderam a Escala de Sintomas
Vocais, composta por 30 questões, sendo 15 do domínio limitação, oito do domínio emocional e sete do domínio físico. Os indivíduos foram orientados a assinalar a resposta que correspondesse à frequência de ocorrência para cada um dos sintomas questionados. Foram coletados também dados ocupacionais, antropométricos e de saúde geral.Os dados foram analisados descritivamente e estatis
-ticamente por meio dos testes não paramétricos Correlação de Spearman, Mann Whitney e Kruskal-Wallis, com nível de signiicância de 5%. Resultados: a amostra constituiu-se de 47 indivíduos, com idades entre 19 e 37 anos (média de 22,17 anos), sendo 28 (59,57%) do sexo feminino e 19 (40,43%) do sexo masculino,a média foi de 11,38 problemas vocais, de uma possibilidade total de 30. Houve maior frequência dos sintomas “você tosse ou pigarreia” e “você tem diiculdade para falar em locais
barulhentos”. Conclusão: o grupo de futuros proissionais da voz analisado apresentou alta média de
sintomas vocais, salientando-se a tosse ou pigarro e a diiculdade para falar em locais barulhentos, diretamente relacionados a usos vocais incorretos. Com o aumento da demanda vocal proissional esses indivíduos poderão ser considerados de risco para o desenvolvimento de distúrbios vocais.
27. OMS, Organização Mundial da Saúde. Obesidade e Sobrepeso. Fact shet nº 311.2013.
[Cited 2013 Mar 20]. Available from:<http://www. who.int/mediacentre/factsheets/fs311/en/>.
28. Ferreira LP, Penha PJ, Caporossi C, Fernandes ACN. Professores universitários: descrição de características vocais e posturais. Distúrb Comun. 2011;23(1):43-9.
29. Behlau M, Rehder MI. Higiene Vocal para o
Canto Coral. Rio de Janeiro: Revinter, 2008.
30. Ferreira LP, Santos JG, Lima MFB. Sintoma
vocal e sua provável causa: levantamento de dados
em uma população. Rev CEFAC. 2009;11(1):110-8. 31. Dassie-Leite AP, Lourenço L, Behlau M.
Correlação entre dados ocupacionais, sintomas e avaliação vocal de operadores de telesserviços.
Rev Soc Bras Fonoaudiol. 2011;16(1):59-63. 32. Ribeiro VV, Santos AB, Bonki E, Prestes T, Dassie-Leite AP. Identiicação de problemas vocais enfrentados por cantores de igreja. Rev CEFAC. 2012;14(1):90-6.
33. Servilha EAM, Delatti MA. Percepção do
ruído no ambiente de trabalho e sintomas auditivos e extra-auditivos autorreferidos por professores universitários. J Soc Bras
Fonoaudiol.2012;24(3):233-8.
34. Sodersten M, Granqvist S, Hammarberg B,
Szabo A. Vocal behavior and vocal loading factors for preschool teachers at work studied with binaural
DAT recordings. J Voice. 2002;16(3):356-71.
35. Ziegler A, Gillespie AI, Abbott KV. Behavioral treatment of voice disorders in teachers. Folia Phoniatr Logop. 2010;62(1):9-23.
36. Behlau M, Zambon F, Guerrieri AC, Roy N. Epidemiology of voice disorders in teachers and
nonteachers in brazil: prevalence and adverse
effect. J Voice. 2012;26(5):655-65.
37. Araujo TM, Reis EJFB, Carvalho FM, Porto LA, Reis IC, Andrade JM. Fatores associados a alterações vocais em professores. Cad Saúde Pública. 2008;24(6):1229-38.
38. Ferreira LP, Giannini SPP, Figueira S, Silva EE, Karmann DF, Souza TMT. Condições de produção na atuação proissional de professores. Distúrb
Comun. 2011;23(3):335-41.
18. Pena JJ, Servilha EAM. Tipiicação de sintomas relacionados à voz e sua produção em professores identiicados com ausência de alteração vocal na avaliação fonoaudiológica. Anais do XIV Encontro de Iniciação Cientíica da PUC-Campinas; 2009 Sep29-30; Campinas, SP. Campinas: editora PUC; 2009.
19. Behlau M, Feijó D, Madazio G, Rehder MI, Azevedo R, Ferreira AE. Voz proissional: aspectos gerais de atuação fonoaudiologica. 2. ed. In: Behlau
M, editor. Voz: o livro do especialista. Rio de Janeiro: Revinter; 2005. p.287-372.
20. Aydos BRS, Motta L, Teixeira BS. Eicácia da hidratação na redução de queixas vocais de professores. J Soc Bras Fonoaudiol. 2000;1(2):10-5. 21. Simberg S, Sala E, Vehmas K, Laine A. Changes in the prevalence of vocal symptoms among teachers during a twelve-year period. J Voice. 2005;19(1):95-102.
22. Santana MCCP, Goulart BNG, Chiari BM.
Distúrbios da voz em docentes: revisão crítica da literatura sobre a prática da vigilância em
saúde do trabalhador. J SocBrasFonoaudiol.
2012;24(3):288-95.
23. Cunha MGB, Passerotti GH, Weber R,
Zilberstein B. Caracterização da voz do indivíduo
portador de obesidade mórbida. ABCD, Arq Bras Cir
Dig. 2009;22(2):76-81.
24. Vianello L, Assunção AA, Gama ACC. Estratégias implementadas para enfrentar as exigências vocais da sala de aula: o caso das professoras readaptadas por disfonia. Distúrb Comun. 2008;20(2):163-70. 25. Fuess VLR, Lorenz MC. Disfonia em professores do ensino municipal: prevalência e fatores de risco. Rev Bras Otorrinolaringol. 2003;69(6):807-12.
26. Vieira AC, Behlau M. Análise de voz e
comunicação oral de professores de curso pré-vestibular. Rev Soc Bras Fonoaudiol. 2009;14(3):346-51.