INSTITUTO OSWALDO CRUZ
FIRST CENTENARY: 1900 - 2000
ORTRUD MONIKA BARTH
ATLAS OF DENGUE VIRUSES
MORPHOLOGY AND
MORPHOGENESIS
Rio de Janeiro, Brazil
2000
AUTHOR BIOGRAPHY
Ortrud Monika Barth
A native of Germany, Ortrud Monika Barth grew up in Rio de Janeiro, where she got her Ph.D. degree at the Department of Botany of the Federal University of Rio de Janeiro in 1964. A post-doctor fellowship followed in the Universities of Heidelberg and Freiburg in Germany. Pollen grain morphology and its application in science, as well as ultrastructural research in Biology, introduced she as a student into the Instituto Oswaldo Cruz. There she built a research group in Palynology in the Department of Ecology, along twenty years. In 1979 she moved to the Department of Virology, for virus diagnosis and morphogenesis in electron microscopy, as Head of the Laboratory of Viral Ultrastructure.
For several years O. Monika Barth was a member of the direction of the Brazilian Society for Electron Microscopy, Professor for Palynology and is the Head of the Laboratories of Palynology in the Departments of Botany and Geology at the Federal University of Rio de Janeiro. Since 1962 she is a fellow of the National Research Council (CNPq).
She carried out collaborative research projects in Germany, England and France and as author and co-author published more than 300 scientific papers, five books, 15 chapters in books and has orientated many post-graduate students in both fields of specialization.
Ficha Catalográfica
B284a Barth, Ortrud Monika
Atlas of dengue viruses morphology and morphogenesis / Ortrud Monika Barth. - Rio de Janeiro: XXX , 2000.
1.Dengue.2.Morphology.3.Morphogenesis.4.Atlas.
CDD – 20.ed. - 614.571
Imprinta Express Ltda.
To
Hermann Gonçalves Schatzmayr
and
CONTENTS
FOREWORD (9) PREFACE (11)
ACKNOW LEDGMENTS (14)
REFERENCES (15)
THE VIRUS PARTICLE (Figs. 1-9)
THE INFECTED CELL (Fig. 10-48)
ADSORPTION (Figs. 49-52,60)
PENETRATION
Endocytosis (Figs. 50-52)
Endosomes (Figs. 53, 54)
Phagosomes (Figs. 55, 56)
Cell fusion (Figs. 27, 28, 30-33, 57, 58, 72)
TRANSPORT
Endosomial network (Figs. 59, 60)
Microtubules (Figs. 54, 75, 89, 91, 111)
REPLICATION
Rough endoplasmic reticulum (rER) and
smooth membrane structures (SMS) (Figs. 61-81,88,108)
In situ hybridization (ISH) (Figs. 82, 83)
Immunoelectron microscopy (IEM) (Figs. 84-87)
Atypical virus particles (Figs. 89-95)
MATURATION and EXOCYTOSIS
Golgi complex (Figs. 96-103, 115)
INACTIVATION
Lysosomes (Figs. 44-47, 65, 69, 95, 106, 108)
Vacuoles (Figs. 42, 63, 64, 68, 79, 98, 108)
Cell lysis (Figs. 37, 37, 104, 105)
SPECIAL FEATURES
Confronting cysterns/”double-track-structures” (Figs. 79, 93, 108-112)
Infected Vero cells (Figs. 37, 114, 115)
LR-gold embedding (Fig. 113)
Cryosections (Figs. 80, 81, 102, 103)
FOREWORD
It is a great pleasure to introduce this Atlas of Dengue Viruses Morphology and Morphogenesis, which summarize the data obtained in the Viral Ultrastructure Laboratory of our Department of Virology by Dr. O.M. Barth, along the last ten years.
After presenting the virus and dengue infected cells in its general aspects, the morphogenesis of dengue viral replication is described and discussed, aiming to obtain clearer definition of the events involved in the replication.
The book combines skilfull technical aspects with scientific criticism and is intended to be used as a reference, to those in the field of dengue morphogenesis and replication, as well as to electron microscopists and virologists in general.
Dengue virus infections became the most important arthropod borne viral disease in the world, along the last two decades and every effort to better understand its replication and morphogenesis should be encouraged. We consider this book an excellent contribution in these aspects.
This publication is dedicated to the Instituto Oswaldo Cruz, in its Centenary accomplished by May 2000, pointing out its vast contribution for research in tropical diseases, including dengue and yellow fever.
Dr. Hermann G. Schatzmayr Head, Virology Department
PREFACE
The replication process of viruses of the Flaviridae family is still not yet completely known. Many papers about this subject deal with dengue viruses and the yellow fever virus, both of the genus Flavivirus.
Beside these viruses, the Flaviviridae family comprises others RNA viral members, which morphogenesis, viral particles assembly and cell release, as well as persistent cell infections constitute a scientific challenge (Barth, 1992; Barth, 1999; Barth & Schatzmayr, 1992; Gubler & Kuno, 1997; Henchal & Putnak, 1990; Rice 1996).
Electron microscopy has been used as a very efficient tool to study virus particle morphology (Ackermann & Berthiaume, 1995; Doane & Anderson, 1987; Madeley & Field, 1988), as the unique technique for direct visualization of morphological structures. Virus infected tissues can also be analyzed by this technique (Murphy & Nathanson, 1997). Modern techniques of molecular biology have detected several steps of the dengue virus pathway across infected cells (Rice, 1996; Westaway, 1987). Morphological studies using electron microscopy showed regions inside the cells where virus particles replicate until its (Barth, 1992; Ng & Corner, 1989).
In relation to the genus Pestivirus, ultrastructural observations suggest that these viruses, like dengue viruses, remain inside cell vesicles and are released from the Golgi complex by exocytosis (Bielefeldt Oltmann & Bloch, 1982; Gray & Nettleton, 1987). Nevertheless, Hepatitis C virus (HCV) evolution inside infected cells was not yet extensively studied by electron microscopy; molecular biology studies of HCV proteins during viral maturation suggest a transit of virus particles through the Golgi system for exocytosis (Rice, 1996); this observation agrees with our model for dengue virus replication (Barth, 1992; Barth, 1999).
1994; Rice, 1996) could never be demonstrated in our experiments by electron microscopy. Our data obtained using immunolabelling and in situ hybridization experiments with dengue viruses (Grief et al., 1997), show that the virus particles are formed inside the lumen of the rough endoplasmic reticulum (rER), with an active participation of the rER-membrane bound ribosomes and vesicles and tubules of smooth-membrane structures (SMS).
In order to better understand the Flavivirus lifecycle, we elaborated a model of virus replication (Barth, 1992; Barth, 1999) using a member of this genus, dengue virus type 2 (DEN-2, dengue-2), isolated from human sera and inoculated in the clone C6/36 mosquito cell line from Aedes albopictus. These studies were carried out by light (LM), confocal (LSCM), scanning (SEM) and transmission (TEM) electron microscopy. We used classical techniques for electron microscope preparations (Maunsbach & Afzelius, 1999), as well as cytochemical identification of cell structures (Robinson, 1985; Spring & Trendelenburg, 1991), immunological viral protein detection (Barth, 1999), in situ hybridization of viral RNA (Grief et al., 1997) and ultrathin cryosections.
The lifecycle of the dengue virus is demonstrated by high resolution pictures in the present atlas. Additional informations are presented in the legends of the figures.
ABREVIATIONS
DIC - differential interference contrast (Nomarski’s contrast) DNA - desoxiribonucleic acid
F - filaments FL - fluorescence G - Golgi complex
IEM - immunoelectron microscopy ISH - in situ hybridisation
L - lysosome
LM - light microscopy
LSCM - laser scanning confocal microscopy M - mitochondrium
N - nucleus n - nucleolus P - phagosome
rER - rough endoplasmic reticulum RNA - ribonucleic acid
ACKNOWLEDGEMENTS
REFERENCES
Ackermann, H.-W. and Berthiaume, L., 1995. Atlas of Virus Diagrams. CRC Press, Boca Raton. 151p.
Barth, O.M., 1984. Estudos sobre a contrastação negativa de suspensöes virais. Revista Brasileira de Biologia 44: 71-80.
Barth, O.M., 1985. The use of polylysine during negative staining of viral suspensions. Journal of Virological Methods 11: 23-27.
Barth, O.M., 1992. Replication of dengue viruses in mosquito cell cultures - a model from ultrastructural observations. Memórias do Instituto Oswaldo Cruz 87: 565-574.
Barth, O.M. and Schatzmayr, H.G., 1992. Brazilian dengue virus type 1 replication in mosquito cell cultures. Memórias do Instituto Oswaldo Cruz 87: 1-7.
BARTH, O.M., GRIEF, C., CORTES, L.M.C. and SCHATZMAYR, H.G., 1997. Dengue virus (Flavivirus) morphogenesis: ultrastructural aspects. Acta Microscopica 6: 9-13.
BARTH, O.M. and CORTES, L.M.C.,
1997.
Morphology of dengue virus induced syncytia. Acta Microscopica 6: 1-8.Barth, O.M., 1999. Ultrastructural aspects of the dengue virus (flavivirus) particle morphogenesis. Journal of Submicroscopic Cytology and Pathology 31: 404-412.
Bielefeldt Oltmann, H. and Bloch, B., 1982. Electron microscopic studies of bovine viral diarrhea virus in tissues of diseased calves and in cell cultures. Archives of Virology 71: 57-74.
Doane, F.W. and Anderson, N., 1987. Electron Microscopy in Diagnostic Virology. Cambridge University Press, Cambridge. 178p.
Ghadially, F.N., 1982. Ultrastructural Pathology of the Cell and Matrix. 2nd edition. Butterworth, London. 971p.
Gray, E.W. and Nettleton, P.E., 1987. The ultrastructure of cell cultures infected with border disease and bovine virus diarrhoea viruses. Journal of General Virology 68: 2339-2346.
Grief, C., Galler, R., Côrtes, L.M. de C. and Barth, O.M., 1997. Intracellular localization of dengue-2 RNA in mosquito cell cultures using electron microscopic in situ hybridisation. Archives of Virology 142: 2347-2357.
Griffiths, G., 1983. Fine Structure Immunocytochemistry. Springer-Verlag, Berlin. 459p.
Gubler, D.J. and Kuno, G. (editors), 1997. Dengue and Dengue Hemorrhagic Fever. Cab International, University Press, Cambridge. 478p.
Hase, T., Summers, P.L., Eckels, K.H. and Putnak, J.R., 1989. Morphogenesis of Flavivirus. Subcellular Biochemistry 15: 275-305.
Ko, K.K., Igarashi, A. and Fukai, K., 1979. Electron microscopic observations on
Aedes albopictus cells infected with dengue viruses. Archives of Virology 62: 41-52.
Leary, K. and Blair, C.D., 1980. Sequential events in the morphogenesis of Japanese encephalitis virus. Journal of Ultrastructure Research 72: 123-129.
Madeley, C.R. and Field, A.M., 1988. Virus Morphology. Churchill Livingstone, Edinburgh. 295p.
Maunsbach, A.B. and Afzelius, B.A., 1999. Biomedical Electron Microscopy. Academic Press, San Diego. 548p.
Murphy, F.A. and Nathanson, N., 1997. An atlas of viral pathogenesis. In: Nathanson, N. (editor). Viral Pathogenesis. Lippincott-Raven Publishers, Philadelphia. 940p.
Ng, M.L. and Corner, L.C., 1989. Detection of some dengue-2 virus antigens in infected cells using immuno-microscopy. Archives of Virology 104: 197-208.
Ng, M.L., Howe, J., Sreenivasan, V. and Mulders, J.J.L., 1994. Flavivirus West Nile (Sarafend) egress at the plasma membrane. Archives of Virology 137: 303-313.
Rice, C.M., 1996. Flaviviridae: The viruses and their replication. In: Fields, B.N., Knipe, D.M., Howley, P.M. et al. (editors). Fields Virology, third edition. Lippincott-Raven Publishers, Philadelphia, pages 931-959.
Spring, H. and Trendelenburg, M.F., 1991. Basic applications of fluorescence microscopy. In: Advanced digital light microscopy EMBO practical course, Gene Structure Unit, German Cancer Research Center, October 1991.
The virus particle
Fig. 1. Model of a dengue virus particle (virion).
The virus particle
Fig. 2. Dengue-2 virus infected mosquito cell culture. TEM
The cells were frozen twice at the sixth day post-infecion. The cell/virus suspension was clarified by low speed centrifugation. The resulting fluid was precipitated with amonium sulphate and high speed centrifuged for 15 min. The pellet was resuspended in a drop of destilled water and negatively stained with 2% PTA, pH 7.2 (Barth, 1984, 1985).
The virus particle
Fig. 3. Dengue-2 virus infected mosquito cell culture. TEM
The infected cell suspension was ultracentrifuged during 1h at 3,000rpm. The pellet was resuspended in destilled water and negatively stained with 2% PTA, pH 7.2.
The virus particle
Fig. 4. Dengue-1 virus infected mosquito cell culture. TEM
The same methodology as described in Fig. 3 was used.
The virus particle
Fig. 5. Dengue-2 virus infected mosquito cell culture. TEM
The same methodology as in Fig. 2 was used.
The virus particle
Fig. 6. Dengue-1 virus infected mosquito cell culture. TEM
The infected cell cultures of ten Roux flasks mixed together were clarified and purified in a saccharose gradient; fraction 21 was negatively stained with 2% PTA, pH 7.2 and illustrated.
The virus particle
Fig. 7. Dengue-1 virus infected mosquito cell culture. IEM
The same gradient fraction as in Fig. 6. Before negatively stained, the electron microscope grid with the virus particles on, was floated over a drop of a hyperimmune mouse ascitic fluid reactive to dengue viruses, incubated for 30 min at 36oC, followed by incubation with protein A-gold (10 nm) also for 30 min at room temperature.
The virus particle
Fig. 8. Dengue-2 virus infected mosquito cell culture. IEM
A saccharose gradient was prepared as described in Fig. 6. The virus particles from fraction 22 were incubated with the specific antibody and protein A-gold as described in Fig. 7. Negative staining was carried out with 2% PTA, pH 7.2.
The virus particle
Fig. 9. Dengue-2 virus infected mosquito cell culture. IEM
The same gradient fraction and grid processing as described in Fig. 8. The negative staining was executed with a 2% solution of acqueous uranyl acetate.
The infected cell
10
Fig. 10. Dengue-2 virus infected mosquito cell culture. LM/FL
The infected cells were scrapped off from the vial, dropped onto microscope slides, air dried and fixed in cold (-20oC) acetone for 10 min. After incubation (37oC, 30 min) with a dengue-2 specific antibody, immunofluorescence was carried out using a fluorescein conjugated anti-mouse antibody during 30 min at room temperature.
Original magnification: 100x. Final magnification: 400x.
The infected cell
11
Fig. 11. Dengue-2 virus infected mosquito cell culture. LM/DIC
Infected cell monolayer cultures on cover-glasses were fixed in phosphate-buffered formalin (Millonigs fixative), 72h post-infection, when more or less 30% of cytopathic effect (syncytia formation) could be detected. These samples may be kept for several weeks in the cold (4-8oC) for further processing. After washing in PBS, the samples were photographed in the same buffer.
Original magnification: 50x. Final magnification: 90x.
The infected cell
Fig. 12. Dengue-2 virus infected mosquito cell culture. LM/DIC
The same preparation as in Fig. 11.
Original magnification: 100x. Final magnification: 600x.
The infected cell
Fig. 13. Dengue-2 virus infected mosquito cell culture. LM
The infected cell monolayer was processed as described in Fig. 11. After removing the fixative, the cells were Giemsa stained and sealed with Damar glue.
Original magnification: 100x. Final magnification: 350x.
The infected cell
Fig. 14. Dengue-2 virus infected mosquito cell culture. LM/DIC
The same cell culture as in Fig. 13, embedded in phosphate buffer solution, without staining.
Original magnification: 100x. Final magnification: 350x.
The infected cell
Figs. 15-18. Dengue-2 virus infected mosquito cell culture. LSCM
Infected cell monolayers were grown on cover-glasses, fixed in Millonigs fixative three days post-infection and processed for laser-scan-confocal microspcopy (LSCM) observation. Cell compartments and organelles may be emphasized using different fluorescent stains. Virus factories are characterized presenting strong antibody and lipid fluorescence, increase of the rough endoplasmic reticulum fluorescence and no or soft RNA fluorescence when compared with the strong fluorescence of cell nuclei.
Fig. 15. Nile red staining. Single cells show lipid fluorescence inside the cytoplasm. 300x.
Fig. 16. Nile red staining. Large fluorescent patches inside the syncytia are regions of virus particle factories. 300x.
Fig.17. Nile red staining. A very large syncytium present at the left side the fluorescent region of virus replication and morphogenesis, where lipids are highly concentrated. 300x.
The infected cell
Figs. 19-22. Dengue-2 virus infected mosquito cell culture. LSCM
Fig. 19. DIOC (3,3-dihexyloxacarbocyanine iodide) staining. This fluorescent stain emphasizes the endoplasmic reticulum in single cells and syncytia. 400x.
Fig. 20. Nile red staining. The same syncytia as in Fig. 19 (double stained), emphasizing high lipid concentration inside the cytoplasm. 400x.
Fig. 21. Acridin orange staining for selective DNA and RNA fluorescence in single cells and syncytia. The fluorescence of nuclei is stronger than of the cell cytoplasm. 200x.
The infected cell
Fig. 23. Dengue-2 virus infected mosquito cell culture. SEM
Infected cell monolayer cultures grown on cover-glasses were fixed in 1% phosphate-buffered glutaraldehyde six days post-infection, when circa 30% of the cytopathic effect (syncytia formation) could be detected. After dehydration with ethanol, the cell cultures were critical point dried and sputtered with a 20 nm thick gold layer. Pictures were taken using secondary electron emission.
Original magnification: 50x. Final magnification: 100x.
The infected cell
Fig. 24. Dengue-2 virus infected mosquito cell culture.SEM
Similar cell culture and processing as described in Fig. 23, fixed 72h post-infection.
Original magnification: 200x. Final magnification: 400x.
The infected cell
Fig. 25. Dengue-2 virus infected mosquito cell culture. SEM
Similar cell culture and processing as described in Fig. 23, fixed 72h post-infection.
Original magnification: 500x. Final magnification: 1,300x.
The infected cell
Fig. 26. Dengue-2 virus infected mosquito cell culture. SEM
Similar cell culture and processing as described in Fig. 23, fixed 72h post-infection.
Original magnification: 1,000x. Final magnification: 2,600x.
The infected cell
Fig. 27. Dengue-2 virus infected mosquito cell culture. SEM
Similar cell culture and processing as described in Fig. 23, fixed 72h post-infection.
Original magnification: 3,500x. Final magnification: 10,500x.
The infected cell
Fig. 28.Dengue-2 virus infected mosquito cell culture. SEM
Similar cell culture and processing as described in Fig. 23. A 1/100 diluted antibody was added to the virus containing inoculum. The infected cell culture was fixed 4 days post-infection.
Original magnification: 2,000x. Final magnification: 5,500x.
The infected cell
Fig. 29. Dengue-2 virus infected mosquito cell culture. SEM
Similar cell culture and processing as described in Fig. 23, fixed 48h post-infection. This image was taken using back-scattered electron emission.
Original magnification: 1,000x. Final magnification: 2,800x.
The infected cell
Fig. 30.Dengue-2 virus infected mosquito cell culture. SEM
Similar cell culture and processing as described in Fig. 23, fixed 4 days post-infection.
Original magnification: 5,000x. Final magnification: 14,000x.
The infected cell
Fig. 31. Dengue-2 virus infected mosquito cell culture. SEM
Similar cell culture and processing as described in Fig. 23, fixed 72h post-infection.
The infected cell
Fig. 32. Dengue-2 virus infected mosquito cell culture. SEM
Similar cell culture and processing as described in Fig. 23, fixed 72h post-infection.
Original magnification: 5,000x. Final magnification: 14,000x.
The infected cell
Fig. 33. Dengue-2 virus infected mosquito cell culture. SEM
Similar cell culture and processing as described in Fig. 23, fixed 72h post-infection.
The infected cell
Fig. 34. Dengue-2 virus infected mosquito cell culture. SEM
Similar cell culture and processing as described in Fig. 23, fixed 7 days post-infection.
Original magnification: 2,300x. Final magnification: 6,000x.
The infected cell
Fig. 35. Dengue-2 virus infected mosquito cell culture. SEM
Similar cell culture and processing as described in Fig. 23, fixed 6 days post-infection.
Original magnification: 300x. Final magnification: 900x.
The infected cell
Fig. 36. Dengue-2 virus infected mosquito cell culture. SEM
Similar cell culture and processing as described in Fig. 23, fixed 9 days post-infection.
Original magnification: 300x. Final magnification: 900x.
The infected cell
Fig. 37. Dengue-2 virus infected Vero cell culture. SEM
This infected cell monolayer was processed as described in Fig. 23, fixed 72h post-infection.
Original magnification: 100x. Final magnification: 300x.
The infected cell
Fig. 38. Dengue-2 virus infected mosquito cell culture. SEM
Similar cell culture and processing as described in Fig. 23, fixed 72h post-infection.
The infected cell
Fig. 39. Dengue-2 virus infected mosquito cell culture. SEM
Similar cell culture and processing as described in Fig. 23, fixed 72h post-infection.
The infected cell
Fig. 40. Dengue-2 virus infected mosquito cell culture. TEM
A positive human dengue-2 serum and a dengue-1 human convalescent serum were mixed, incubated at 37oC for 30min. The infected cell monolayer was fixed 30sec post-infection with 1% phosphate-buffered glutaraldehyde. After washing in the same buffer, the cells were scraped off from the vial and post-fixed in 1% osmium tetroxide, washed, dehydrated in increasing concentration of acetone and embedded in Epon. Ultrathin sections were stained with uranyl acetate and lead citrate and observed in a Zeiss EM-900 transmission electron microscope.
Original magnification: 7,000x. Final magnification: 15,000x.
The infected cell
Fig. 41. Dengue-1 virus infected mosquito cell culture. TEM
The cell culture was fixed 5 days post-infection and standard processed as discribed in Fig. 40.
Original magnification: 5,000x. Final magnification: 13,000x.
The infected cell
Fig. 42. Dengue-1 virus infected mosquito cell culture. TEM
The cell culture was fixed 4 days post-infection and standard processed as described in Fig. 40.
The infected cell
Fig. 43. Dengue-1 virus infected Aedes pseudoscutellaris (AP61) cell culture. TEM
The cell culture was fixed 6 days post-infection and standard processed as described in Fig. 40.
Original magnification: 4,400x. Final magnification: 10,000x.
The infected cell
Fig. 44. Dengue-1 virus infected mosquito cell culture. TEM
The cell culture was fixed 3 days post-infection in cacodylate-buffered 1% glutaraldehyde, washed in acetate buffer and incubated in a solution of cerium chloride for one hour. After washing again with acetate and cacodylate buffers, the cells were fixed again with 3% glutaraldehyde, washed and scraped off from the vial. Post-fixation was done in 2% osmium tetroxide, dehydration in increasing concentrations of acetone and embedding in Epon (Robinson, 1985).
Original magnification: 3,150x. Final magnification: 6,000x.
The infected cell
Fig. 45. Dengue-1 virus infected mosquito cell culture. TEM
The same preparation as in Fig. 44.
Original magnification: 5,000x. Final magnification: 10,000x.
The infected cell
Fig. 46. Dengue-1 virus infected mosquito cell culture. TEM
The same preparation as in Fig. 44.
Original magnification: 5,000x. Final magnification: 10,000x.
The infected cell
Fig. 47. Dengue-1 virus infected mosquito cell culture. TEM
The same preparation as in Fig. 44.
Original magnification: 8,000x. Final magnification: 16,000x.
The infected cell
Fig. 48. A model of dengue virus morphogenesis
The active phase of this event is constituted of virus particle adsorption to the cell membrane, its entry into the cell using three ways of penetration (endocytosis, phagocytosis and direct penetration), the replication process itself and the appearance of new virus particles and smooth membrane structures inside the rough endoplasmic reticulum, followed by virus transport throughout the Golgi complex and finally exocytosis.
The passive phase comprises virus inactivation inside lysosomes and its processing inside vacuoles. (from Barth, 1992, modified)
Adsorption
49
Fig. 49. Dengue-2 infected mosquito cell culture. TEM
A positive human dengue-2 serum and a dengue-1 human convalescent serum were mixed and incubated at 37oC for 30min. The cell culture was fixed 30min post-infection and standard processed as described in Fig. 40.
Original magnification: 50,000x. Final magnification: 130,000x.
Viral particles are joined by antibodies from the human dengue-1 convalescent serum and adsorbed to the cell membrane. This frontal view is a nearly parallel section to the plasma membrane surface. Irregularly shaped ribosomes are dispersed inside the cytosol at the left side of the figure. Each virus particle presents an electron-dense core surrounded by a triple shelled unit membrane (dark, light, dark), where viral proteins are insered and antibodies are linked to. Each virus particle
Penetration: endocytosis
Fig. 50. Dengue-2 virus infected mosquito cell culture. TEM
The same preparation as in Fig. 40.
Original magnification: 20,000x. Final magnification: 48,000x.
Penetration: endocytosis
51
Fig. 51. Dengue-2 virus infected mosquito cell culture. TEM
The same preparation as in Fig. 49.
Penetration: endocytosis
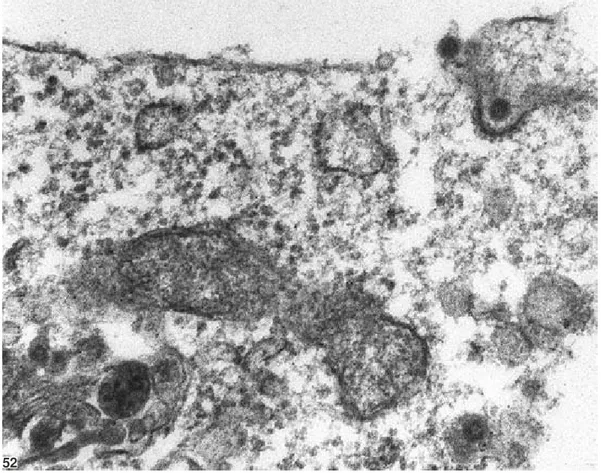
52
Fig. 52. Dengue-2 virus infected mosquito cell culture. TEM
The same preparation as in Fig. 49.
Penetration: endosomes
Fig. 53. Dengue-2 virus infected mosquito cell culture. TEM
The same preparation as in Fig. 40.
Penetration: endosomes
Fig. 54. Dengue-2 virus infected mosquito cell culture. TEM
The same preparation as in Fig. 40.
Penetration: phagosomes
Fig. 55. Dengue-2 virus infected mosquito cell culture. TEM
The same preparation as in Fig. 49.
Penetration: phagosomes
Fig. 56. Dengue-2 virus infected mosquito cell culture. TEM
The same preparation as in Fig. 40.
Penetration: cell fusion
Fig. 57. Dengue-2 virus infected mosquito cell culture. TEM
The same preparation as in Fig. 40.
Original magnification: 12,000x. Final magnification: 31,000x.
Two cells start fusion “from within” mediated by dengue virus particles. At different points (arrows) the fusion is effective, while beside these, the cell membranes are yet present. In the middle and lower parts of the figure, numerous endosomes and cysterns of the endosomial network contain several virus particles. Mitochondria and cysterns of the rough endoplasmic reticulum may be recog
nized. A clathrin coated endocytic vesicle is located near to the cell membrane in the upper part of the figure. The several cell to cell connections established are in
Penetration: cell fusion
Fig. 58. Dengue-1 virus infected mosquito cell culture. TEM
The cell culture was fixed 6 days post-infection and standard processed as described in Fig. 40.
Transport: edosomial network
Fig. 59. Dengue-2 virus infected mosquito cell culture. TEM
The same preparation as in Fig. 40.
Transport: endosomial network
Fig. 60. Dengue-2 virus infected mosquito cell culture. TEM
The same preparation as in Fig. 49.
Replication
Fig. 61. Dengue-1 virus infected mosquito cell culture. TEM
The same preparation as in Fig. 44.
Replication
Fig. 62. Dengue-2 virus infected mosquito cell culture. TEM
The cell culture was fixed 3 days post-infection and standard processed as described in Fig. 40. Ultrathin sections were over-stained using 5% aquous uranyl acetate for 2min and treated with 0.2M EDTA during 20-30min, in order to clear the DNA-containing structures. In sequence, the sections were stained only with lead citrate (Bernhard, 1969).
Original magnification: 20,000x. Final magnification: 52,000x.
Replication
Fig. 63. Dengue-1 virus infected mosquito cell culture. TEM
The cell culture was fixed 2 days post-infection and standard processed as described in Fig. 40.
Original magnification: 10,000x. Final magnification: 24,000x.
Replication
Fig. 64. Dengue-1 virus infected mosquito cell culture. TEM
The same preparation as in Fig. 63.
Original magnification: 16,500x. Final magnification: 45,000x.
Replication
Fig. 65. Dengue-1 virus infected mosquito cell culture. TEM
The same preparation as in Fig. 44.
Original magnification: 8,000x. Final magnification: 16,000x.
Replication
Fig. 66. Dengue-2 virus infected mosquito cell culture. TEM
The cell culture was fixed 6 days post-infection and standard processed as described in Fig. 40.
Replication
Fig. 67. Dengue-2 virus infected mosquito cell culture. TEM
The cell culture was fixed 3 days post-infection and standard processed as described in Fig. 40. EDTA treatment of this section was carried out as described in Fig. 62.
Original magnification: 12,000x. Final magnification: 32,000x.
Replication
Fig. 68. Dengue-1 virus infected mosquito cell culture. TEM
The same preparation as in Fig. 44.
Original magnification: 16,500x. Final magnification: 43,000x.
Replication
Fig. 69. Dengue-2 virus infected mosquito cell culture. TEM
The same preparation as in Fig. 66.
Original magnification: 20,000x. Final magnification: 55,000x.
Replication
Fig. 70. Dengue-1 virus infected mosquito cell culture. TEM
The same preparation as in Fig. 44.
Replication
Fig. 71. Dengue-1 virus infected mosquito cell culture. TEM
The same preparation as in Fig. 44.
Replication
Fig. 72. Dengue-1 virus infected mosquito cell culture. TEM
The cell culture was fixed 8 days post-infection and standard processed as described in Fig. 40.
Original magnification: 20,000x. Final magnification: 51,000x.
Replication
Fig. 73. Dengue-2 virus infected mosquito cell culture. TEM
The cell culture was fixed 3 days post-infection and standard processed as described in Fig. 40.
Replication
Fig. 74. Dengue-2 virus infected mosquito cell culture. TEM
The same preparation as in Fig. 67.
Replication
75
Fig. 75. Dengue-2 virus infected mosquito cell culture. TEM
The same preparation as in Fig. 73.
Replication
Fig. 76. Dengue-1 virus infected mosquito cell culture. TEM
The same preparation as in Fig. 44.
Replication
Fig. 77. Dengue-2 virus infected mosquito cell culture. TEM
The cell culture was fixed 3 days post-infection and standard processed as described in Fig. 40.
Replication
Fig. 78. Dengue-2 virus infected mosquito cell culture. TEM
The cell culture of the 4th virus passage was fixed 3 days post-infection and standard processed as described in Fig. 40.
Original magnification: 20,000x. Final magnification: 49,000x.
Replication
79
M
Fig. 79. Dengue-2 virus infected mosquito cell culture. TEM
The same preparation as in Fig. 78.
Original magnification: 20,000x. Final magnification: 49,000x.
Replication
Fig. 80. Dengue-2 virus infected mosquito cell culture. TEM
The cell culture was fixed 3 days post-infection in 1% phosphate buffered glutaraldehyde. Ultrathin sections were obtained using the crioultramicrotomy technique (Griffith, 1993), in order to obtain more information about localization of virus particle and smooth membrane structures inside cell organelles.
Original magnification: 30,000x. Final magnification: 74,000x.
Replication
81
Fig. 81. Dengue-2 virus infected mosquito cell culture. TEM
Replication
82
Fig. 82. Dengue-2 virus infected mosquito cell culture. TEM-ISH
The infected cell culture was fixed using cacodylate buffered 1% glutaraldehyde, dehydrated using increasing concentrations of ethanol and low temperature embedded in LR-Gold resin. Ultrathin sections were harvested on nickel grids, incubated using digoxigenin labelled probe and stained with aqueous uranyl acetate only (Barth, 1999; Grief et al., 1997).
Original magnification: 22,000x. Final magnification: 62,000x.
Replication
83
Fig. 83. Dengue-2 virus infected mosquito cell culture. TEM-ISH
The same preparation as in Fig. 82
Replication
Fig. 84. Dengue-2 virus infected mosquito cell culture. TEM-IEM
The same preparation as in Fig. 82.
Original magnification: 20,000x. Final magnification: 46,000x.
Ultrathin sections were harvested on nickel grids, formerly incubated using a hiperimmune ascitic fluid and in sequence incubated with 10nm gold-protein A and stained with aqueous uranyl acetate and lead citrate.
Original magnification: 20,000x. Final magnification: 50,000x.
Replication
Fig. 85. Dengue-2 virus infected mosquito cell culture. TEM-IEM
The same preparation as in Fig. 82.
Original magnification: 20,000x. Final magnification: 50,000x.
Replication
Fig. 86. Dengue-2 virus infected mosquito cell culture. TEM-IEM
The same preparation as in Fig. 82.
Original magnification: 30,000x. Final magnification: 75,000x.
Replication
Fig. 87. Dengue-2 virus infected mosquito cell culture. TEM-IEM
The same preparation as in Fig. 82.
Original magnification: 50,000x. Final magnification:
130,000x.
This tangential section of smooth membrane structure
membranes shows that gold label is located over the
Replication
Fig. 88. A model for enveloped dengue virus particle morphogenesis.
Hypothetical way of virus particle synthesis. Viral RNA can pass the translocator protein below the rER-linked ribosomes. Proteins are there synthetized into the rER lumen. Both migrate and anchore on the SMS surfaces and condense in the middle zone into viral nucleocapsids (virus RNA+ core protein). Emerging from this dense structured area, the nucleocapsids adquire the envelopes (containing protein prM and protein E) and became immature virus particles.
Replication
Fig. 89. Dengue-2 virus infected mosquito cell culture. TEM
The same preparation as in Fig. 66.
Replication
Fig. 90. Dengue-2 virus infected mosquito cell culture. TEM
The cell culture was fixed 3 days post-infection and standard processed as described in Fig. 40.
Original magnification: 20,000x. Final magnification: 47,000x. Dengue-2 typical (smooth coated) and atypical (fuzzy coated) virus particles occur inside enlarged cysterns of the rough endoplasmic reticulum. Numerous membrane bound ribosomes of the rough endoplasmic reticulum are lost during viral morphogenesis progress.
Replication
Fig. 91. Dengue-2 virus infected mosquito cell culture. TEM
The cell culture was fixed 3 days post-infection and standard processed as described in Fig. 66.
Replication
Fig. 92. Dengue-2 virus infected mosquito cell culture. TEM
A dengue-2 positive serum and a dengue-1 convalescent serum were mixed
and incubated at 37oC for 30min for virus infection enhancement. The infected cell
monolayer was fixed 6 days post-infection and standard processed as described in Fig. 40.
Original magnification: 20,000x. Final magnification: 45,000x.
Replication
Fig. 93. Dengue-2 virus infected mosquito cell culture. TEM
The cell culture of the 3rd virus passage was fixed 3 days post-infection and standard processed as described in Fig. 40.
Replication
Fig. 94. Dengue-2 virus infected mosquito cell culture. TEM
The cell culture was fixed 3 days post-infection and standard processed as described in Fig. 40.
Replication
95
SMS
Fig. 95. Dengue-2 virus infected mosquito cell culture. TEM
The same preparation as in Fig. 78.
Original magnification: 30,000x. Final magnification:
69,000x.
Maturation and Exocytosis
96
Fig. 96. Dengue-2 virus infected mosquito cell culture. TEM
The same preparation as in Fig. 62.
Original magnification: 20,000x. Final magnification:
57,000x.
Maturation and Exocytosis
97
Fig. 97. Dengue-2 virus infected mosquito cell culture. TEM
The same preparation as in Fig. 89.
Original magnification: 30,000x. Final magnification:
76,000x.
Maturation and Exocytosis
98
Fig. 98 - Dengue-2 virus infected mosquito cell culture. TEM
The same preparation as in Fig. 78.
Original magnification: 20,000x. Final magnification:
53,000x.
Maturation and Exocytosis
99
M
Fig. 99. Dengue-2 virus infected mosquito cell culture. TEM
The same preparation as in Fig. 63.
Maturation and Exocytosis
100
G
V
V
Fig. 100. Dengue-2 virus infected mosquito cell culture. TEM
The same preparation as in Fig. 89.
Original magnification: 30,000x. Final magnification: 70,000x.
Maturation and Exocytosis
101N
M
G
V
V
V
Fig. 101. Dengue-1 virus infected mosquito cell culture. TEM
The same preparation as in Fig. 44.
Original magnification: 32,900x. Final magnification: 80,000x. This ultrathin section, harvested on a collodion coated grid, was processed for EDTA-treatment as described in Fig. 67.
Maturation and Exocytosis
102
M
G
M
Fig. 102. Dengue-2 virus infected mosquito cell culture. TEM
The same preparation as in Fig. 80.
Maturation and Exocytosis
103
M
M
Fig. 103. Dengue-2 virus infected mosquito cell culture. TEM
The same preparation as in Fig. 80.
Inactivation: cell lysis
104
Fig. 104. Dengue-2 virus infected mosquito cell culture. TEM
The same preparation as in Fig. 92.
Inactivation: cell lysis
105
Fig. 105. Dengue-1 virus infected mosquito cell culture. TEM
The same preparation as in Fig. 44.
Original magnification: 8,000x. Final magnification: 21,000x.
Special Features
106
Fig. 106. Dengue-2 virus infected mosquito cell culture. TEM
The same preparation as in Fig. 92.
Original magnification: 20,000x. Final magnification:
46,000x.
Special Features
107
Fig. 107. Dengue-2 virus infected mosquito cell culture. TEM
The same preparation as in Fig. 58.
Special Features
Fig. 108. Dengue-1 virus infected mosquito cell culture. TEM
The cell culture was fixed 6 days post-infection and standard processed as described in Fig. 40.
Original magnification: 12,000x. Final magnification: 29,000x.
Special Features
Fig. 109. Dengue-2 virus infected mosquito cell culture. TEM
The same preparation as in Fig. 78.
Original magnification: 30,000x. Final magnification:
77,000x.
Special Features
Fig. 110. Dengue-2 virus infected mosquito cell culture. TEM
The cell culture was fixed 3 days post-infection and standard processed as described in Fig. 40.
Special Features
Fig. 111. Dengue-2 virus infected mosquito cell culture. TEM
The same preparation as in Fig. 110.
Original magnification: 50,000x. Final magnification:
125,000x.
Special Features
112
Fig. 112. Dengue-2 virus infected mosquito cell culture. TEM
The similar preparation as in Fig. 110 using another
patient serum as inoculum.
Original magnification: 30,000x. Final magnification:
87,000x.
Special Features
113
Fig. 113. Dengue-2 virus infected mosquito cell culture. TEM
The cell culture was fixed 3 days post-infection with glutaraldehyde only and low temperature embedded in LR-Gold resine (Grief et al., 1997). Ultrathin sections were double stained with uranyl acetate and lead citrate.
Original magnification: 30,000x. Final magnification: 79,000x.
Special Features
114
N
G
M
N
L
Fig. 114. Dengue-2 virus infected Vero cell culture. TEM
Vero cell culture was fixed 3 days post-infection and standard processed as described in Fig. 40.
Original magnification: 12,000x. Final magnification: 26,000x.
Special Features
115
F
Fig. 115. Dengue-2 virus infected Vero cell culture. TEM
A similar preparation as in Fig. 114.
Original magnification: 50,000x. Final magnification: 118,000x.