Use of physiological parameters as fast tools to screen
for drought tolerance in sugarcane
Marcelo de A. Silva
1*, John L. Jifon
2, Jorge A.G. Da Silva
2and Vivek Sharma
21APTA Regional Centro-Oeste, 17201-970 Jaú, SP, Brazil. 2Texas Agricultural Experiment Station, Texas A&M University
System, Weslaco, TX, 78596, USA. *Corresponding author: [email protected]
Received: 25 July 2007; Returned for revision: 13 October 2007; Accepted: 05 December 2007
Use of physiological parameters as fast tools to screen for drought tolerance in sugarcane: Drought is one of the major limitations to plant productivity worldwide. Identifying suitable screening tools and quantifiable traits would facilitate the crop improvement process for drought tolerance. In the present study, we evaluated the ability of four relatively physiological parameters (variable-to-maximum chlorophyll a fluorescence ratio, F
v/Fm; estimated leaf chlorophyll content via SPAD index;
leaf temperature, LT; and, leaf relative water content, RWC) to distinguish between drought tolerant and susceptible sugarcane genotypes subjected to a 90-d drought cycle. Eight field-grown genotypes were studied. By 45 d after the onset of treatments, the F
v/Fm, SPAD index and RWC of drought-stressed plants had declined significantly in all genotypes compared
to values at the onset of well-watered treatments. However, the reductions were more severe in leaves of susceptible genotypes. Under drought stress, the tolerant genotypes as a group, maintained higher F
v/Fm (8%), SPAD index (15%), and
RWC (16%) than susceptible genotypes. In general, LT of drought-stressed plants was higher (~4°C) than that of well-watered plants but the relative increase was greater among drought susceptible genotypes. Under drought stress, LT of tolerant genotypes was on average 2.2°C lower than that of susceptible genotypes. The results are consistent with the tolerant-susceptible classification of these genotypes and indicate that these tools can be reliable in screening for drought tolerance, with Fv/Fm, SPAD index and LT having the added advantage of being nondestructive and easily and quickly assessed.
Key words: chlorophyll a fluorescence, relative water content, leaf temperature, Saccharum, water deficit
Uso de parâmetros fisiológicos como ferramentas rápidas para selecionartolerância à seca em cana-de-açúcar: A seca é uma das maiores limitações à produtividade das plantas em todo o mundo. Identificar ferramentas satisfatórias de seleção e características quantitativas facilitaria o processo de melhoramento de uma cultura para tolerância à seca. No presente estudo, foi avaliada a adequação de quatro parâmetros fisiológicos (razão entre fluorescências variável e máxima da clorofila a, Fv/Fm; estimativa do conteúdo de clorofila na folha via o índice SPAD; temperatura da folha, TF; e conteúdo relativo de água na folha, CRA) para distinguir entre genótipos de cana-de-açúcar tolerantes e suscetíveis submetidos a um ciclo de 90 dias de déficit hídrico. Foram avaliados oito genótipos, cultivados sob condições de campo. Aos 45 dias após o estabelecimento dos tratamentos, Fv/Fm, índice SPAD e CRA das plantas sob estresse declinaram significativamente em todos os genótipos, comparados aos respectivos controles sob condições ideais de irrigação. Entretanto, as reduções foram mais severas nas folhas dos genótipos suscetíveis à seca. Sob estresse hídrico, o grupo dos genótipos tolerantes manteve maiores valores de
Fv/Fm (8%), índice SPAD (15%) e CRA (16%) do que os dos genótipos suscetíveis. Em geral, TF das plantas sob estresse foi maior (~4oC) que TF das plantas sob condições ideais de água, mas o aumento relativo foi maior entre os genótipos
suscetíveis. Sob déficit hídrico, TF dos genótipos tolerantes foi, em média, 2,2oC menor do que a dos genótipos suscetíveis.
Os resultados são consistentes com a classificação desses genótipos como tolerantes/suscetíveis e indicam que essas ferramentas podem ser confiáveis na seleção para tolerância à seca, com Fv/Fm, índice SPAD e TF tendo a vantagem adicional de serem técnicas não-destrutivas e de fácil e rápido emprego.
INTRODUCTION
Sugarcane (Saccharum spp.) is an important crop globally not only for sugar production, but also increasingly as a bioenergy crop due to its phenomenal dry matter production capacity. Drought is one of the most important environmental stress factors limiting sugarcane production worldwide (Venkataramana et al., 1986). Due to the erratic nature of rainfall, sugarcane growers rely heavily on irrigation to meet production goals. However, water for irrigation is a limited and contentious resource and its effective management is critical, not only in reducing wasteful usage, but also in reducing production costs and sustaining productivity. Development of drought tolerant sugarcane germplasm is thus crucial for sustaining production in areas where water supply is limited.
Water deficit stress is known to alter a variety of physiological processes such as radiation capture, leaf temperature (LT), stomatal conductance, transpiration, electron transport, photosynthesis and respiration which ultimately determine yield (Qing et al.,2001). The amount of water used by a crop is closely associated with photosynthetic activity, dry matter production and yield in many species (Tollenaar and Aguilera, 1992; Qing et al., 2001). However, the maximum photosynthetic potential of crops is seldom reached due to unfavorable environmental factors, including drought.
The degree of limitation of yield by environmental stresses varies even among genotypes within a species (Wolfe et al., 1988; Aguilera et al., 1999). Therefore, the ability to maintain key physiological processes, such as photosynthesis during moderate drought stress, is indicative of the potential to sustain productivity under water shortage. For instance, differences in dry matter accumulation between old and new corn hybrids have been shown to depend on the ability to maintain higher photosynthetic rates after silking for newer hybrids (Tollenaar and Aguilera, 1992). O’Neill et al. (2006) also hypothesized that photosynthetic rates of drought tolerant corn hybrids were higher than those of susceptible hybrids during the critical post-flowering growth period and concluded that photosynthetic assessments during this growth stage could be useful in identifying stress tolerant genotypes.
In sugarcane, four distinct growth stages have been characterized, namely: germination, tillering, grand
growth and maturity (Gascho and Shih, 1983). The tillering and grand growth stages, known as the sugarcane formative phase, have been identified as the critical water demand period (Ramesh, 2000), mainly because this is the phase when 70-80% of cane yield is produced (Singh and Rao, 1987). Water relations and photosynthetic responses to water deficit stress during this growth stage could therefore be useful in identifying drought tolerant genotypes.
Although measurements of leaf photosynthesis rate have been shown to be reliable in distinguishing between drought tolerant and susceptible genotypes of some species such as sunflower (Gimenez et al., 1992), gas exchange techniques of assessing photosynthesis are laborious and not practical in crop improvement programs (Earl and Tollenaar, 1999). Rong-hua et al. (2006), working with barley, showed that indirect and faster methods of measuring photosynthetic activity, such as chlorophyll a fluorescence technique, par-ticularly the maximum photochemical efficiency of photosystem II – PSII (which can be assessed via the variable-to-maximum chlorophyll a fluorescence ratio, Fv/
F
m) and estimated chlorophyll content (SPAD index), can
be as effective as the more time-consuming gas exchange techniques in revealing differences between drought tolerant and susceptible genotypes. Other physiological parameters such as LT and relative water content (RWC) are also very responsive to drought stress and have been shown to correlate well with drought tolerance (Jamaux et al., 1997; Altinkut et al., 2001; Colom and Vazzana, 2003).
The reliability of these parameters to distinguish between stress tolerant and susceptible genotypes seems to depend on the species under consideration (Colom and Vazzana, 2003; O’Neill et al., 2006; Rong-hua et al., 2006) since different species may possess different mechanisms of stress resistance and/or tolerance. To o u r knowledge, no studies have evaluated these relationships in sugarcane. Careful selection of suitable physiological traits and rapid/nondestructive methods of quantifying them would be very valuable in improving drought tolerance. In the present study we evaluated the ability of four relatively rapid parameters, namely the Fv/
F
m ratio, the SPAD index, LT, and leaf RWC to distinguish
MATERIAL AND METHODS
This study was conducted near Weslaco (26o 12’ N,
97o 57’ W, elevation 18.90 m), TX, USA, during the
2005-2006 growing season in a commercial field with a sandy clay loam soil type. The experiment was arranged in a complete block design within a three-factor factorial, where the first factor was composed of eight genotypes; the second factor was composed by two irrigation levels (wet and dry), and the third factor composed of three evaluation dates (0, 45 and 90 d after water deficit imposition), with four replicates.
The eight sugarcane genotypes analyzed in this study were categorized into two groups based on long-term field observations (vigor) about yield performance under drought conditions in south Texas, USA: drought tolerant (HOCP85-845, TCP02-4587, TCP02-4620 and US01-40) and drought susceptible (CP72-1210, CP92-675, H99-295 and TCP02-4624). Each genotype was planted in three rows, 3 m long, and 1.5 m apart on 14 November 2005; data were collected only from plants in the central row.
Two irrigation treatments (well-watered and drought) were initiated at 180 d after planting, i.e. during the grand growth phase (Gascho and Shih, 1983). The well-watered plots were irrigated at 50% depletion of available soil moisture (DASM), whereas drought plots were irrigated at 80% DASM. Soil moisture depletion was monitored periodically with a neutron probe.
Physiological parameters were measured three times during the study: at 0, 45 and 90 d after the onset of irrigation treatments (DAT) on cloudless days and between approximately 0900 h and 1500 h. Chlorophyll a
fluorescence characteristics were measured on intact leaves using a pulse amplitude modulation fluorometer (Model OS5-FL, Opti-Sciences, Tyngsboro, MA, USA), and used to estimate the extent of drought-induced photoinhibition. During each measurement date, at least four leaves per plot were dark-adapted for 30 min using leaf clips (FL-DC, Opti-Science) before fluorescence measurements. The Fv/Fm ratio parameter was determined following the procedures of Maxwell and Johnson (2000), and used as to quantify the degree of drought-induced photoinhibition.
Leaf chlorophyll content (SPAD index) was estimated nondestructively, using a SPAD-502 chlorophyll meter (Minolta Corp., Ramsey, NJ, USA). This index was used preferentially because the strong relationship between
readings of portable chlorophyll meter and leaf chlorophyll content has been demonstrated by several authors (e.g. Yadava, 1986; Marquard and Tipton, 1987, Markwell et al., 1995). The average of five measurements taken on different plants in each plot was recorded.
Leaf temperature readings were collected using a hand-held infrared thermometer (Model OS530HR, Omega Engineering Inc., Stamford CT, USA) with leaf emissivity set at 0.95. During each LT measurement, the natural leaf orientation with respect to the sun was maintained to avoid shade effects.
Following the LT measurements, leaf disks (1.3 cm diameter each) were collected with a cork borer from the same leaves used for Fv/Fm, SPAD index and LT measurements and used to determine leaf relative water content (RWC) following the method of Matin et al. (1989). Five disks per plant were collected, immediately sealed in glass vials and quickly transported to the laboratory in an ice-cooled chest. Leaf disk fresh weights were determined within 2 h after excision. The turgid weight was obtained after rehydration in deionized water for 24 h at room temperature. After rehydration, leaves were quickly and carefully blotted dry with lint-free tissue paper before determining turgid weight. Dry weights were recorded after oven-drying leaf samples for 48 h at 80ºC.
The cane productivity was calculated from the weight of all millable canes per plot and the area occupied by each plot (t ha-1) at 425 d after trial planting.
Data were subjected to an analysis of variance (ANOVA) and where appropriate, mean separation was performed using the least significance difference (LSD; P
< 0.05) procedures of the SPSS statistical package (SPSS Student version 15.0). Genotypes and irrigation treat-ments were considered fixed effects and replication random effects. Evaluation dates were repeated observations in the analysis. Linear correlation analysis was used to determine the association among Fv/Fm, SPAD index, LT, leaf RWC, and stalk productivity on each date.
RESULTS AND DISCUSSION
Average air temperatures during the study period (November 2005 to August 2006) ranged from ca. 20 to ca.
the wet and dry treatments respectively, applied in eight (wet) and five (dry) irrigation events.
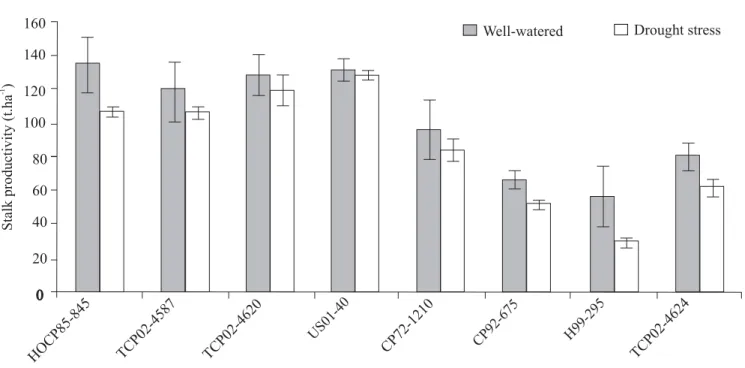
According to Kumar (2005), a plant or a group of plants showing better growth and productivity with limited soil moisture than other plants in a given set of similar environments is understood to be tolerant to drought. Bearing this definition in mind and based on the long-term yield performance under drought conditions in south Texas, the genotypes TCP02-4587, TCP02-4620, US01-40 and HOCP85-845 were considered drought tolerant. However, as Figure 2 shows, in the current experiment crop yield for HOCP85-845 differed significantly under well-watered (135.2 t.ha-1) and
drought-stress conditions (107.0 t.ha-1), although the
genotype was able to maintain relatively high yield under both watering conditions. The genotypes CP92-675, H99-295, TCP02-4624 and CP72-1210 were considered drought susceptible; in this group crop yield of the first three genotypes significantly decreased in response to water deficit application, but not that of CP72-1210 (Figure 2).
Significant genotype by irrigation (GxW), genotype by evaluation date (GxD) and irrigation by evaluation date (WxD) interactions were observed for photosystem II (PSII) photochemical efficiency (Fv/Fm) measurements (Table 1). Under well-watered conditions, tolerant as well as susceptible genotypes maintained high Fv/Fm values (~0.82-0.83) similar to those of healthy leaves (Hall and
Rao, 1994). Drought stress generally resulted in decreased F
v/Fm, which was evident only in
drought-susceptible genotypes (Tables 2 and 3). Stress-induced reduction in Fv/Fm is indicative of photoinhibition associated with an over-reduction of PSII (Maxwell and Johnson, 2000). The ability to maintain high Fv/Fm under drought stress thus indicates a high efficiency of radiation use possibly for photochemistry and carbon assimilation. Colom and Vazzana (2003) have reported similar correlations between Fv/Fm and drought tolerance in Erasgrostis curvula cultivars, with high F
v/Fm values
being associated with drought tolerance and low Fv/Fm
values being associated with susceptibility to drought stress. The relatively rapid response of Fv/Fm to mild drought stress makes it a promising trait for screening sugarcane germplasm for drought tolerance.
Estimated leaf chlorophyll content (SPAD index) responses to drought stress were similar to those obtained for Fv/Fm with the exception of the non-significant GxD interaction. SPAD index was non-significantly affected by GxW and WxD interactions (Table 1). SPAD index declined progressively with exposure to drought but the decline was more severe in genotypes from the susceptible group, as could be deduced from Tables 2 and 3. TCP02-4587 had the highest SPAD index values under drought conditions and TCP02-4624 had the lowest ones (Tables 2 and 3). Chlorophyll degradation is one of
Figure 1. Monthly maximum and minimum mean air temperature, total rainfall and irrigation for wet and dry treatments during November 2005 to August 2006.
0 10 20 30 40 50 60 70 80
Nov.05 Dec.05 Jan.06 Feb.06 Mar.06 Apr.06 May.06 Jun.06 Jul.06 Aug.06
Date
mm
0 5 10 15 20 25 30 35 40
o C
Rainfall Irrigation-Wet Irrigation-Dry
the consequences of drought stress that may result from sustained photoinhibition and photo-bleaching (Long et al., 1994), and even though other plant processes, such as cell division and cell expansion are the earliest to respond to water deficit stress (Dale, 1988), a decline in SPAD index is a sensitive and readily measurable trait that could be used to screen for stress tolerance (O’Neill et al., 2006). The distribution of SPAD index values among the sugarcane genotypes used in this study is consistent with their tolerance-susceptibility classification, with the exception of the genotype TCP02-4587 at 90 DAT.
Drought stress generally resulted in an increase in LT for all the genotypes, regardless of tolerance-susceptibility classification (Tables 1, 2 and 3). However, LT of some susceptible genotypes (CP92-675 and H99-295) responded sharper to drought stress (by 45 DAT) than that of tolerant genotypes (Table 2). The highest average increase in LT was observed in TCP02-4624 (a susceptible genotype) whereas the lowest average increase was recorded for US01-40 (a tolerant genotype; Table 2). Overall, genotypes classified as susceptible generally had higher average LT readings (~37°C) under drought stress conditions than those classified as tolerant (~35°C; Table 3). The increase in LT was
probably due to reduced evapotranspirational cooling, resulting from drought-induced stomatal closure. As stomata close in response to water deficit stress, transpirational cooling ceases, leading to a rise in leaf temperature (Luquet et al., 2003; Jones, 2004). While this physiological response to increasing water stress can help prevent development of lethal water deficits, it can also lead to lethal temperatures under warm sunny conditions. The relatively lower LT of the tolerant genotypes results from mechanisms maintaining a more favorable leaf water status and hence more open stomata and sustained transpirational cooling. As a consequence, CO2 influx towards chloroplasts may be sustained longer, thus allowing greater photosynthetic rates and, ultimately, crop yield (Kumar, 2005). Although there was more variability in the LT data compared to F
v/Fm and
SPAD index, perhaps due to changing wind conditions and reflection of solar radiation during measurements, drought induced differences between the tolerant and susceptible genotypes were still apparent. Leigh et al. (2006) have shown that when measuring LT under sunlit conditions, excessive reflection of solar radiation can lead to overestimation of LT. This problem can be significant especially when working with plant canopies. For leaf-level studies, temporary shading of the leaf
Figure 2. Stalk productivity of eight sugarcane genotypes under well-watered (W) or drought (D) conditions.Data are means ± SE of four replicates.
160
140
120
100
80
60
40
20
0
HOCP85-845 TCP02-4587 TCP02-4620
US01-40
CP72-1210 CP92-675 H99-295 TCP02-4624
Well-watered Drought stress
Stalk
productivity
(t.ha
)
before measurement can provide a good estimate of the original sunlit leaf temperature.
Leaf relative water content (RWC) was the only parameter for which the GxWxD interaction was significant (Table 1). At the onset of differential irrigation treatments RWC was similar (~90%) among all genotypes (Table 2) but water deficit stress resulted in progressive decline in RWC (Tables 2 and 3). By 45 DAT, significant differences in RWC had developed with genotypes from the tolerant group maintaining a relatively higher average RWC (~87%) than those in the susceptible group (~80%, Table 2). This trend was more evident at 90 DAT (Table 3). On average, drought-induced reduction in RWC occurred to a greater extent in the drought-susceptible genotype
CP92-675 (21.6%), and to a lesser degree in the tolerant TCP02-4587 (1.7%). The average drought-induced reduction in RWC was 4.1% for the tolerant group and 14.3% for the susceptible group. All the genotypes in the tolerant group in this study had relatively high RWC values compared to those in the susceptible group thus confirming their empirical classification as drought tolerant. Such genotypes would possibly maintain protoplast hydration for a longer duration under water deficit stress conditions and thus ensure productivity in semi-arid regions. In fact, RWC is a key indicator of the degree of cell and tissue hydration, which is crucial for optimum physiological functioning and growth processes. Numerous studies have shown that
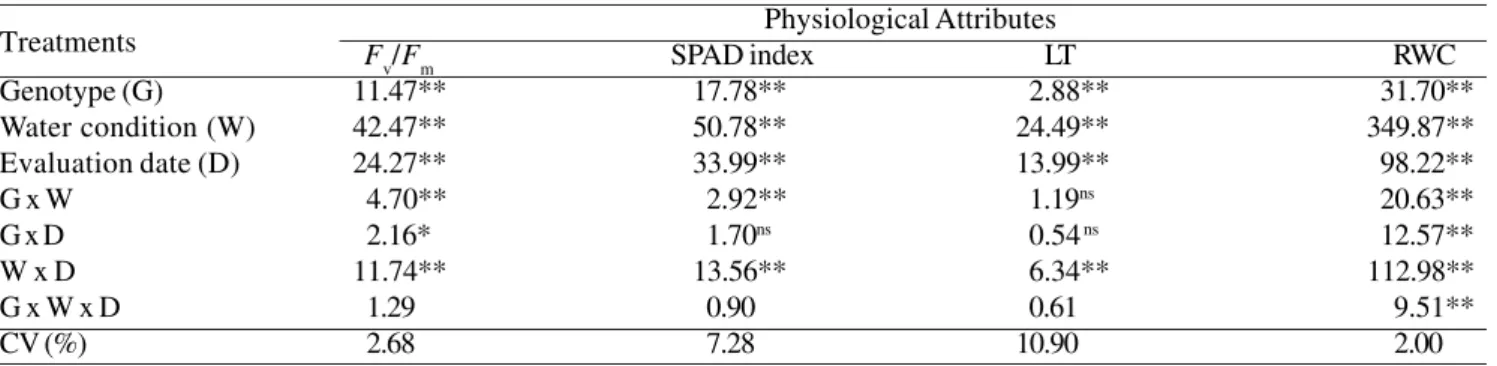
main-Table 1. Analysis of variance (F values) for PSII photochemical efficiency (Fv/Fm), estimated chlorophyll content (SPAD index), leaf temperature (LT) and leaf relative water content (RWC) of eight sugarcane genotypes grown under well-watered and drought conditions and measured on three dates. * P < 0.05; ** P < 0.01.
Physiological Attributes
Treatments F
v/Fm SPAD index LT RWC
Genotype (G) 11.47** 17.78** 2.88** 31.70**
Water condition (W) 42.47** 50.78** 24.49** 349.87**
Evaluation date (D) 24.27** 33.99** 13.99** 98.22**
G x W 4.70** 2.92** 1.19ns 20.63**
G x D 2.16* 1.70ns 0.54 ns 12.57**
W x D 11.74** 13.56** 6.34** 112.98**
G x W x D 1.29 0.90 0.61 9.51**
CV (%) 2.68 7.28 10.90 2.00
Genotypes Fv/Fm SPAD index LT (
oC) RWC (%)
+W -W +W -W +W -W +W -W
Tolerant
HOCP85-845 0.820 a 0.825 a 41.97 a 41.42 a 29.95 a 32.07 a 88.97 a 88.38 a
TCP02-4587 0.822 a 0.822 a 48.60 a 44.42 a 28.72 a 32.55 a 88.16 a 87.30 a
TCP02-4620 0.845 a 0.835 a 41.55 a 40.32 a 27.87 a 30.35 a 89.53 a 87.11 b
US01-40 0.827 a 0.830 a 39.90 a 38.25 a 30.07 a 29.85 a 88.47 a 85.47 b
Mean 0.827 a 0.827 a 43.01 a 41.11 a 29.78 a 30.59 a 88.78 a 87.06 b
Susceptible
CP72-1210 0.820 a 0.742 b 44.22 a 40.60 a 30.97 a 34.82 a 88.89 a 80.21 b
CP92-675 0.815 a 0.770 b 46.35 a 37.75 b 29.52 b 36.40 a 88.63 a 82.88 b
H99-295 0.822 a 0.775 b 41.45 a 34.95 b 29.27 b 38.12 a 89.14 a 81.70 b
TCP02-4624 0.820 a 0.792 a 38.30 a 32.92 b 31.87 a 35.72 a 88.75 a 78.90 b
Mean 0.817 a 0.767 b 42.58 a 36.56 b 30.41 b 36.27 a 88.86 a 80.93 b
Table 2. Chlorophyll fluorescence (F
v/Fm), estimated chlorophyll content (SPAD index), leaf temperature (LT) and leaf
Table 3. Chlorophyll fluorescence (F
v/Fm), estimated chlorophyll content (SPAD index), leaf temperature (LT) and leaf
relative water content (RWC) of eight sugarcane genotypes grown under well-watered (+W) or drought (-W) conditions. Measurements were taken at 90 days after the onset of treatments. Statistics as in Table 2.
Genotype Fv/Fm SPAD index LT (ºC) RWC (%)
+W -W +W -W +W -W +W -W
Tolerant
HOCP85-845 0.822 a 0.817 a 42.00 a 39.20 a 32.07 a 35.50 a 89.03 a 86.18 b
TCP02-4587 0.817 a 0.810 a 47.72 a 41.75 b 31.22 a 34.80 a 88.62 a 86.92 a
TCP02-4620 0.840 a 0.822 a 41.40 a 39.60 a 31.62 a 34.62 a 91.20 a 86.75 b
US01-40 0.830 a 0.817 a 38.45 a 36.92 a 31.57 a 34.17 a 90.20 a 82.95 b
Mean 0.827 a 0.815 a 42.39 a 39.37 b 31.60 a 34.78 a 89.76 a 85.70 b
Susceptible
CP72-1210 0.815 a 0.735 b 43.67 a 37.02 b 32.75 a 36.30 a 88.18 a 80.22 b
CP92-675 0.815 a 0.757 b 46.85 a 34.10 b 31.87 b 37.12 a 87.41 a 65.77 b
H99-295 0.812 a 0.762 b 41.22 a 33.87 b 31.75 b 37.35 a 87.29 a 74.61 b
TCP02-4624 0.815 a 0.752 b 38.52 a 32.20 b 31.30 b 37.40 a 90.84 a 75.81 b
Mean 0.814 a 0.752 b 42.57 a 34.30 b 31.92 b 37.04 a 88.43 a 74.10 b
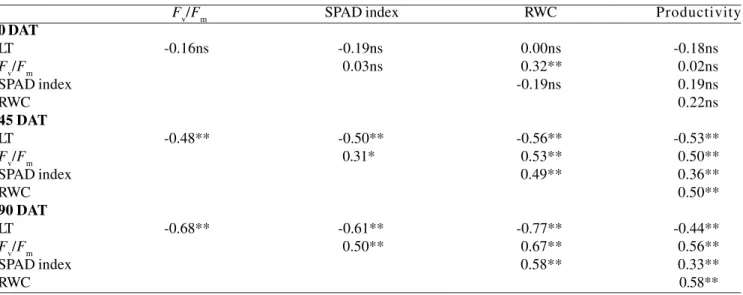
Table 4. Pearson’s correlation coefficients for association amongchlorophyll fluorescence (Fv/Fm), estimated chlorophyll content (SPAD index), leaf temperature (LT), leaf relative water content (RWC) and stalk productivity of eight sugarcane genotypes grown under two watering treatments measured on 0, 45 and 90 days after treatment imposition (DAT). ns, not significant; * P < 0.05; ** P < 0.01.
Fv/Fm SPAD index RWC Productivity
0 DAT
LT -0.16ns -0.19ns 0.00ns -0.18ns
Fv/Fm 0.03ns 0.32** 0.02ns
SPAD index -0.19ns 0.19ns
RWC 0.22ns
45 DAT
LT -0.48** -0.50** -0.56** -0.53**
Fv/Fm 0.31* 0.53** 0.50**
SPAD index 0.49** 0.36**
RWC 0.50**
90 DAT
LT -0.68** -0.61** -0.77** -0.44**
Fv/Fm 0.50** 0.67** 0.56**
SPAD index 0.58** 0.33**
RWC 0.58**
tenance of a relatively high RWC during mild drought is indicative of drought tolerance (Jamaux et al., 1997; Altinkut et al., 2001; Colom and Vazzana, 2003).
Before the onset of treatments there was no significant correlation between the parameters, with the exception of a positive association between Fv/Fm and RWC (Table 4). A modest, although significant, positive correlation was found among F
v/Fm, SPAD index and
RWC as well at 45 DAT as at 90 DAT. The degree of
results demonstrated that all traits were affected mutually, positively or negatively, and were consistent in response to water deficit condition. Therefore, these parameters might be used as a selection criterion for stalk productivity in sugarcane under drought stress. This is in accordance to Araus et al. (1998), O’Neill et al. (2006) and Rong-hua et al. (2006) that worked with wheat, corn and barley, respectively.
Water shortage is one of the major limitations to productivity worldwide and a possible solution is to improve the drought tolerance of crop varieties through breeding. To achieve this goal, a set of reliable traits that can be rapidly and relatively inexpensively screened is needed. Overall, the lack of yield reduction after 90 days of water stress observed for the tolerant genotypes and the considerable correlation with the parameters studied turns this approach quite attractive. Although all the traits and techniques evaluated in this study were reliable in distinguishing between tolerant and susceptible sugarcane genotypes, chlorophyll fluorescence, SPAD index and thermal imaging seem to be the most promising for rapid and nondestructive screening for drought tolerance. As sugarcane is a long cycle crop, the best responses for screening for drought tolerant genotypes could be achieved after 90 d under water limitation during the grand growth phase.
Acknowledgments: The authors thank the Conselho Nacional de Desenvolvimento Científico e Tecnológico (CNPq, Brazil) for a fellowship award (Proc. 201076/2005-5) to the first author. This research was also supported by a U.S. Department of Agriculture grant (CSREES No. 2005-34461-15661 ‘Rio Grande Basin Initiative’). Special thanks also to Dr. Juan Enciso, Xavier Peries and Jose Morales for valuable assistance with soil moisture measurements.
REFERENCES
Aguilera C, Stirling CM, Long SP (1999) Genotypes
variation within Zea mays for susceptibility to and rate
of recovery from chill-induced photoinhibition of photosynthesis. Physiol. Plant. 106:429-436.
Altinkut A, Kazan K, Ipekci Z, Gozukirmizi N (2001) Tolerance to paraquat is correlated with the traits associated with water stress tolerance in segregating
F2 populations of barley and wheat. Euphytica
121:81-86.
Araus JL, Amaro T, Voltas J, Nakkoul H, Nachit MM (1998) Chlorophyll fluorescence as a selection criterion for grain yield in durum wheat under Mediterranean conditions. Field Crops Res. 55:209-223.
Colom MR, Vazzana C (2003) Photosynthesis and PSII functionality of resistant and drought-sensitive weeping lovegrass plants. Environ. Exp. Bot. 49:135-144.
Dale JE (1988) The control of leaf expansion. Annu. Rev. Plant Physiol. Plant Mol. Biol. 39:267-295.
Earl HJ, Tollenaar M (1999) Using chlorophyll fluorometry to compare photosynthetic performance of commercial
maize (Zea mays L.) hybrids in the field. Field Crops
Res. 61:201-210.
Gascho GJ, Shih SF (1983) Sugarcane. In: I.D. Teare and M.M. Peet (eds), Crop Water Relations, pp.445-479. John Wiley & Sons, New York.
Gimenez C, Mitchell VJ, Lawlor DW (1992) Regulation of photosynthetic rate of two sunflower hybrids under water stress. Plant Physiol. 96:635-643.
Hall DO, Rao KK (1994) Photosynthesis. 5th ed.
Cambridge University Press, Cambridge.
Jamaux I, Steinmertz A, Belhassen E (1997) Looking for molecular and physiological markers of osmotic adjustment in sunflower. New Phytol. 137:117-127. Jones HG (2004) Application of thermal imaging and
infrared sensing in plant physiology and ecophys-iology. Adv. Bot. Res. 41:107–163.
Kumar D (2005) Breeding for drought resistance. In: Ashraf M, Harris PJC (eds), Abiotic stresses: Plant Resistance t h r o u g h B r e e d i n g a n d M o l e c u l a r A p p r o a c h e s , pp.145-175. The Haworth Press, New York.
Leigh A, Close JD, Ball MC, Siebke K, Nicotra AB (2006) Leaf cooling curves: measuring leaf temperature in sunlight. Funct. Plant Biol. 33:515-519.
Long SP, Humphries S, Falkowski PG (1994) Photoinhibition of photosynthesis in nature. Annu. Rev. Plant Physiol. Plant Mol. Biol. 45:633-662. Luquet D, Begue A, Vidal A, Clouvel P, Dauzat J, Olioso A,
Markwell J, Osterman JC, Mitchell JL (1995) Calibration of the Minolta SPAD-502 leaf chlorophyll meter. Photosynth. Res. 46:467-472.
Marquard RD, Tipton JL (1987) Relationship between
extractable chlorophyll and an in situ method to
estimate leaf greenness. HortScience 22:1327.
Matin MA, Brown JH, Ferguson H (1989) Leaf water potential, relative water content, and diffusive resistance as screening techniques for drought resistance in barley. Agron. J. 81:100-105.
Maxwell K, Johnson GN (2000) Chlorophyll fluorescence – a practical guide. J. Exp. Bot. 51:659-668.
O’Neill PM, Shanahan JF, Schepers JS (2006) Use of chlorophyll fluorescence assessments to differentiate corn hybrid response to variable water conditions. Crop Sci. 46:681-687.
Qing ZM, Jing LG, Kai CR (2001) Photosynthesis characteristics in eleven cultivars of sugarcane and their responses to water stress during the elongation stage. Proc. ISSCT 24:642-643.
Ramesh P (2000) Effect of different levels of drought during the formative phase on growth parameters and
its relationship with dry matter accumulation in sugarcane. J. Agron. Crop Sci. 185:83-89.
Rong-hua L, Pei-guo G, Baum M, Grando S, Ceccarelli S (2006) Evaluation of chlorophyll content and fluorescence parameters as indicators of drought tolerance in barley. Agric. Sci. China 5:751-757. Singh S, Rao PNG (1987) Varietal differences in growth
characteristics in sugarcane. J. Agri. Sci. 108:245-247. Tollenaar M, Aguilera A (1992) Radiation use efficiency of
an old and new maize hybrid. Agron. J. 84:536-541. Venkataramana S, Guruja RPN, Naidu KM (1986) The
effects of water stress during the formative phase on stomatal resistance and leaf water potential and its relationship with yield in ten sugarcane varieties. Field Crops Res. 13:345-353.
Wolfe DW, Henderson DW, Hsaio TC, Alvino A (1988) Interactive water and nitrogen effects on senescence of maize: II. Photosynthetic decline and longevity of individual leaves. Agron. J. 80:865-870.