A Cross-Age Study of Students’ Understanding of
Fractals
Um Estudo sobre o Modo como Alunos Compreendem
Fractais
*
Abstract
The purpose of this study is to examine how students understand fractals depending on age. Students’ understandings were examined in four dimensions: defining fractals, determining fractals, finding fractal patterns rules and mathematical operations with fractals. The study was conducted with 187 students (grades 8, 9, 10) by using a two-tier test consisting of nine questions prepared based on the literature and Turkish mathematics and geometry curriculums. The findings showed that in all grades, students may have misunderstandings and lack of knowledge about fractals. Moreover, students can identify and determine the fractals, but when the grade level increased, this success decreases. Although students were able to intuitively determine a shape as fractal or not, they had some problems in finding pattern rules and formulizing them.
Keywords: Fractal Geometry. Students’ Understandings. Cross-age Study.
Resumo
O objetivo deste estudo é analisar como os alunos compreendem fractais, dependendo da idade. Entendimentos dos alunos foram examinados em quatro dimensões: a definição de fractais, determinando fractais, encontrando padrões fractais e operações matemáticas com fractais. O estudo foi conduzido com 187 estudantes do Ensino Fundamental e Médio (grau 8, 9, 10) usando um teste de dois níveis composto de nove questões
* PhD in Mathematics Education at Karadeniz Teknik University, Trabzon, Turkey. Professor in
elaboradas por meio da literatura nos currículos turcos em matemática e geometria. Os resultados mostraram que em todos os graus, os alunos podem ter falta e conhecimentos equivocados sobre fractais. Além disso, os estudantes podem identificar e determinar os fractais, mas quando o nível de ensino aumenta, a identificação e a determinação dos fractais diminui. Embora, os alunos pudessem determinar intuitivamente uma forma como fractal ou não, eles tiveram alguns problemas em encontrar regras e padrões na formulação dos fractais.
Palavras-chave: Geometria Fractal. Entendimentos dos Alunos. Faixa-etária do Estudo.
1 Introduction
Fractal Geometry, which differs from traditional geometry, is a relatively new and important area of Mathematics and Mathematics Education. In recent years, Fractal Geometry appears in many mathematics curricula with the reforms in Mathematics Education. Although there is a desire to include fractals in the mathematics curriculum, there is little knowledge of how students would learn the content and react to them. Revealing students’ knowledge and understandings about fractals in the current mathematics curriculum is important for determining possible difficulties of the subject and overcoming the difficulties. Moreover, revealing knowledge and understandings about fractals of students at differing grade levels may provide clues about kinds of changes in these students’ knowledge and understandings. It is known that at some grades, students experience conceptual difficulties regarding fractals (BOWERS, 1991;
LANGILLE, 1996; KOMOREK et al., 2001; , 2011).
1.1 Students’ understanding of fractals
Studies about teaching and learning Fractal Geometry have been divided into two subsections: theory and practices.
subjects, what kind of knowledge and understandings they have and what kind of difficulties they have. For example, Bowers (1991) conducted a study about
teaching fractals with three 12th grade students. In this study, Bowers examined
students’ difficulties in forming the meaning of fractal concept, their understandings related to fractal concept and in which environments this concept can be taught. Bowers (1991) determined that students have difficulties in three subjects in learning of fractals. The first difficulty is learning fractal dimension, the second one is determining the scaling factor in the self-similar parts and the third is construction of a fractal which is not obvious. Bowers especially stated that students’ difficulties in determining the differences between the process of building the object and the object itself, and difficulties in understanding the relation between iterative process and the definition of the fractal, presented obstacles to the students understanding of fractals. Also, Bowers claimed that another reason for students’ difficulties in understanding fractals is an epistemological obstacle about fractals. Similarly, Langille (1996) conducted a
study about integration of fractal geometry into the 12th grade mathematics
curriculum. He determined that students have difficulties in understanding dimension, self-similarity dimension and in determining characteristics of fractals. Komorek et al. (2001) investigated that teaching fractal geometry and chaos theory in science education is suitable or not for aged between 15-17 students. The results of the study revealed that students can determine an objects’ self-similarity intuitively, but they have difficulties in defining self-self-similarity mathematically and in determining the magnification factor (scaling ratio).
(2011) determined that pre-service teachers can generally decide whether a given shape is a fractal or not, but they have difficulties in finding patterns about perimeter and area of fractals and learning of fractal dimension. He stated that pre-service teachers have difficulties in determining self-similar parts number and magnification factor in calculating the fractal dimension of an object. Moreover, self-similarity of natural objects is another obstacle for pre-service teachers in forming self-similarity concepts in their minds. The most important reason for this, according to the author, was the definition used in the explanation of self-similarity concept. Because the definition of self-similarity based on the comparison of part and whole of a fractal was inadequate.
1.2 The purpose of the study
students know about fractals, or how students’ understanding about fractals changes with respect to grade level. Therefore the present work seeks to investigate this gap in the literature and focused on how students understand fractals. In this context, the study aims to examine how students understand the fractals depending on their age.
2 Method
2.1 The context of the study
The schooling system in Turkey consists of three main components: basic education (elementary schools, age 6-14; 8 years), which is compulsory; secondary education (lycees or senior high schools, age 14-17; 4 years), and higher education (colleges and universities) (ÇALIK, 2005). All schools throughout the country must use the same curricula, which is prepared and implemented by the National Ministry of Education (MEB) (TURKEY, 2005).
In Turkish educational system, teaching of fractals begins with an introduction to fractals at the age of 13-14 years in Grade 8. The Grade 8 mathematics curriculum includes a goal about fractals “To build patterns from line, polygon and circle models, to draw them and to determine fractals from these patterns” (TURKEY, 2008, p. 316). The goal was prepared in terms of building fractal patterns by using figures in Euclid Geometry or deciding whether given patterns are fractals or not. In that grade, fractals are taught by drawing activities and finding fractal patterns. Moreover, there are natural fractal examples such as ferns or tree branches in the Grade 8 mathematics curriculum. Fractal activities related to finding similar patterns such as triangle numbers, edge numbers and corner numbers in the fractal generation steps are taught to students aged between 14-15 years (Grade 9). However, there is not a direct goal related to teaching fractals in the Grade 9 geometry curriculum. Finding fractal patterns and mathematical operations with them are taught to students aged 16-17 years (Grade 10). There are two goals about fractals in the Grade 10 geometry curriculum. The first goal is “To build fractals with segments, to explain them and to compute the length of the fractal in a particular step” (TURKEY, 2010, p. 153) and the second is “To build fractals with triangles, to explain them and to compute the area of fractal image in a particular step” (TURKEY, 2010, p. 157).
are studied as follows; recognition of fractals in Grade 8, finding patterns and mathematical operations with them in Grades 9 and 10.
2.2 Instrument and data collection procedure
To examine students’ understandings, according to their grade levels and comprehension, cross-age and longitudinal studies are generally used (ABRAHAM et al., 1994; COHEN et al., 2007). However, Abraham et al. (1994) have implied that when time is limited, cross-age studies are more suitable than longitudinal studies. Also, a number of researchers have reported successful cross-age studies (e.g., SHARPLEY et al., 1983; TOPPING et al., 2003; et al., 2011). Therefore, in this study, a cross-age study was undertaken for grades 8-10.
A paper-pencil test comprising nine two-tier questions was prepared (Appendix). The first part of the questions consists of multiple choices and the other part of the questions requires students to explain their reason why they selected this choice. These kinds of two-tier questions are useful because they identify alternative conceptions along with the underlying reasons (ÇALIK, 2005). The test contains four main categories. These categories and their aims are summarized in Frame 1.
Before administering the final form of the test, a group consisting of mathematics educators and mathematics teachers checked the validity of test items and agreed that the items were valid and appropriate to measure students’ understanding of the fractals.
2.3 Sample
The sample consisted of 187 students in different grades that ranged from Grade 8 (13-14 years) to Grade 10 (16-17 years). There were 72 students from Grade 8, 69 students from Grade 9 and 46 students from Grade 10. The sample was selected at random from one elementary and two secondary schools in the city of Trabzon in Turkey. The concepts were initially introduced to students in Grade 8 and then the concepts were introduced at a more advanced level to the students in Grades 9 and 10.
2.4 Data analysis
The following categorizations were used to analyze students’ test responses: a correct choice with the correct reason (6 points), a correct choice with partially correct reason (5 points), incorrect (or no selected) choice but correct reason (4 points), incorrect choice with partially correct reason (3 points), correct choice but inadequate/weak correct reason (2 points), correct choice (1 point), incorrect choice/no answer (0 points). The use of these classification criteria for student responses provides an opportunity to compare students´ understanding to researchers (ÇALIK, 2005). Some researchers (e.g. ÇALIK,
2005; et al., 2011) used similar categories for examining students’
understandings. Differences among group test scores were investigated by traditional statistical means using parametric tests: one-way ANOVA and Tukey.
3 Results
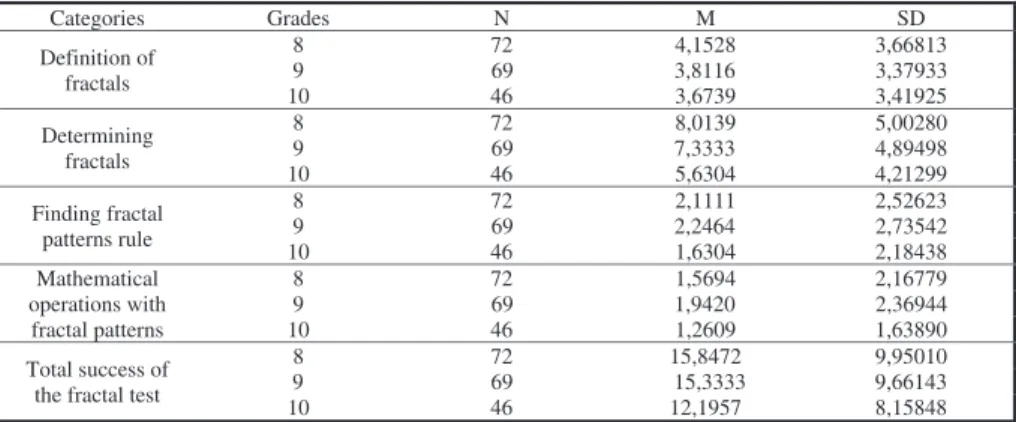
Table 1 – The means and standard deviations of student scores on the fractal test
Source: Research data
When the students’ scores are examined, it can be seen that while the
performances of the 8th grade students were highest in the categories of definition
of fractals, determining fractals and the total success of fractal test (M=4,15,
SD=3,67; M=8,01, SD=5,00; M=15,85, SD=9,95, respectively), the 9th grade
students scored highest in the categories of finding fractal patterns’ rule and mathematical operations with fractal patterns (M=2,25, SD=2,75; M=1,94,
SD=2,37, respectively). However, the 10th grade students had the lowest
performance in all categories.
Students’ answers for item 1 and item 3 on the fractal test form the category of definition of fractals. In that category, maximum mean score should be 12, but as can be seen in Table 1, grades’ mean scores were lower than maximum mean score (respectively M= 4,15 (%34,6); M=3,81 (%32,8); M= 3,67 (%30,6)). This result shows that students have misunderstandings about the definition of fractals.
Similarly, students’ answers for item 2, item 4 and item 6 on the fractal test form the category of determining fractals. In that category, maximum mean score should be 18, but as shown in Table 1, grades’ mean scores were lower than maximum mean score (M= 8,01 (%44,5); M=7,33 (%40,7); M= 5,63 (%31,3), respectively). This result shows that students can identify and determine the fractals, but when the grade level increased, this success decreased.
maximum mean score (M= 2,11 (%17,6); M=2,25 (%18,8); M= 1,63 (%13,6), respectively). This result shows that students have difficulty identifying the formation rule of fractal patterns.
Students’ answers for item 8 and item 9 on the fractal test form the category of mathematical operations with fractal patterns. In that category, maximum mean score should be 12, but as can be seen in Table 1, grades’ mean scores were lower than maximum mean score (M= 1,57 (%13,1); M=1,94 (%16,2); M= 1,26 (%10,5), respectively). This result shows that students have difficulty in carrying out mathematical operations with fractal patterns.
Total success of the fractal test, maximum mean score should be 54, but as shown in Table 1, grades’ mean scores were lower (M= 15,85 (%29,4); M=15,33 (%28,4); M=12,20 (%22,59), respectively). This result shows that students’ understandings about fractals are low in all grades according to the fractal test.
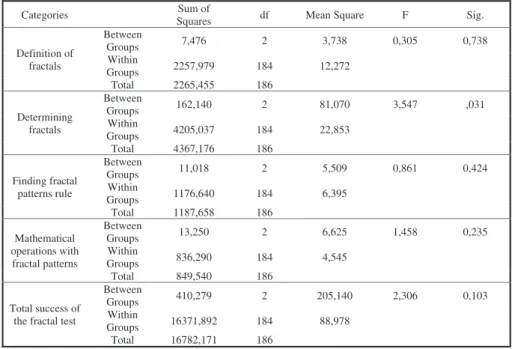
The one way ANOVA – one way analysis of variance – was applied in order to compare fractal test scores for each grade. The result of the one way ANOVA test is shown in Table 2.
Table 2 – One-way ANOVA results of the students related to the fractal test
As shown in Table 2, there was no statistically significant difference found in the category of definition of fractals (F(2,184) = 0,305; p = 0,738x), finding fractal patterns’ rule (F (2,184) = 0,861, p = 0,424), mathematical operations with fractal patterns (F(2,184) = 1,458; p = 0,235)) and total success of the fractal test (F(2,184) = 2,306, p = 0,103). However, a significant difference was found in the category of determining fractals (F(2,184) = 3,547, p = 0,031). Table 3 shows the results of the Tukey test performed according to the scores of students related to the category of determining fractals.
Table 3 – Results of the Tukey test related to the category of determining fractals
Source: Research data
As a result of the Tukey test performed in order to determine the source
of significant differentiation observed, 8th graders were found to be more
successful than 10th graders (p<0.05). Moreover, there was no statistically
significant difference found between grade 8 and grade 9; grade 9 and grade 10 (p<0.05).
4 Discussion and conclusion
The result of the one-way ANOVA test showed no statistically significant differences between the total successes of the grades, but looking at the total scores of students in all grades, the grade 10 students were found to be considerably less successful than the other students and the grade 8 students were the most successful. We expected that the success of the grades would increase from grade 8 to grade 10. The reason may be the insufficiency of teachers with respect to teaching fractals. Teachers in Turkey have not attended
any in-service courses about fractals (BAKI et al., 2008; , 2011).
Moreover, teaching fractals has continued in grade 8 for three years, in grade 9 for two years and in grade 10 for a year. So, the subject is also new for students.
Furthermore, the inadequacy of textbooks may be another reason. and
of all the grades was very low. This shows that in all grades, students may have lack of knowledge and misunderstanding about fractals.
In the category of fractal definition, despite not finding statistically significant differences among grades, according to the scores, grade 8 students define fractal more correctly than the students in other grades. The reason for this may be that there is a definition of fractal only in grade 8 textbooks. In grade 9 and grade 10, there is no definition for fractals. However, the total scores of all grades with respect to the category of fractal definition were low. One of the reasons of this low average maybe that the definition of a fractal is not exactly clear as Bowers (1991) stated, since students may not understand in which step fractal is formed when they were transforming a familiar geometric shape into another shape by iterating in an order. Another reason may be the curriculum, as features of fractals such as self-similarity and iteration were not focused on
( ; BAKI, 2011).
In the category of determining fractals, statistically significant differences
were found between grades 8 and 10, with the 8th graders performing better.
Grade 8 students can identify and determine the fractals, but when the grade level increases, this success decreases. The reason for that can be that in the grade 8 curriculum, more activities for determining and building fractals were included. It can be said that the current mathematics and geometry curricula have an effect on this. Furthermore, looking at the total scores of the grades, grade 8 and grade 9 students generally determined fractals successfully. This situation shows that students can recognize the fractal shapes intuitively as stated
in the studies of (2011) and Komorek et al. (2001).
In the category of finding the fractal patterns rule, despite not finding statistically significant differences among grades, according to the scores, grade 9 was more successful than others. The reason of this can be that in the grade 9 and grade 10 curricula, more activities for finding fractal patterns and mathematical operations with them were included. It is determined that the total scores for all grades were low. This shows that students have difficulty in determining the pattern of shape. Previous studies on students (THRELFALL, 1999; STACEY, 1989; ORTON; ORTON, 1999; ZAZKIS; LILJEDAHL, 2002) report same difficulties about finding repeated patterns. Yet, it is interesting the scores of grade 10 were lower than those of grade 8.
of the grades were the lowest in all categories of the test. This shows that students in all grades have many difficulties in carrying out mathematical operation with fractals. The reason for that can be having difficulties in finding patterns and generalizing them. Previous studies on mathematical operation with patterns (STACEY, 1989; ENGLISH; WARREN, 1998; ORTON; ORTON, 1999; FEIFE, 2005) report same difficulties. Despite not including mathematical activities about fractals in grade 8, these kinds of activities can be found in grade 9 and grade 10. Yet, it is interesting that the success of grade 10 was the lowest.
5 Educational implications
The results of this study showed that students generally determine fractals intuitively. However, there are also common problems with respect to the definition of fractals, finding the rules for patterns and mathematical operations with fractals in all grades. For this reason, some changes to the content of the courses should be made. The definition of fractals can be included in each grade by expanding the content of the definition. Furthermore, one of the most important characteristics of a fractal, self-similarity, can be given as intuitively as well as formally in the textbooks. Thus, the definition of fractal may be more meaningful for students. Also, students have difficulty in finding the rule for fractals patterns. This finding shows that they have deficiencies in understanding how a fractal is built. Therefore, having a formal way to form a fractal, such as initiator-generator-iteration, may be effective in overcoming this difficulty. We think paying attention especially to the generator, which provides the formation of fractal, may support success in both defining and understanding the rule and applying the rule in the iteration steps. The results show that carrying out mathematical operations with fractals was the most problematic subject in all grades. More in-depth studies on this subject can contribute to determining students’ proficiencies about finding patterns and formulating them.
References
BAKI, A.; , F.; KÖSA, T. The views of teachers and students about learning of fractal geometry concepts with the help of web-based teaching. In: INTERNATIONAL EDUCATIONAL TECHNOLOGY CONFERENCES, 8th, 2008,
Turkey. Proceedings… Turkey: IETC, 2008. p. 109-114. Available at: < http://www.iet-c.net/ >. Accessed in: 20 June 2011.
BARTON, P. S. Pascals’s triangle. Montessori LIFE,New York, v. 15, n. 2, p. 35-36, Sept. 2003.
BOLTE, L. A. A snowflake project: calculating, analyzing, and optimizing with the Koch snowflake. Mathematics Teacher, Reston VA, v. 95, n. 6, p. 414-419, Sept. 2002. BOWERS, C. S. On teaching and learning the concept of fractals. Unpublished master’s thesis, University of Concordia, 1991.
COES, L. Building fractal models with manipulatives. Mathematics Teacher,Reston VA, v. 86, v. 8, p. 646-651, Nov. 1993.
COHEN, L.; MANION, L.; MORRISON, K. Research Methods in Education. 6. ed. New York: Taylor & Francis, 2007.
ÇALIK, M. A cross-age study of different perspectives in solution chemistry from junior to senior High school. International Journal of Science and Mathematics Education, Springer-Verlag, n. 3, p. 671-696, Dec. 2005.
DEVANEY, R. L. Fractal patterns and chaos games. Mathematics Teacher, Reston VA, v. 98, n. 4, p. 228-233, Nov., 2004.
, L. D.; WARREN, E. A. Introducing the variable through pattern exploration.
Mathematics Teacher, Reston VA, v. 91, n. 2, p. 166-170, Feb. 1998.
FEIFEI, Y. Diagnostic Assessment of Urban Middle School Student Learning of Pre-algebra Patterns. Unpublished Doctoral Theses, University of Ohio State, 2005. FRABONI, M.; MOLLER, T. Fractals in the classroom. Mathematics Teacher, Reston VA, v. 102, n. 3, p. 197-199, Oct. 2008.
FORD, R. Discovering and Exploring Mandelbrot Set Points with a Graphing Calculator. Mathematics Teacher, Reston VA, v. 98, n. 1, p. 38-46, Aug. 2004. GOLDENBERG, E. P. Seeing beauty in mathematics: using fractal geometry to build a spirit of mathematical Inquiry. In: ZIMMERMANN, W.; CUNNINGHAM, S. (Ed.).
IOVINELLI, R. C. Chaotic Behavior in The Classroom. The Mathematics Teacher, Reston VA, v. 93, n. 2, p. 148-152, Feb. 2000.
, F.; BAKI, A. Assessing Grade 8 Elementary School Mathematics Curriculum and Textbooks within the Scope of Fractal Geometry. Elementary Education Online, v. 10, n. 3, p. 1081-1092, Sept. 2011.
; GÜVEN, B.; ÇEKMEZ, E. A Cross-age Study of Students’
Understanding of Limit and Continuity Concepts. Bolema, Rio Claro (SP), v. 24, n. 38, p. 245-264, Apr. 2011.
KOMOREK, M.; DUIT, R.; BÜCKER, N.; NAUJACK, B. Learning process studies in the field of fractals. In: BEHRENDT, H.; DAHNCKE, H.; , R.; GROABER, W.; KOMOREK, M.; KROSS, A.; , P. (Ed.). Research in Science Education – Past, Present, and Future. Netherlands: Kluwer Academic Publishers, 2001. p. 95-100. LANGILLE, M. W. Studying students’ sense making of fractal geometry.
Unpublished master’s thesis, Simon Fraser University, Canada, 1996.
LORNELL, R.; WESTERBERG, J. Fractals in high school: exploring a new geometry.
Mathematics Teacher, Reston VA, v. 92, n. 3, p. 260-269, Mar. 1999.
NAYLOR, M. Exploring fractals in the classroom. Mathematics Teacher, Reston VA, v. 92, n. 4, p. 360-366, Apr. 1999.
ORTON, A.; ORTON, J. Pattern and the approach to algebra. In: ORTON. A. (Ed.).
Pattern in the Teaching and Learning of Mathematics. Cassell, London: 1999. p. 104-120.
SHARPLEY, A. M.; IRVINE, J. W.; SHARPLEY, C. F. An Examination of the
STACEY, K. Finding and using patterns in linear generalizing problems. Educational Studies in Mathematics, Springer-Verlag, v. 20, n. 2, p. 147-164, May 1989.
THRELFALL, J. Repeating patterns in the primary years. In: ORTON, A. (Ed.). Pattern in the teaching and learning of mathematics. Cassell, London: 1999. p. 18-30. THOMAS, D. A. Investigating fractal geometry using LOGO. Journal of Computers in Mathematics and Science Teaching, Norfolk, Va., US, v. 8, n. 3, p. 25- 31, 1989. TOPPING, K.; CAMBELL, J.; DOUGLAS, W.; SMITH, A. Cross-age Peer Tutoring in Mathematics with Seven- and 11-year-olds: Influence on Mathematical Vocabulary, Strategic Dialogue and Self-concept. Educational Research, Routledge, v. 45, n. 3, p. 287-308, 2003.
VACC, N. N. Exploring fractal geometry with children. School Science and Mathematics, Menasha, Wis., US, v. 99, n. 2, p. 77-83, Feb. 1999.
ZAZKIS, R.; LILJEDAHL, P. Generalization of Patterns: The Tension between Algebraic Thinking and Algebraic Notation. Educational Studies in Mathematics, Springer-Verlag, v. 49, n. 3, p. 379-402, 2002.
Appendix
Two-Tier Test about Fractals
1. A fractal is a result of
(a) iterating shapes which have same size
(b) iterating shapes which have similar and same size (c) iterating shapes which have different size
(d) iterating shapes which have similar, but different size
Because………
2. Which of the following is a fractal?
Because………
3.
(a) Whole parts of a fractal have same size and they are similar.
(b) Many parts of a fractal have same size, but they do not have to be similar (c) When a part of a fractal is magnified, it is similar to the whole shape (d) All shapes in any part of a fractal have same size.
Because……….
Which objects collected by students are shown as an example for fractals?
(a) ve Fatma
(b) ve Ahmet
(c) Fatma ve Ahmet
(d) Ahmet ve Mehmet
Because………
5. Examine the following pattern
This pattern is a
(a) Fractal (b) Not a fractal
Because………
7. Which one is the first iteration of the given pattern?
Because ………
8.
Mehmet wants to calculate how many pentagons are there in the fourth iteration and he has found the answer as 66 by following the steps:
First step: 1 Second step: 1+5 Third step: 1+5+15 Fourth step: 1+5+15+45
In which step did he make his first mistake?
(a) 1 (b) 2 (c) 3 (d) 4
9.
In the first iteration of the Sierpinski gasket, the area of the colored triangle is 1 cm2. In
this case, in the 8th iteration step, what is the area of one of the smallest colored triangle?
(a) (b) (c) (d)