Revista Informatica Economică, nr. 4(48)/2008 51
The Network’s Data Security Risk Analysis
Emil BURTESCU Piteşti, România [email protected]
Establishing the networks security risk can be a very difficult operation especially for the small companies which, from financial reasons can’t appeal at specialist in this domain, or for the medium or large companies that don’t have experience. The following method pro-poses not to use complex financial calculus to determine the loss level and the value of impact making the determination of risk level a lot easier.
Keyword: controls, risk analysis, risk level, risk management, impact, network, probability,
vulnerability level.
isk analysis represents an important stage in a complex process of risk man-agement. This one is realized once in a cycle of risk management. Without the existence of this stage it can’t be done an efficient evalua-tion of risk at any kind of company.
There are 2 techniques in analyzing the secu-rity risk:
-qualitative analyzing; -quantitative analyzing.
Qualitative technique is easier to apply than the quantity technique of the risk, because the quantitative technique assumes some kind of experience and maturity in the domain of the corporation.
The main stages in the implementation of the qualitative analysis are:
1. Valuate data;
2. Establishing loss level; 3. Determinating exposure; 4. Determinating the impact; 5. Determinating the probability; 6. Determinating the risk level.
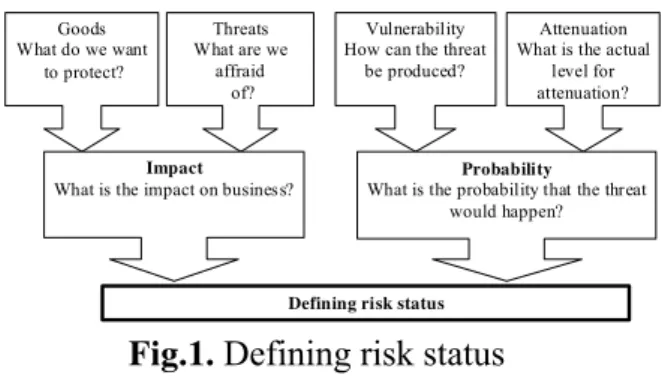
Even if at first sight crossing these stages must not create problems. Personal expe-rience shows that problems can occur. The following method is meant to eliminate some of the problems. We will concentrate our at-tention on establishing the risk level in case if an event occurs that has as result a delibe-rate attack on data. In this case we will dis-cuss about costs for recovering data and not costs for replacing equipment.
The definition of risk status is exemplified in the next figure (Figure 1).
Starting from this we will determine, using
simple landings the risk level for data from different networks in the corporation.
Goods What do we want
to protect?
Threats What are we
affraid of?
Vulnerability How can the threat
be produced?
Attenuation What is the actual
level for attenuation?
Impact What is the impact on business?
Probability What is the probability that the threat
would happen?
Defining risk status Fig.1. Defining risk status
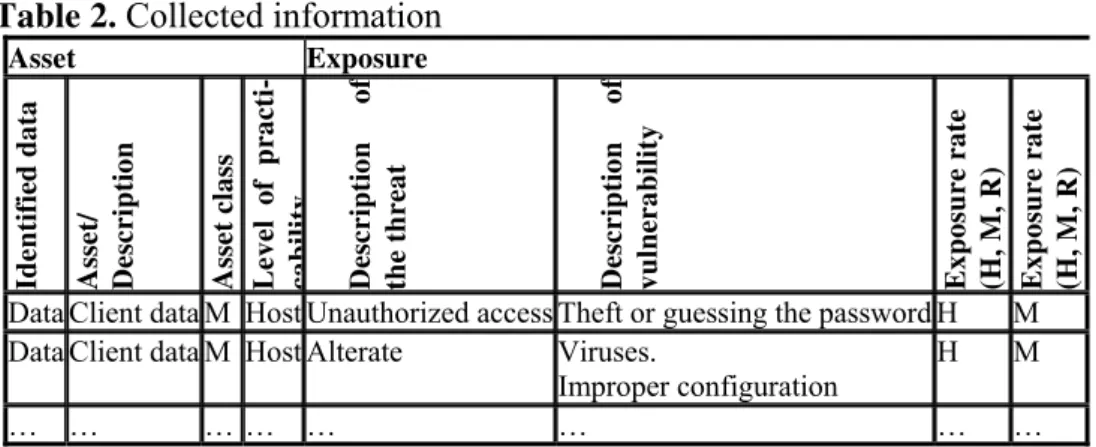
Valuate data. Valuate date will assume creating and filling in similar tables with the one exemplified (Table 1 and Table 2)
Table 1. Identifying assets and classifying them
Name of the assets
Classifying the assets (from the point of view of the impact)
DB server High … LAN printer Medium … Client data High Financial data Medium …
Establishing loss level. Experience shows that even if it seems a simple operation estab-lishing loss level is pretty difficult and as-sumes a laborious analysis of the corpora-tion’s activity and especially of the loss caused by attacks over data from the net-works of the corporation.
Determinating exposure. The same thing can be said about determinating exposure.
Revista Informatica Economică, nr. 4(48)/2008
52
Table 2. Collected information
Asset Exposure
Identifie
d
d
a
ta
Asset/ Descripti
o
n
Asset class Le
vel
o
f pr
ac
ti
-c
a
bi
lity
Descripti
o
n o
f
the thre
at
Descripti
o
n o
f
v
u
lnera
b
ility
Exposure r
a
te
(H
, M,
R
)
Exposure r
a
te
(H
, M,
R
)
Data Client data M Host Unauthorized access Theft or guessing the password H M Data Client data M Host Alterate Viruses.
Improper configuration
H M
… … … … … … … …
Determinating the impact. We will deter-mine the impact of a malicious act over the corporation’s data by determining the effect over the 3 criteria that must be taken into
consideration to assure data security: confi-dentiality, integrity and availability.
Let’s take an example of a corporation that has printer the next (sub)networks (Table 3):
Table 3. The importance of (sub)network
Name of the (sub)network
Confidentiality (C)
Integrity (I)
Availability (A)
The importance of the (sub)network (I (s)N)
1 2 3 4 5= (2*3*4)
Design 2 3 2 12
Financial 3 3 2 18
Provision 3 3 3 27
Administration 1 3 2 6
Legend: 1 - low interest; 2 - moderate interest; 3 - highinterest.
The values that I(s)N) can have are: 1, 2, 3, 4, 6, 8, 12 ,18 and 27.
Having these as a base we will determine the impact as shown in the next diagram (Table 4):
Table 4. Determining impact
The importance of the (sub)network
(I(s)N)
Level The value of the impact rate
(I)
1 Low 2 2 Low 3 3 Low 4 4 Moderate 5 6 Moderate 6 8 Moderate 7 12 High 8 18 High 9 26 High 10
Determinating the probability. We have determined the impact. We will continue with determinating the probability of produc-tion. This is inverted proportional with the controls that are applied to reduce risk. If the number and the efficiency of these controls are high, the risk will be lower.
Determinating the probability of producing will assume:
-determinating the existence of some vulne-rability and the possibility of exploiting it; -determinating the probability of vulnerabili-ties for them to be diminished by the controls that are used.
It is known the fact that the vulnerability lev-el rises if the number of attackers is high and their training is at a high level; an attack can be initiated from distance; if one attack is known and documented if an attack can be automatised. Having these things in mind we can determine the vulnerability level as in the next diagram (Table 5).
Revista Informatica Economică, nr. 4(48)/2008 53
Table 5. Establishing the vulnerability level
Vulnerability level Grade Conditions
High 5 -high number of attackers- “script-kiddie”/hobbyist; -attack at a certain dis-tance; -“anonymous” privileges; -very well known and documented exploit-ing methods; -automatisation.
Moderate 3 -moderate number of attackers-expert-specialist; -local attack; -it requires access rights; -undocumented attack methods; -unautomatisation.
Low 1 low number of attackers internal architectural knowledge; local attack; requires Administrator privileges; undocumented attack methods; -unautomatisation.
Analysing controls we can determine the implementation level of these ones (Table 6):
Table 6. Level of controls implementation
Questions Grades 0 -Yes, 1 - No
Are the responsibilities defined and effectively applied? 1 Are the warnings communicated followed by executing them? 0 Are the processes and procedures well defined and learned? 0 Does the actual technology or the existent controls reduce the threat? 1 Are the current audit practice enough to detect abuses or deficit control? 1
Sum 3
Determinating the risk level. Determining risk level will be done as shown in the next
table (Table 7):
Table 7. Determining risk level
Impact rate
*
Probability rate
Result Risk level
8 – 10 High 7 – 10 41 – 100 High
5 – 7 Moderate 4 – 6 20 – 40 Moderate
2 – 4 Low 0 – 3 0 – 19 Low
The (sub)network of the financial compart-ment: (I(s)R) = 18 it corresponds a value of impact class I = 9. Vulnerability level = 3. Control implementation level = 3, so the probability rate = 3 + 3 = 6. Multiplying the impact rate (9) with the probability rate (6) we will obtain 54 that places the (sub)network of this compartment at a high risk level.
This method can easily be applied in the cor-porations that have a well trained IT person-nel but don’t have a personperson-nel that is able to make laborious calculus to establish loss lev-el of the corporation and calculating the im-pact value for different undesirable events.
Reference
• E. Burtescu. Securitatea datelor firmei, Independenţa economică, 2005.
• L. McCarthy, IT Security: Risking the Corporation, Prentice Hall PTR, 2003.
• P.E. Proctor, F.C. Byrnes, The Secured Enterprise, Prentice Hall PTR, 2002.
• M. Kaeo, Designing Network Security, Cisco Press, Macmillian Technical Publish-ing, 1999.