ABSTRACT: Objective:To evaluate the prevalence of overweight in adolescents and its associated factors. Methods: A cross-sectional study in public and private schools in Goiania, Brazil. Socioeconomic status, family history of obesity, lifestyle, blood pressure and Body Mass Index were studied in a sample of 1,169 Brazilian youth aged 12 – 18 years, who attended public and private schools. Data were obtained from a questionnaire and anthropometric measurements previously tested in a pilot study. Poisson regression was used to estimate the prevalence of overweight, prevalence ratios and associations with the other factors. Results:The prevalence of overweight was 21.2%, with a signiicant diference between boys and girls (26.3 and 16.8% respectively). Regression analysis showed that maternal obesity was associated with a higher prevalence of overweight in boys (PR = 1.86; p = 0.004), and boys aged 15 – 18 years had a lower prevalence of overweight than boys aged 12 – 14 years (PR = 0.70; p = 0.021). Among the girls, the presence of obese parents was associated with higher prevalence of overweight (PR = 2.42; p < 0.001), and the girls from a C class socioeconomic position were negatively associated with overweight (PR = 0.67; p = 0.035). Conclusions:Overweight in adolescence is associated with gender, obesity family history, and socioeconomic position. These data should be considered when planning intervention programs.
Keywords: Overweight. Adolescent health. Obesity. Risk factors. Life style.
Overweight and associated factors in
adolescents from a brazilian capital
Excesso de peso e fatores associados em adolescentes de uma capital brasileira
Carolina de Souza CarneiroI, Maria do Rosário Gondim PeixotoIII, Karla Lorena MendonçaI, Thaís Inácio Rolim PóvoaI, Flávia Miquetichuc Nogueira NascenteI,
Thiago de Souza Veiga JardimI,II, Weimar Kunz Sebba Barroso de SouzaI,II, Ana Luiza Lima SousaI,IV, Paulo César Brandão Veiga JardimI,II
ORIGINAL ARTICLE / ARTIGO ORIGINAL
IArterial Hypertension League, Clinical Hospital, Universidade Federal de Goiás – Goiânia (GO), Brazil.
IISchool of Medicine, Universidade Federal de Goiás – Goiânia (GO), Brazil.
IIISchool of Nutrition, Universidade Federal de Goiás – Goiânia (GO), Brazil.
IVSchool of Nursing, Universidade Federal de Goiás – Goiânia (GO), Brazil.
Corresponding author: Paulo César Brandão Veiga Jardim. Faculdade de Medicina da Universidade Federal de Goiás. Rua 115-F, 135, Setor Sul, CEP: 74085-300, Goiânia, GO, Brasil. E-mail: [email protected]
Conlict of interests: nothing to declare – Financial support: Conselho Nacional de Desenvolvimento Cientíico e Tecnológico
261
INTRODUCTION
Adolescence is characterized by the transition between infancy and adult life, with pro-found somatic and biopsychosocial transformations1. Acquired habits in this phase can last for someone’s whole life, and the early onset of harmful behavior represents a risk for the emergence of chronic non-communicable diseases (CNCD) 2.
Although predominant in adults, the CNCD originate early in life and grow alarmingly in childhood and adolescence3-5.
The increase in the prevalence of overweight (OW) and obesity in adolescents is a real-ity in developed countries, in developing countries, and even in the poorest countries with food security and malnutrition problems6.
Epidemiological studies in various countries reinforce the epidemic characteristic of obesity in the world4,7,8. In the United States, a study concerning the increase of Body Mass Index (BMI) in 3,281 children and adolescents found a high prevalence of OW and obesity (31.7 and 11.9%, respectively)7. In Brazil, the analyses of the nutritional status of adoles-cents in the Family Budgets Research (FBR) from 2002-2003 and 2008-2009 show that the prevalence of OW increased from 16.7 to 20.5%, and obesity increased from 2.3 to 4.9%4,8. The increasing prevalence of OW and obesity in adolescents has been attributed not only to genetic and physiological factors, but mainly to changes in lifestyle, such as the decrease in the practice of physical exercises, the increase in the consumption of food that is rich in fat, sodium, and the reduction of the consumption of fruits and vegetables (FV)9.
RESUMO:Objetivo: Avaliar a prevalência de excesso de peso (EP) e fatores associados em adolescentes. Métodos: Estudo transversal realizado em escolas públicas e privadas de Goiânia (GO). Foram analisados adolescentes de 12 a 18 anos (n = 1.169) por meio de questionário padronizado. A prevalência de EP foi avaliada pelas curvas de crescimento da Organização Mundial da Saúde (OMS) de Índice de Massa Corporal (IMC) por idade. As associações entre as variáveis sociodemográicas, de antecedentes familiares de obesidade, de estilo de vida e de pressão arterial com o EP foram analisadas por intermédio da razão de prevalência bruta e ajustada por meio da regressão múltipla de Poisson. Resultados: A prevalência de EP foi de 21,2%, sendo 14,1% de sobrepeso e 7,1% de obesidade, com diferenças signiicativas entre gêneros (26,3% dos rapazes versus 16,8% das moças). Na análise de Poisson, a obesidade materna (RP = 1,86; p = 0,004) foi associada com a maior prevalência de EP no sexo masculino, e aqueles com idade entre 15 e 18 anos tiveram menor prevalência de EP quando comparados àqueles com idade entre 12 e 14 anos (RP = 0,70; p = 0,021). No sexo feminino, a presença de pais obesos (RP = 2,42; p < 0,001) associou-se a maior prevalência de EP, e as moças pertencentes à classe C tiveram menor prevalência de EP (RP = 0,67; p = 0,035). Conclusões: O EP em adolescentes esteve associado ao gênero, à obesidade familiar, e a melhor classiicação socioeconômica — fatores que devem ser o foco do planejamento de intervenções especíicas na promoção da saúde.
Various factors are crucial for the genesis of obesity in adolescents, especially gender, socioeconomic level, physical activity, food habits, and heredity9.
Adolescents with OW have a high risk of obesity in adulthood. Thus, for the prevention of this condition and the risks that are associated with the disease, efective and directed interventions are extremely important for this population10.
The recent advances in the understanding of the behavior dynamics of adolescence can facilitate the promotion of actions that result in a greater impact in the future well being of these individuals.
Broader population-based studies concerning associated factors of OW in adolescents are scarce in the Mid-West Region of Brazil; however, they are important for the search of alternatives to promote prevention and early intervention.
As a result, the objective of this study was to evaluate the prevalence of OW and its asso-ciation with sociodemographic variables, including the personal background and lifestyle of a representative sample of adolescents enrolled in the public and private school system in the city of Goiânia (GO).
METHODS
This is a cross-sectional study that is part of a larger project entitled “Residential Blood Pressure Measurements (MRPA) and its relation with the left ventricular mass index and insulin resistance (HOMA) in adolescents with masked and white coat hypertension.”
Adolescents aged from 12 to 18 years, from both genders, who were enrolled in the pri-vate and public school system of Goiânia, were studied. In conjunction with the State and Municipal Secretaries of Education and the Union of Private Schools of Goiânia, a total of 133,528 enrolled students in this age group were identiied. They represent 63% of the total population of 211,072 adolescents, according to the 2010 census11.
Considering the prevalence of OW of 20.5% described in the FBR 2008 – 20094, and an absolute precision of 2.46% (relative 12%) and with a signiicance level of 5%, a sample of 1,027 adolescents was calculated.
To select the adolescents, all of the state, municipal, and private schools were identi-ied in the nine regions of the municipality. Five public schools and ive private schools per region were randomly selected and invited to participate in the study. Contact with the school was performed using a lottery system. In the end, 26 schools accepted to participate in the study. The selection of the adolescents was performed randomly in accordance with the list of enrolled students in the institution, stratiied by age and gender and by means of invitation after an oral explanation of the project.
263
Adolescents aged between 12 and 18 years and enrolled in the selected schools were included in the study. Those with a physical deiciency or any other factor that did not permit the anthropomet-ric evaluation, in addition to pregnant women and individuals with chronic diseases, were excluded. Data collection was performed in 2011, and respected the school system’s calendar. The data was collected by means of a questionnaire that was tested in a pilot study that pre-sented the school and adolescents’ identiication by appropriately trained research assistants. All of the standards were standardized and supervised.
The following demographic and socioeconomic variables were considered: gender, age, skin color, and socioeconomic class (SEC). Age was presented in years and categorized by age groups of 12-14 years and 15-18 years. Skin color was deined by the interviewee as white or non-white and SEC was established using the criteria from the Brazilian Association of Market Research Institutes –ABIPEME12.
The variables of maternal and paternal obesity were investigated using the question: “Is anyone in your family (mother or father) obese?”
For the lifestyle variables, the following were considered: smoking, alcohol consump-tion, FV consumption, and physical activity. The evaluation of smoking and the consumption of alcoholic beverages were performed through questions that diagnosed the use and fre-quency of consumption of such substances.
The individual ingestion of FV was estimated based on four questions coming from the questionnaires of the Global school-based student health survey (GSHS) and from the National School Health Survey (PeNSE)13,14.
The consumption of FV was categorized in accordance with the weekly frequency of consumption and then transformed into quantitative variables, according to Fornés15. Five daily portions of FV was considered an appropriate consumption16.
For the evaluation of physical activity level (PAL), the short form of The International Physical Activity Questionnaire (IPAQ), version 8, that was developed by the WHO and val-idated in Brazil, was used17. This instrument evaluates PAL by means of questions related to light, moderate, or vigorous efort performed in the last week. Individuals were consid-ered insuiciently active with a summation of less than 600 MET-minutes/week, and suf-iciently active with a summation greater than 600 MET minutes/week18.
For the investigation of the altered blood pressure variable, casual blood pressure mea-surements in the school were taken in a calm place as deined by the team responsible for the project in conjunction with the principal of the school, and before recess. Blood Pressure (BP) was measured using semiautomatic devices of the brand OMRON® and the model HEM-705CP. The equipment used was validated by international agencies for use with adolescents19.
The devices were periodically calibrated with a mercury column apparatus to prove their accuracy. Cufs of three diferent sizes (9 x 16 cm, 13 x 23 cm, and 15 x 30 cm) were selected based on the arm circumference of each individual (the cuf should wrap around 80 to 100% of the circumference of the arm).
of rest. For the purpose of analysis, the second casual measurement was performed. For the BP values, the percentile was calculated according to the formulas proposed by 4th Task Force.
BP was deined as altered when the BP (systolic and / or diastolic) was equal to or greater than the 90th percentile for the respective age, gender, and height20.
For the evaluation of the nutritional status, anthropomorphic measurements of weight, height in duplicate, using standard procedures were performed21.Weight was measured using a portable electronic scale of the brand Kratos®, calibrated by Inmetro, with a capacity of up to 150 kg and a variation of 50 g. For the height measurement, the portable Secca® sta-diometer was ixed to the wall and graduated to an accuracy of 0.1 cm. BMI was calculated by weight (kg) divided by the square of height (meters) (weight / [height]2). Adolescents who were above the 85th percentile were considered overweight, and those above the 97th percentile were considered obese, from the BMI cutof points, speciic for age and gender, according to the criteria proposed by the WHO22.
The data bank was written in the Epi-Info® program (version 3.5.3) with double typing for error checking. Statistical analyses were performed in the Stata program (version 12.0). The χ² test was applied to evaluate the diferences between the genders. The variables associated with the outcome (OW) were analyzed using crude prevalence ratios (CPR) and adjusted prevalence ratios (APR) in the Poisson regression, with a robust variance adjust-ment, and those with p < 0.20 in the multivariate model were tested in the bivariate anal-ysis. The level of signiicance adopted was 5%.
The project was submitted and approved by the Ethics Committee on Human and Animal Medical Research of the Clinical Hospital of the Universidade Federal University de Goiás (GO), under case number 017/2010, and assisted by the Municipal Secretaries of Goiânia and Goiás State.
RESULTS
Twenty-six schools drawn from all regions of the city of Goiânia were investigated. Of the 1,248 adolescents invited to participate in the study, 48 did not accept (3.8% refusal), 27 did not meet the inclusion criteria, and 4 students refused to do the anthropometric measure-ments. Thus, 75 of the adolescents initially invited did not participate in the study, resulting in a inal sample of 1,169 adolescents, which was 14% higher than the calculated sample.
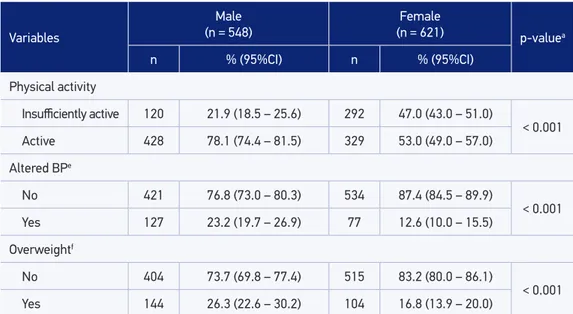
The sociodemographic characteristics, maternal and paternal obesity, lifestyle, blood pres-sure, and nutritional status of the sample are described and presented in Table 1. The anal-yses were stratiied by gender to evaluate whether the control variables studied were dif-ferent between girls and boys.
It was veriied that the studied population had a balanced distribution between the gen-ders (53.1% female) and within the age groups, according to the stratiication adopted. There was also a balance in the sample regarding skin color, as shown in Table 1.
265
Table 1. Distribution of the sample by gender, according to sociodemographic variables, family history of obesity, lifestyle, blood pressure, and nutritional status. Goiânia, GO, 2011 – 2012. (n = 1,169).
Variables
Male (n = 548)
Female
(n = 621) p-valuea
n % (95%CI) n % (95%CI)
Age (years)
12 – 14 246 44.9 (40.7 – 49.2) 280 45.1 (41.1 – 49.1)
0.946
15 – 18 302 55.1 (50.8 – 59.3 341 54.9 (50.9 – 58.9)
Skin Colorb
Non-white 288 52.7 (48.5 – 57.0) 307 49.5 (45.5 – 53.5)
0.271
White 258 47.3 (43.0 – 51.5) 313 50.5 (46.5 – 54.5)
Socioeconomic classiication
A and B 251 45.8 (41.6 – 50.1) 250 40.3 (36.4 – 44.2)
0.019
C 281 51.3 (47.0 – 55.5) 335 53.9 (49.9 – 57.9)
D and E 16 2.9 (1.7 – 4.7) 36 5.8 (4.1 – 7.9)
Maternal obesityc
No 510 94.6 (92.4 – 96.4) 568 92.8 (90.5 – 94.7)
0.209
Yes 29 5.4 (3.6 – 7.6) 44 7.2 (5.3 – 9.5)
Paternal obesityd
No 495 92.5 (90.0 – 94.6) 562 92.4 (90.0 – 94.4)
0.955
Yes 40 7.5 (5.4 – 10.0) 46 7.6 (5.6 – 10.0)
Smoking
No 540 98.5 (97.1 – 99.4) 614 98.9 (97.7 – 99.5)
0.614
Yes 8 1.5 (0.6 – 2.8) 7 1.1 (0.4 – 2.3)
Consumption of alcoholic beverages
No 225 41.1 (36.9 – 45.3) 214 34.5 (30.7 – 38.3)
0.020
Yes 323 58.9 (54.7 – 63.1) 407 65.5 (61.6 – 69.6)
Consumption of FV (times per day)
Did not consume 11 2.0 (1.0 – 3.7) 12 1.9 (1.0 – 3.4)
0.003
One 178 32.5 (28.6 – 36.6) 160 25.8 (22.4 – 29.4)
2 – 3 322 58.8 (54.5 – 62.9) 372 59.9 (55.9 – 63.8)
4 or more 37 6.7 (4.8 – 9.2) 77 12.4 (9.9 – 15.3)
Regarding SEC, the majority (approximately 50%) is included in class C, whereas fewer individuals classiied in classes D and E were found (2.9% among boys and 5.8% among girls). The description of maternal and paternal obesity occurred in a similar way and in a percentage lower than 10%.
It was observed that less than 10% of the adolescents consumed FV adequately (four times or more per day). Male adolescents were more active (78.1%), and female adolescents were classiied as insuiciently active in almost 50% of the sample (p < 0.001).
BP was altered in a higher percentage of males (23.2%) than in females (12.2%), with p < 0.001. The prevalence of OW was 21.2%, with 14.1% overweight and 7.1% obese, with a sig-niicant diference between the genders – 26.3% in males and 16.8% in females (p < 0.01).
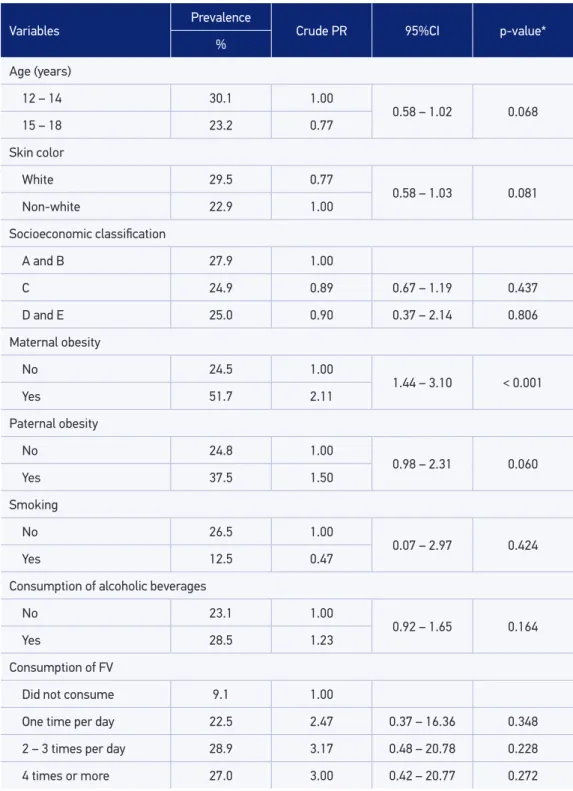
In the bivariate analysis, the prevalence of OW in male adolescents was more than dou-ble in children of obese mothers (PR = 2.11, p < 0.001) and in those with BP above P 90° (PR = 2.30; p < 0.001). For the other independent variables, there were no statistically sig-niicant diferences (Table 2).
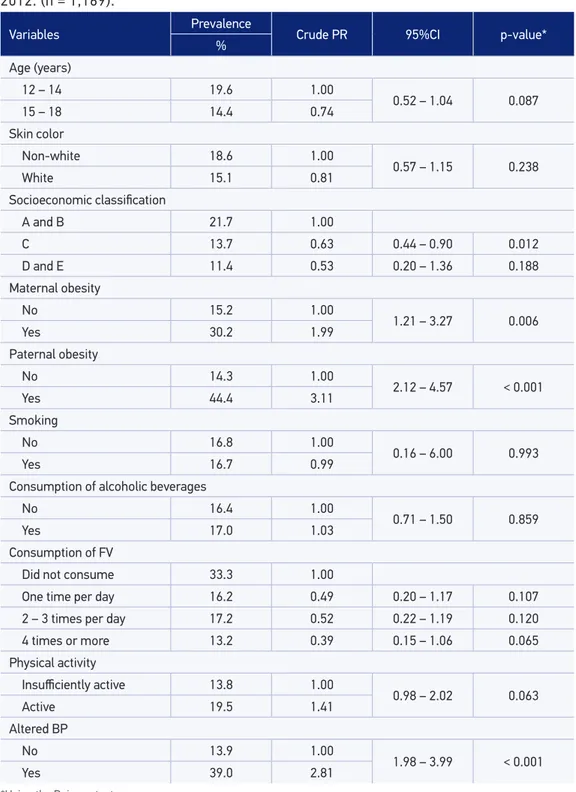
In female adolescents, OW was practically twice as prevalent in daughters of obese moth-ers (PR = 1.99) and three times more prevalent in daughtmoth-ers of obese parents (PR = 3.11). In girls with altered BP, OW was also almost three times more prevalent (PR = 2.81). For the other independent variables there were no signiicant diferences (Table 3).
In the multivariate analysis performed among the independent variables that remained in the male multiple model, the children of obese mothers had a higher prevalence of OW (PR = 1.86), and those aged between 15 and 18 years had a lower prevalence of OW (PR = 0.70). In females, OW remained signiicantly associated with paternal obesity (PR = 2.47), and girls in class C had a lower prevalence of OW (PR = 0.67) (Table 4).
Table 1. Continuation.
Variables
Male (n = 548)
Female
(n = 621) p-valuea
n % (95%CI) n % (95%CI)
Physical activity
Insuiciently active 120 21.9 (18.5 – 25.6) 292 47.0 (43.0 – 51.0)
< 0.001
Active 428 78.1 (74.4 – 81.5) 329 53.0 (49.0 – 57.0)
Altered BPe
No 421 76.8 (73.0 – 80.3) 534 87.4 (84.5 – 89.9)
< 0.001
Yes 127 23.2 (19.7 – 26.9) 77 12.6 (10.0 – 15.5)
Overweightf
No 404 73.7 (69.8 – 77.4) 515 83.2 (80.0 – 86.1)
< 0.001
Yes 144 26.3 (22.6 – 30.2) 104 16.8 (13.9 – 20.0)
aUsing the χ² test from Pearson; bThree individuals did not respond; c18 individuals did not know how to respond; d26 did
267
Table 2. Prevalence of overweight (outcome), crude prevalence ratio, and respective confidence intervals of its association with sociodemographic characteristics, family history of obesity, lifestyle ,and blood pressure among male individuals. Goiânia, GO, 2011 – 2012. (n = 1,169).
Variables
Prevalence
Crude PR 95%CI p-value*
%
Age (years)
12 – 14 30.1 1.00
0.58 – 1.02 0.068
15 – 18 23.2 0.77
Skin color
White 29.5 0.77
0.58 – 1.03 0.081
Non-white 22.9 1.00
Socioeconomic classiication
A and B 27.9 1.00
C 24.9 0.89 0.67 – 1.19 0.437
D and E 25.0 0.90 0.37 – 2.14 0.806
Maternal obesity
No 24.5 1.00
1.44 – 3.10 < 0.001
Yes 51.7 2.11
Paternal obesity
No 24.8 1.00
0.98 – 2.31 0.060
Yes 37.5 1.50
Smoking
No 26.5 1.00
0.07 – 2.97 0.424
Yes 12.5 0.47
Consumption of alcoholic beverages
No 23.1 1.00
0.92 – 1.65 0.164
Yes 28.5 1.23
Consumption of FV
Did not consume 9.1 1.00
One time per day 22.5 2.47 0.37 – 16.36 0.348
2 – 3 times per day 28.9 3.17 0.48 – 20.78 0.228
4 times or more 27.0 3.00 0.42 – 20.77 0.272
The altered BP variable was not used in the multiple model because it was not a risk fac-tor for OW. The reverse was true, as already described in the literature23.
DISCUSSION
The results of this study highlight the high prevalence of OW and its important asso-ciations with paternal obesity, as well as high BP in adolescents. A comparison with previ-ous studies conirms the alarming character of the nutritional situation of this age group.
The study sample was 14% larger than the calculated sample, and was representative of the adolescent population enrolled in the school system of Goiânia, as well as of all the ado-lescents of the capital city. In addition, the validity of the study was ensured by information collected in the schools, by trained staf and using standardized instruments.
The prevalence of OW was 21.2%, which indicates an important increase in relation to the prev-alence found in a study conducted in the same city in 2006 by Monego and Jardim (16% of OW)24. The OW found in this investigation was similar to that reported in FBR 2008 - 2009 (20.5%4), in a study carried out in the Southeast (21.2%25), and in international studies of South American countries26,27 and in Asia28. On the other hand, it was higher than what has been found in national studies on OW in other regions of Brazil, such as in the North (17.4%)29, the Northeast (13.9%)30 and the South (12%)31, and lower than what was observed in the United States (31.7%7).
In this study, OW was signiicantly more prevalent in males than in females (26.3 versus 16.8%), a result similar to that found by Júnior and Silva in Paraíba32, and by Nasreddine et al. in Syria33. According to FBR 2008-2009, male adolescents showed a higher prevalence of OW in all regions of Brazil4.
Age was associated with OW only in males, in which the older ones had a lower prev-alence. In national and international studies, the prevalence of OW in this age group was lower in both genders7,29.
Variables
Prevalence
Crude PR 95%CI p-value*
%
Physical activity
Insuiciently active 28.3 1.00
0.65 – 1.26 0.559
Active 25.7 0.907
Altered BP
No 20.2 1.00
1.76 – 3.00 < 0.001
Yes 46.5 2.30
Table 2. Continuation.
269
Table 3. Prevalence of overweight (outcome), crude prevalence ratio, and respective confidence intervals of its association with sociodemographic characteristics, family history of obesity, lifestyle, and blood pressure among females. Goiânia, GO, 2011 – 2012. (n = 1,169).
Variables Prevalence Crude PR 95%CI p-value*
%
Age (years)
12 – 14 19.6 1.00
0.52 – 1.04 0.087
15 – 18 14.4 0.74
Skin color
Non-white 18.6 1.00
0.57 – 1.15 0.238
White 15.1 0.81
Socioeconomic classiication
A and B 21.7 1.00
C 13.7 0.63 0.44 – 0.90 0.012
D and E 11.4 0.53 0.20 – 1.36 0.188
Maternal obesity
No 15.2 1.00
1.21 – 3.27 0.006
Yes 30.2 1.99
Paternal obesity
No 14.3 1.00
2.12 – 4.57 < 0.001
Yes 44.4 3.11
Smoking
No 16.8 1.00
0.16 – 6.00 0.993
Yes 16.7 0.99
Consumption of alcoholic beverages
No 16.4 1.00
0.71 – 1.50 0.859
Yes 17.0 1.03
Consumption of FV
Did not consume 33.3 1.00
One time per day 16.2 0.49 0.20 – 1.17 0.107
2 – 3 times per day 17.2 0.52 0.22 – 1.19 0.120
4 times or more 13.2 0.39 0.15 – 1.06 0.065
Physical activity
Insuiciently active 13.8 1.00
0.98 – 2.02 0.063
Active 19.5 1.41
Altered BP
No 13.9 1.00
1.98 – 3.99 < 0.001
Yes 39.0 2.81
Table 4. Adjusted prevalence ratio and respective confidence intervals for association of age, socioeconomic status, and overweight for males and females. Goiânia, GO, 2011 – 2012. (n = 1,169).
Males Females
Adjusted PR 95%CI p-value* Adjusted PR 95%CI p-value*
Age (years)
12 – 14 1.00
0.52 – 0.95 0.021 – – –
15 – 18 0.70
Socioeconomic classiication
A e B
– – –
1.00
C 0.67 0.47 – 0.97 0.035
D e E 0.56 0.21 – 1.50 0.251
Maternal obesity
No 1.00
1.21 – 2.86 0.004 – – –
Yes 1.86
Paternal obesity
No
– – – 1.00 1.62 – 3.77 < 0.001
Yes 2.47
*Multivariate Analysis - Poisson Regression.
With regard to socioeconomic classiication, in both genders there was a higher prev-alence of OW among adolescents of classes A and B, but this diference did not reach sta-tistical signiicance. In female adolescents, there was a negative association of OW with class C (p = 0.037, PR = 0.69), and there was no social class interference in relation to males (p = 0.733).
These results were diferent from those found in São Paulo where both genders had a sig-niicant association with SEC, and were positive for classes A and B34, and from those found in Paraíba where the OW in males was also associated with the higher classes32. In interna-tional studies, SEC was also associated with OW in females, but not in males35,36.
It is important to emphasize that OW in adolescents has been more associated with par-ents’ schooling than with parental purchasing power – a piece of data that was not analyzed in the present study36, but deserves attention.
As in other studies37,38, OW in adolescents had a direct association with the obesity of the father and / or the mother, reinforcing the family inluence on the children’s life habits and highlighting an important risk factor for the development of obesity in this age group.
271
In the bivariate analysis of this study, a strong association of altered BP (P > 90o) with OW (p < 0.001) was observed for both genders, in concordance with results from simi-lar studies39-41.The change in BP was almost three times more prevalent in boys with OW (PR = 2.81) and about twice as prevalent in girls with OW (PR = 2.30).
Although there was no observed association of FV consumption with OW, it is import-ant to note that the majority of the studied sample, approximately 90% (being smaller in females – 87.6 versus 93.3%), did not reach the WHO daily consumption recommendation of ive servings / day. This is worrying because of the worldwide assertions related to this eating habit, according to which the low intake of FV is among the ten main risk factors for mortality in the world. It is estimated that up to 2.7 million lives could be saved annu-ally around the world if FV consumption were adequate16.
A diferent result was found in a study carried out with 63,111 adolescents in South Korea, where the association of FV consumption with EW was investigated, with a positive asso-ciation between both genders28.
The main limitation of this study was its cross-sectional nature. Owing to this fact, it was only possible to analyze the association of the outcome with the exposure at the moment of data collection.
Other limitations were the lack of adequate cutof points for the BMI assessment of the Brazilian adolescent population, as international parameters may not relect the actual condition of nutritional status42, and the self-reported deinition of the nutritional status of family members, as the distortion of body image has been increasing alarmingly in the studied age group43.
Among the results found, the increasing prevalence of OW in adolescents and its associa-tion with gender, family obesity, SEC, and BP stand out. Such variables should be considered in public health for the planning of speciic interventions to combat this epidemic in adolescents.
CONCLUSION
The data in this study corroborate the claim that obesity and OW are a global pandemic. The results found reinforce the need for eicient public policies for health promotion and the stimulation of lifestyle changes with a focus on nutritional education and the practice of regular physical activity, thus aiming at the prevention of OW and its consequences, such as cardiovascular diseases.
ACKNOWLEDGEMENTS
1. Vitolo MR. Nutrição: da gestação ao envelhecimento. 3. ed. Rio de Janeiro: Rubio; 2008.
2. Mulye TP, Park MJ, Nelson CD, Adams SH, Irwin CE Jr, Brindis CD. Trends in adolescent and young adult health in the United States. J Adolesc Health 2009; 45(1): 8-24.
3. Schramm JM, Oliveira AF, Leite IC, Valente JG, Gadelha AM, Portela MC, et al. Transição epidemiológica e o estudo de carga de doença no Brasil. Ciênc Saúde Coletiva 2004; 9(4): 897-908.
4. Brasil. Instituto Brasileiro de Geograia e Estatística. Pesquisa de Orçamentos Familiares 2008-2009: antropometria e estado nutricional de crianças, adolescentes e adultos no Brasil. Rio de Janeiro: IBGE; 2010.
5. Bloch KV, Klein CH, Szklo M, Kuschnir MC, Abreu GA, Barufaldi LA, et al. ERICA: prevalências de hipertensão arterial e obesidade em adolescentes brasileiros. Rev Saúde Pública 2016; 50(1): 9s.
6. World Health Organization – WHO discussion papers on adolescence. Nutrition in adolescence – issues and challenges for the health sector. Geneva: WHO; 2005.
7. Ogden CL, Carroll MD, Curtin LR, Lamb MM, Flegal MK. Prevalence of high body mass index in US children and adolescents, 2007-2008. JAMA 2010; 303(3): 242-9.
8. Brasil. Instituto Brasileiro de Geograia e Estatística. Pesquisa de Orçamentos Familiares 2002-2003: antropometria e análise do estado nutricional de crianças e adolescentes no Brasil. Rio de Janeiro: IBGE; 2006.
9. Oliveira C, Fisberg M. Obesidade na infância e adolescência – uma verdadeira epidemia. Arq Bras Endocrinol Metab 2003; 47(2): 107-8.
10. Wang LY, Denniston M, Lee S, Galuska D, Lowry R. Long-term health and economic impact of preventing and reducing overweight and obesity in adolescence. J Adolesc Health 2010; 46(5): 467-73.
11. Instituto Brasileiro de Geografia e Estatística (Brasil). Censo Demográico 2010 – Características da população e dos domicílios: Resultados do universo. RJ: IBGE; 2010.
12. Associação Brasileira de Institutos de Pesquisa de Mercado (ABIPEME). Critério de classificação socioeconômica – 2008. [acesso em 06 maio 2010]. Disponível em: http://www.aba.com.br/wp-content/ uploads/content/7727632a373615b34f2a5726fcc5c9e2.pdf
13. World Health Organization. Global school-based student health survey. Core Questionnaire Modules. 2006. 14p. [acesso em 12 abr. 2010]. Disponível em: http://www. who.int/chp/gshs/en/
14. Brasil. Instituto Brasileiro de Geograia e Estatística. Pesquisa Nacional de Saúde do Escolar. Rio de Janeiro: IBGE; 2009.
15. Fornés NS, Martins IS, Velásquez-Meléndez G, Latorre MRDO. Escores de consumo alimentar e níveis lipêmicos em população de São Paulo, Brasil. Rev Saúde Pública 2002; 36(1): 12-8.
16. World Health Organization. Diet, nutrition and the prevention of chronic diseases. Geneva: WHO; 2003. 220p. (WHO Technical Report Series, 916).
17. Matsudo SM, Araújo T, Matsudo VR, Andrade D, Andrade E, Oliveira LC, et al. Questionário Internacional de Atividade Física (IPAQ): estudo de validade e reprodutibilidade no Brasil. Rev Bras Ativ Fís Saúde 2001; 6: 5-18.
18. International Physical Activity Questionnaire (IPAQ). Guidelines for data processing and analysis of the International Physical Activity Questionnaire. 2004. [acesso em 20 jan. 2012]. Disponível em: http://www. institutferran.org/documentos/scoring_short_ipaq_ april04.pdf
19. Stergiou GS, Yiannes NG, Rarra VC, Panagiotakos DB. Home blood pressure normalcy in children and adolescents: the Arsakeion School study. J Hypertens 2007; 25(7): 1375-9.
20. National High Blood Pressure Education Program Working Group on High Blood Pressure in Children and Adolescents. The fourth report on the diagnosis, evaluation, and treatment of high blood pressure in children and adolescents. Pediatrics 2004; 114(2): 555-76.
21. Lohman TG, Roche AF, Martorell R. Anthropometric standardization reference manual. Champaign: Human Kinetics Books; 1988.
22. World Health Organization. Growth reference data for 5-19 years. 2007. [acesso em 20 abr. 2010]. Disponível em: http://www.who.int/growthref/en/
23. Sociedade Brasileira de Cardiologia. Sociedade Brasileira de Hipertensão. Sociedade Brasileira de Nefrologia. VI Diretrizes Brasileiras de Hipertensão Arterial. Arq Bras Cardiol 2010; 95(1): 1-51.
24. Monego ET, Jardim PC. Determinantes de risco para doenças cardiovasculares em escolares. Arq Bras Cardiol 2006; 87(1): 37-45.
25. Gambardella AM, Salvador CC, Kitoko PM. Nutritional status of children and adolescents: factors associated to overweight and fat accumulation. Rev Bras Crescimento Desenvolv Hum 2014; 24(3): 313-9.
26. Pérez-Cueto FJ, Botti AB, Verbeke W. Prevalence of overweight in Bolivia: data on women and adolescents. Obes Rev 2009; 10(4): 373-7.
273
27. Yepez R, Carrasco F, Baldeón ME. Prevalencia de sobrepeso y obesidad en estudiantes adolescentes ecuatorianos del área urbana. Arch Latinoam Nutr 2008; 58(2): 139-43.
28. You J, Choo J. Adolescent overweight and obesity: links to socioeconomic status and fruit and vegetable intakes. Int J Environ Res Public Health 2016; 13(3): 307.
29. Krinski K, Elsangedy HM, Hora S, Rech CR, Legnani E, Santos BV, et al. Estado nutricional e associação do excesso de peso com gênero e idade de crianças e adolescentes. Rev Bras Cineantropom Desempenho Hum 2011; 13(1): 29-35.
30. Tassitano RM, Barros MV, Tenório MC, Bezerra J, Hallal PC. Prevalência e fatores associados ao sobrepeso e à obesidade em adolescentes, estudantes de escolas de Ensino Médio de Pernambuco, Brasil. Cad Saúde Pública2009; 25(12): 2639-52.
31. Bertin RL, Karkle EN, Ulbrich AZ, Neto AS, Bozza R, Araújo IQ, et al. Estado nutricional e consumo alimentar de adolescentes da rede pública de ensino da cidade de São Mateus do Sul, Paraná, Brasil.Rev Bras Saúde Mater Infant 2008; 8(4): 435-43.
32. Júnior JC, Silva KS. Sobrepeso/obesidade em adolescentes escolares da cidade de João Pessoa - PB: prevalência e associação com fatores demográicos e socioeconômicos. Rev Bras Med Esporte 2008; 14(2): 104-8.
33. Nasreddine L, Mehio-Sibai A, Mrayati M, Adra N, Hwalla N. Adolescent obesity in Syria: prevalence and associated factors. Child Care Health Dev 2010; 36(3): 404-13.
34. Fernandes RA, Casonatto J, Christofaro DG, Ronque ER, Oliveira AR, Freitas Júnior IF. Riscos para o excesso de peso entre adolescentes de diferentes classes socioeconômicas. Rev Assoc Med Bras 2008; 54(4): 334-8.
35. Morgen CS, Mortensen LH, Rasmussen M, Andersen AM, Sorensen TI, Due P. Parental socioeconomic position and development of overweight in adolescence: longitudinal study of Danish adolescents. BMC Public Health 2010; 10:520.
36. Martin MA, Frisco ML, Nau C, Burnett K. Social stratification and adolescent overweight in the United States: how income and educational resources matter across families and schools. Soc Sci Med 2012; 74(4): 597-606.
37. Frutuoso MF, Bovi TG, Gambardella AM. Adiposidade em adolescentes e obesidade materna. Rev Nutr 2011; 24(1): 5-15.
38. Mendes MJ, Alves JG, Alves AV, Siqueira PP, Freire EF. Associação de fatores de risco para doenças cardiovasculares em adolescentes e seus pais. Rev Bras Saúde Mater Infant 2006; 6(1): 549-54.
39. McCrindle BW. Assessment and management of hypertension in children and adolescents. Nat Rev Cardiol 2010; 7(3):155-63.
40. Cao ZQ, Zhu L, Zhang T, Wu L, Wang Y. Blood pressure and obesity among adolescents: a school-based population study in China.Am J Hypertens 2012; 25(5): 576-82.
41. Flynn JT, Falkner BE. Obesity hypertension in adolescents: epidemiology, evaluation, and management. J Clin Hypertens 2011; 13(5): 323-31.
42. Passos MAZ, Cintra IP, Branco LM, Machado HC, Fisberg M. Body mass index percentiles in adolescents of the city of São Paulo, Brazil, and their comparison with international parameters. Arq Bras Endocrinol Metabol 2010; 54(3): 295-302.
43. Mendonça KL, Sousa AL, Carneiro CS, Nascente FM, Póvoa TI, Souza WK, et al. Does nutritional status interfere with adolescents’ body image perception? Eat Behav 2014; 15(3): 509-12.
Received on: 12/01/2015