www.jped.com.br
ORIGINAL
ARTICLE
Prevalence
and
factors
associated
with
body
mass
index
in
children
aged
9---11
years
夽
Gerson
Luis
de
Moraes
Ferrari
a,b,∗,
Victor
Matsudo
a,
Peter
T.
Katzmarzyk
c,
Mauro
Fisberg
baCentrodeestudosdoLaboratóriodeAptidãoFísicadeSãoCaetanodoSul(CELAFISCS),SãoCaetanodoSul,SP,Brazil
bUniversidadeFederaldeSãoPaulo(UNIFESP),DepartamentodePediatria,CentrodeAtendimentoeApoioaoAdolescente,São
Paulo,SP,Brazil
cPenningtonBiomedicalResearchCenter,BatonRouge,LA,UnitedStates
Received29August2016;accepted20December2016 Availableonline12May2017
KEYWORDS
Bodycomposition; Obesity;
Children; Publichealth
Abstract
Objective: Thisstudyaimedtoidentifytheprevalenceandfactorsassociatedwithbodymass
index(BMI)inchildrenaged9---11years.
Methods: ThestudyispartoftheInternationalStudyofChildhoodObesityLifestyleandthe
Environment(ISCOLE).Bodycompositionwasdeterminedusingthebipolarbioimpedance
tech-nique.ThemeanBMIvaluewascategorizedasrecommendedbytheWorldHealthOrganization.
Forsevenconsecutivedays,participantsusedanaccelerometertoobjectivelymonitor
seden-tarybehavior(SB)andmoderatetovigorousphysicalactivity.Individualfactors(anthropometric
and behavioral),familyaspects, andfamilyandschool environmentwere providedby
par-ticipantsandparentsandwereanalyzedbymultilevellinearregressionadjustedforgender,
ethnicity,school,numberofsiblings,andtotalannualfamilyincome.
Results: The mean BMI was 20.1kg/m2, and51.8% ofthe children were overweight/obese
(50.3%boys,53.4%girls,p=0.014).Consideringallparticipants,theassociatedfactorsofBMI
werebodyfatpercentage(BF%,ˇ=0.0216,p<0.001)andscreentime(ST,ˇ=0.0050,p=0.006).
Inboys,theassociatedfactorswereBF%(ˇ=0.0209,p<0.001),ST(ˇ=0.006,p=0.036),and
healthyeatingpolicies orpractices(ˇ=0.0276,p=0.025).In girls,only BF%was associated
(ˇ=0.0221,p<0.001)withBMI.
Conclusions: Highprevalenceofoverweight/obesitywasobservedinchildrenfromSãoCaetano
doSul.Differentassociatedfactorswereidentifiedbetweenthegenders,withonlyBF%being
commoninbothgenders.
©2017SociedadeBrasileiradePediatria.PublishedbyElsevierEditoraLtda.Thisisanopen
accessarticleundertheCCBY-NC-NDlicense(http://creativecommons.org/licenses/by-nc-nd/
4.0/).
夽
Pleasecitethisarticleas:FerrariGL,MatsudoV,KatzmarzykPT,FisbergM.Prevalenceandfactorsassociatedwithbodymassindexin childrenaged9---11years.JPediatr(RioJ).2017;93:601---9.
∗Correspondingauthor.
E-mail:[email protected](G.L.Ferrari). http://dx.doi.org/10.1016/j.jped.2016.12.007
602 FerrariGLetal.
PALAVRAS-CHAVE
Composic¸ãocorporal; Obesidade;
Crianc¸as; Saúdepública
Prevalênciaefatoresassociadosdoíndicedemassacorporalemcrianc¸asde 9-11anosdeidade
Resumo
Objetivo: Oobjetivodesteestudofoiidentificaraprevalênciaeosfatoresassociadosdoíndice
demassacorporal(IMC)emcrianc¸asde9-11anosdeidade.
Métodos: Oestudo faz partedo InternationalStudy ofChildhoodObesityLifestyle andthe
Environment(ISCOLE).Acomposic¸ãocorporalfoideterminadapelométododabioimpedância
bipolar.OvalormédiodoIMCfoi categorizadoconformesugeridopelaOrganizac¸ãoMundial
deSaúde. Durantesete diasconsecutivos,osparticipantesusaram acelerômetropara
mon-itorar objetivamente o comportamento sedentário (CS) e atividade física de moderada a
vigorosa.Fatoresassociadosindividuais(antropométricosecomportamentais),aspectos
famil-iares, ambiente familiar e escolar, foram preenchidos pelos participantes e pais e foram
analisados pela regressão linear multi-nível ajustados para sexo, rac¸a, escola, número de
irmãos,erendafamiliartotalanual.
Resultados: A médiado IMCfoi de 20,1kg/m2,sendoque 51,8%das crianc¸asestavamcom
excessodepeso/obesidade(50,3%meninos;53,4%meninas;p=0,014).Considerandotodosos
participantes,osfatoresassociadosdoIMCforamaporcentagemdegorduracorporal(%GC;
=0,0216;p<0,001)eotempo de tela(TT;=0,0050;p=0,006).Nosmeninos,os fatores
associadosforama%GC(=0,0209;p<0,001),TT(=0,006;p=0,036)epolíticasoupráticas
dealimentac¸ãosaudável(=0,0276;p=0,025).Jánasmeninas,somentea%GCfoiassociada
(=0,0221;p<0,001)comoIMC.
Conclusões: Mostramos valores elevados de prevalência de excesso de peso/obesidade em
crianc¸asde SãoCaetano doSul. Diferentes fatores associados foramidentificados entreos
sexos,sendosomentea%GCfoicomumemambosossexos.
©2017SociedadeBrasileiradePediatria.PublicadoporElsevierEditoraLtda.Este ´eumartigo
OpenAccesssobumalicenc¸aCCBY-NC-ND(http://creativecommons.org/licenses/by-nc-nd/4.
0/).
Introduction
The prevalence of overweight/obesity in children world-wide, includingBrazil, has increased in recent decades,1 raisingtheconcernofpublichealthauthorities,whichhave encouragedregionalandlocalgovernmentstoconsider dif-ferentstrategiestoreduceoverweight/obesity.2
Overweight/obesityis considered thefifth most impor-tantfactor foroverall mortalityanda determinantinthe developmentof chronic diseases,3 such asmetabolic syn-drome in children.4 Moreover, excess weight in this age groupandinadolescencetendstoremainuntiladulthood.5 Duetotheneedandimportanceofoverweight/obesity monitoring, and so that prevention programs are effec-tive, factors associated with excess weight need to be identified, since the prevalence in Brazilian children is high.6
Studies have found that overweight/obesity, when assessedbybodymassindex(BMI),areassociatedwiththe family’ssocioeconomicstatus,numberofsiblings,7 seden-tary lifestyle,8 screen time (ST) (TV, computer, or video games),9electronicequipmentinthebedroom,total seden-tarytime(SED),andmoderate-to-vigorousphysicalactivity (MVPA).10 However, there are limited data on the fac-tors associated with BMI in Brazilian children, especially thosemeasuredobjectively,suchasaccelerometry, which requiresacombinationoffinancialresourcesand technolog-icalknowledge,thusconstitutingachallengeforresearchers fromlowandmiddle-incomecountries.10
Inthisstudy,thehypothesiswastofindsignificant associ-ationsofindividual,family,andschool/familyenvironment factorsinchildren.Therefore,theaimofthisstudywasto assesstheindividualanthropometricandbehavioral,family, andschool/familyenvironmentfactorsassociatedwithBMI inchildrenaged9---11years.
Methods
Studysample
This multicenter cross-sectional study is part of the International Study of Childhood Obesity, Lifestyle, and the Environment (ISCOLE). ISCOLE was carried out in 12 countries, comprising the five geographic regions of the world.11 Details on ISCOLE have been previously published.11
Thepresent studyfocuses onthedatacollectedin the municipality of São Caetano do Sul, a representative of ISCOLEinBrazil,locatedinthestateofSãoPaulo.In2013, the municipality had 149,263 inhabitants, of whom 1557 werechildrenaged10years.10
(private).Twentyschools(16public)wereselectedtoobtain asampleof25---30childrenfromeachschool,withatarget andtotalrecruitmentof500children(50%foreachgender) betweentheagesof9---11years.
DatacollectionwasperformedbetweenMarch2012and April 2013 and allevaluations werecarried outduring an entireweekperschool.
Intotal,584children(287boys)wereassessedandmet thefollowing inclusioncriteria: (a)age between9and 11 years;(b)beingregularlyenrolledinaschoolofthe munic-ipality;and (c)having noclinical or functionallimitations thatwould preventthepracticeof dailyphysical activity. Incorrectorinvalidinformationaccountedfor236children. Therefore,thefinalsample included328children.Parents and/or guardians signed theinformed consent.The study wasapprovedbytheEthicsCommitteeofUniversidade Fed-eraldeSãoPaulo.
Bodycomposition
Height wasmeasured withaprecision of0.1cm,withthe childrenwerebarefoot,inaSeca213portablestadiometer (Seca®,Hamburg, Germany),with the head inthe
Frank-furtplane.Bodyweightandbodyfatpercentage(BF%)were measured using a Tanita SC-240 portable body composi-tionanalyzer(ArlingtonHeights,IL,USA)afterchildrenhad removedshoes,socks,andheavyitemsfromtheirpockets.12 Afterthedevicewasstarted,theparticipantwasinstructed tostand in the middle of the body composition analyzer, barefoot,withtheheelstouchingtheposteriorelectrodes and the front of the feet in contact with the anterior electrodes. Participants were in astable positionwithout bendingtheirknees.Twomeasurementsweretakenandthe mean wasusedin the analysis (athird measurement was obtained if the first two measurements had a difference greaterthan0.5kgor2.0%forbodymass).
BMI was calculated based on height and body weight (kg/m2),andthez-scorewasthencalculatedbasedonthe World HealthOrganization (WHO) growth reference data. Thechildren wereclassifiedas:underweight: <−2SD;
nor-mal weight: −2SD to 1SD; overweight >+1SD to 2SD; and
obesity:>+2SD.13
Waistcircumference(WC)measurementsweremadeon exposedskinattheendofanormalexpirationusinga non-elasticanthropometrictapebetweenthelowerribmargin andtheiliaccrest.11Participantswereaskedtostandinthe uprightpositionwithfeetside-by-sideandarmsrelaxedat thesideofthebody.
Accelerometry
An ActigraphGT3X accelerometer (ActiGraph, Ft. Walton Beach,USA)wasusedtoobjectivelymonitor totalST and MVPA.Thedevicewaswornatthewaistcoupledtoanelastic belt,ontherightmidaxillaryline.Participantswere encour-aged to use the accelerometer 24h per day for at least sevendays,includingtwoweekenddays.Thechildrenwere instructed to removethe accelerometer only for physical activitiesinwater.
The minimum amount of accelerometry data that was consideredacceptableforanalysiswasfourdays(including
atleast oneweekendday),withat least10h/dayofuse, afterremovalatbedtime.14,15Blocksof20min of consec-utivezerocountswereconsideredasnon-useofthedevice andwerediscardedfromtheanalyses.
Theresearchteamverifiedwhetherthedatawere com-pleteusingtheActilifesoftware(ActiGraph,Pensacola,FL, USA),version5.6.Datawere collectedata samplingrate of80Hz,downloadedinperiodsof1s,andaggregatedfor periodsof15s.16 Specifically,inthedatacalculation, ≤25 counts/15s aggregates were used for total ST and ≥574
counts/15s for MVPA,16 providing the best classification accuracybetweenthecutoffpointscurrentlyavailablefor totalSTandMVPAinchildren.15
Questionnaires
The children reported on ST using the Diet and Lifestyle Questionnaire.11 They were asked about howmany hours theywatched TVand how many hours they played video and/or computer games on weekdays and weekends.11 In addition to ST, the questionnaire contained informa-tion related to food consumption, physical activity, SED, breakfast,transportationtoschoolandsleep.Thechildren completedthequestionnaireregardingtheconsumptionof 23fooditemsinatypicalweek.Toidentifyexistingdietary patterns,maincomponentanalysis(MCA)wasused, consid-eringfooditemsasinputvariables.TheMCAwasperformed withthevarimaxorthogonal transformationtoforce non-correlation and improve interpretation. Two factors were identified: ‘‘unhealthy diet pattern’’ (fast food, potato chips,icecream,amongothers)and‘‘healthydietpattern’’ (vegetables,fruits,amongothers).Thetwoscoreswere con-sideredseparatelyandtreatedascontinuousvariables.
TheDemographicandFamilyHealthQuestionnaire con-taining information on children’s health history, parental educationallevel, parents’ body weightand height, fam-ilyincome,andcarownershipwasansweredbyparentsor guardians.Italsoincludedinformationonthechildren’sage, gender, number of siblings, and ethnicity. The Neighbor-hoodQuestionnaire wasusedto obtaininformation about the parents’ perceptions of the social environment, built neighborhood,eatinghabits,environmentforphysical activ-itypractice,andnumberofTVsathomeandwasanswered byparentsorguardians.TheSchoolEnvironment Question-naire,whichcontainsinformationaboutthecharacteristics ofschools,policiesandpracticesthatcaninfluencehealthy eatingandthepracticeofphysical activity,wasanswered byaschooladministrator.11
Statisticalanalysis
The Kolmogorov---Smirnov test was used to evaluate the normality of data. Data were described through means, standarddeviation (SD)frequencies andpercentages. The analyseswereperformedusingSPSS(IBMSPSSStatisticsfor Windows,version20.0;NY,USA).
604 FerrariGLetal.
associatedfactorsthathadp<0.10withBMIinthespecific modelswereincludedinthefinalmodel.Thevariableswith
p<0.05wereconsideredtobefactorsassociatedwithBMIin thefinalmodel.Thecovariatesusedinmultivariatemodels weregender,ethnicity,school,numberofsiblings,andtotal annualfamilyincome.
Multicollinearitywastestedthroughthecorrelation, tol-erance, and variance inflation factor. Variance inflation factor (VIF) valueshigher than 5 were considered indica-torsofproblemswhenestimatingthecoefficient,duetothe multicollinearity between theindependent variables. The Akaikeinformationcriterion(AIC)andBayesianinformation criterion(BIC)wereusedtocomparethemodels.
Results
In total, 698 participants received an informed consent form,ofwhich 662 weresigned. Completeaccelerometry and anthropometry data were retrieved for 495 and 564 participants, respectively. Regarding the questionnaires, 569participantspresentedcompletedatafortheDietand LifestyleQuestionnaire,515fortheDemographicandFamily HealthQuestionnaire,and512fortheNeighborhood Ques-tionnaire.
Completedata ofinterest for thestudy andall associ-atedfactorsinvestigatedwereavailablefor328participants (meanage=10.4 years[0.50]),of whom169(51.5%)were boysand159(48.5%%)weregirls.MeanBF%was23.5%(21.3 [9.6]inboysand25.8[9.0]ingirls;p<0.001).Basedonthe WHOreferencedata,13 1.2%ofthechildrenwereclassified asunderweight,47%asnormalweight,23.8%asoverweight, and28%asobese(51.8%wereoverweight/obese,ofwhom 50.3%wereboysand53.4%girls).ThemeanWCwas67.6cm (68 [11.7] for boys and 67.2 [9.8] for girls; p=0.544). The mean time spent in MVPA (min/day) was 59.3, 71.2 (27.0)for boysand46.6 (18.6)for girls,and totalST was 500min/day(boys:489;girls:511;p=0.005).Sample char-acterizationdetails andcomparisonsbetweenthegenders weredescribedbyFerrarietal.17
Table 1 presents the results of the univariate regres-sion.Ofthe22individualassociatedfactors(anthropometric andbehavioral,family,andschoolandfamilyenvironment), seven(p<0.10) wereassociatedwithBMI inboth genders together, six in boys and three in girls. Considering both genderstogether,BMI waspositivelyassociated withBF%, WC,ST,totalSED,andhavingaTVinthebedroom.BMIwas negativelyassociatedwitheatingbreakfastandMVPA.
Inboys,apositiveassociationwasobservedbetweenBMI andBF%,WC,sleepquality,ST,andhealthyeatingpolicies andpractices.AnegativeassociationofBMIwasobserved onlywithMVPA.Ingirls,BMIwaspositivelyassociatedwith BF% and WC. Additionally, BMI was negatively associated witheatingbreakfast(Table1).
In the multivariate models, the presence of multi-collinearity problems between BF%and WC variables was observed.The variableBF% presentedthe bestfit models (lowerAICandBICvalues),andwasthereforewasincluded inthemultivariatemodels.
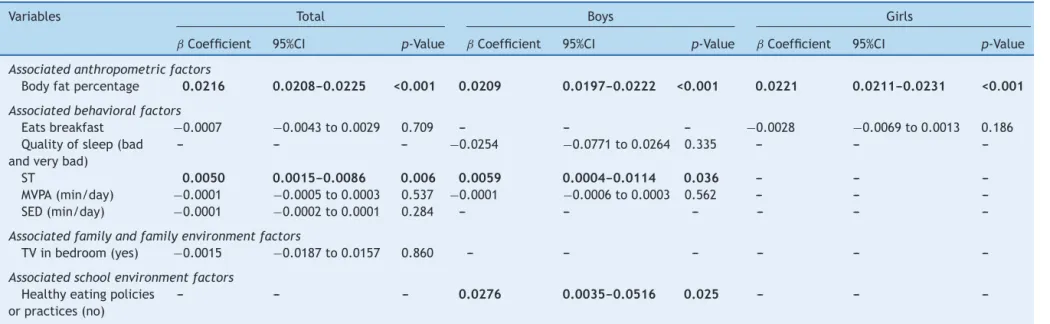
Considering both genders together, the significant and positiveassociated factorsof BMI(p<0.05) wereBF%and screentime.In boys,in additiontoBF% andscreen time,
BMI waspositivelyassociated withhealthy eatingpolicies and practices.In girls, onlyBF% waspositivelyassociated withBMI,whenadjustedforschooltype,gender,ethnicity, numberofsiblings,andtotalannualfamilyincome(Table2).
Discussion
ThisstudyaimedtoassesstheassociatedfactorsofBMIin children.Thepresentresultsshowedthat51.8%ofthe chil-dren (50.3% boys, 53.4% girls) were overweight/obese. In thetotalsample,theassociatedfactorsofBMIwereBF%and screentime.Inboys,theidentifiedassociatedfactorswere BF%,screentime,andhealthyeatingpoliciesorpractices. Ingirls,onlyBF%wasconsideredtobeafactorassociated withBMI.
Childhood overweight/obesity has increased dramat-ically in many countries, including Brazil, making its prevention and management a public health priority.1 The Family Budget Survey found a prevalence of over-weight/obesityof37.2%inchildren,being41.1%inboysand 33.2%ingirls.18Inthepresentstudy,aprevalenceof51.8% (50.3% in boys, 53.4% in girls) of overweight/obesity in a singleregionwasobserved.
Theincreasedprevalenceofoverweight/obesityisa mat-terofconcernduetotheincreasedriskofchildrenhaving excessweightinadolescence,aswellasinadultlife.5 Over-weight/obesityinchildrenisalsorelatedwithmanysevere consequences, includingmetabolic syndrome.4 Therefore, beingoverweightimpairstheindividual’shealthandquality oflifethroughouttheirlifetime.19
Theseresultssupportpreviousstudiesthatdocumented strongassociationsbetweenBMIandBF%inchildren.20,21Mei etal.21inadataanalysisoftheNationalHealthandNutrition ExaminationSurveyreportedcorrelationsof0.81and0.88 betweenBMI-for-ageandBF%inboysandgirls,respectively. Katzmarzyketal.20foundacorrelationof0.81betweenBMI and BF%in children.These results aresimilartothose of the present study,inwhich thecorrelation (totalsample) was0.92betweenBMIandBF%.
The present results showed significant associations betweenSTandBMI,beingconsistentwithlongitudinal stud-iesthatdemonstratedatemporalsequencebetweenscreen timeandincreaseinoverweight/obesity,andalsowithan interventionresearchshowingthatthereductionofscreen timemaydelayBMIincrease inadolescence.22 ForKimbro etal.,23 childrenwhosetimeislessstructuredfilluptheir freeperiodswithscreentime.
Martinez-Gomez et al.24 found a positive association betweenthenumberofriskfactors(forinstance,physical activityandST)andWC,BF%,andBMIinadolescents.Vioque etal.25found thatobeseadultsspentmoretimewatching TVthanthosewithnormalweight.Theauthorsalsofound thattheSTriskfactorismoreimportantforpredicting over-weight/obesitythanphysicalactivityasaprotectoragainst excessweight.Inthepresentstudy,noassociationofMVPA withBMIwasobserved.
mass
index
associated
factors
605
Table1 Univariatemodelsofanthropometric,behavioral,family,andschoolenvironmentfactorsassociatedwithBMIinchildren.a
Variables Total Boys Girls
ˇCoefficient 95%CI p-Value ˇCoefficient 95%CI p-Value ˇCoefficient 95%CI p-Value
Associatedanthropometricfactors
Bodyfat
percentage
0.022 0.021---0.023 <0.001 0.021 0.020---0.023 <0.001 0.022 0.021---0.023 <0.001
Waist
circumference(cm)
0.018 0.018---0.019 <0.001 0.018 0.017---0.018 <0.001 0.020 0.018---0.021 <0.001
Associatedbehavioralfactors
Unhealthydiet
pattern
0.006 −0.017to0.029 0.621 0.020 −0.013to0.053 0.228 −0.014 −0.047to0.020 0.415
Healthydiet
pattern
−0.018 −0.041to0.006 0.139 −0.017 −0.047to0.014 0.287 −0.014 −0.052to0.023 0.454
Eatsbreakfast −0.017 −0.028to0.006 0.002 −0.013 −0.030to0.003 0.111 −0.021 −0.036to−0.007 0.004
Transportationto
school(active)
0.023 −0.025to0.071 0.343 0.037 −0.033to0.108 0.298 0.025 −0.041to0.091 0.458
Transportationtime
toschool(≤15min)
0.046 −0.022to0.114 0.182 0.014 −0.079to0.107 0.771 0.082 −0.020to0.183 0.113
Transportationtime
toschool
([15---30]min)
0.005 −0.074to0.084 0.898 0.001 −0.104to0.105 0.987 0.002 −0.122to0.125 0.980
Sleepquality(bad
andverybad)
0.066 −0.043to0.174 0.236 0.157 −0.018to0.332 0.079 0.027 −0.112to0.166 0.701
Amountofsleep
(badandverybad)
0.030 −0.074to0.135 0.570 −0.031 −0.173to0.111 0.666 0.117 −0.040to0.273 0.144
ST 0.011 0.001to0.022 0.039 0.013 −0.002to0.028 0.099 0.009 −0.007to0.026 0.270
MVPA(min/day) −0.002 −0.003to0.001 0.001 −0.002 −0.004to−0.001 <0.001 −0.001 −0.002to0.001 0.438
SED(min/day) 0.001 0.000to0.001 0.083 0.001 0.000---0.001 0.128 0.001 0.000---0.001 0.216
Physicaleducation
classesatschool
−0.010 −0.034to0.014 0.407 −0.008 −0.040to0.023 0.606 −0.019 −0.058to0.020 0.339
Associatedfamilyandfamilyenvironmentfactors
Totalannualfamily
income(<R$19,620)
−0.007 −0.080to0.067 0.859 −0.036 −0.147to0.076 0.529 0.000 −0.099to0.100 0.994
Totalannualfamily
income(R$19,621
-<32,700)
0.019 −0.056to0.095 0.614 −0.001 −0.113to0.110 0.984 0.027 −0.082to0.136 0.629
Totalannualfamily
income(R$32,701
-58,860)
606
Ferrari
GL
et
al.
Table1 (Continued)
Variables Total Boys Girls
ˇCoefficient 95%CI p-Value ˇCoefficient 95%CI p-Value ˇCoefficient 95%CI p-Value
Numberofcars −0.003 −0.034to0.027 0.825 0.011 −0.034to0.057 0.629 −0.014 −0.056to0.028 0.514
NumberofTVsets
athome
−0.010 −0.035to0.015 0.431 −0.009 −0.044to0.027 0.627 −0.005 −0.042to0.031 0.783
TVinthebedroom
(yes)
0.049 −0.003to0.101 0.066 0.062 −0.013to0.137 0.105 0.048 −0.027to0.123 0.205
Numberofsiblings 0.000 −0.021to0.021 0.990 −0.004 −0.034to0.026 0.805 0.008 −0.021to0.038 0.578
Combinedlevelof
schoolingofparents
(didnotcomplete
highschool)
0.050 −0.022to0.122 0.173 0.046 −0.055to0.146 0.372 0.069 −0.035to0.173 0.190
Combinedlevelof
schoolingofparents
(completedhigh
schoolor
college/university)
0.008 −0.053to0.069 0.800 -0.005 −0.092to0.082 0.906 0.031 −0.054to0.117 0.471
Maternal
employmentlevel
(part-timeorless)
−0.019 −0.066to0.027 0.420 −0.049 −0.116to0.019 0.157 0.009 −0.057to0.074 0.797
Paternal
employmentlevel
(part-timeorless)
−0.006 −0.055to0.043 0.799 0.007 −0.064to0.078 0.845 −0.016 −0.085to0.054 0.655
Associatedschoolenvironmentfactors
Typeofschool
(private)
−0.062 −0.226to0.101 0.450 −0.022 −0.271to0.226 0.857 −0.107 −0.305to0.091 0.287
Physicalactivity
policiesorpractices
(no)
−0.011 −0.093to0.071 0.782 0.045 −0.063to0.153 0.388 −0.072 −0.162to0.018 0.111
Healthyeating
policiesorpractices
(no)
0.042 −0.038to0.121 0.285 0.091 −0.010to0.192 0.074 −0.009 −0.101to0.084 0.844
a Multilevellinearmodeladjustedforschooltype,gender,andethnicitywithrandomeffectofschool,andwithnon-standardbetacoefficientsareshown;
95%CI,95%confidenceinterval;BMI,bodymassindex;MVPA,moderatetovigorousphysicalactivity;ST,screentime;SED,sedentarytime:TV,television.
mass
index
associated
factors
607
Table2 Final(multivariate)modelofanthropometric,behavioral,family,andschoolenvironmentfactorsassociatedwithBMIinchildren.a
Variables Total Boys Girls
ˇCoefficient 95%CI p-Value ˇCoefficient 95%CI p-Value ˇCoefficient 95%CI p-Value
Associatedanthropometricfactors
Bodyfatpercentage 0.0216 0.0208---0.0225 <0.001 0.0209 0.0197---0.0222 <0.001 0.0221 0.0211---0.0231 <0.001
Associatedbehavioralfactors
Eatsbreakfast −0.0007 −0.0043to0.0029 0.709 --- --- --- −0.0028 −0.0069to0.0013 0.186
Qualityofsleep(bad
andverybad)
--- --- --- −0.0254 −0.0771to0.0264 0.335 --- ---
---ST 0.0050 0.0015---0.0086 0.006 0.0059 0.0004---0.0114 0.036 --- ---
---MVPA(min/day) −0.0001 −0.0005to0.0003 0.537 −0.0001 −0.0006to0.0003 0.562 --- ---
---SED(min/day) −0.0001 −0.0002to0.0001 0.284 --- --- --- --- ---
---Associatedfamilyandfamilyenvironmentfactors
TVinbedroom(yes) −0.0015 −0.0187to0.0157 0.860 --- --- --- --- ---
---Associatedschoolenvironmentfactors
Healthyeatingpolicies
orpractices(no)
--- --- --- 0.0276 0.0035---0.0516 0.025 --- ---
---a Multilevellinearmodel,includingallsignificantvariablesintheunivariatemodel,adjustedforschooltype,gender,ethnicity,numberofsiblingsandtotalannualfamilyincome,and
schoolwithrandomeffect.
95%CI,95%confidenceinterval;MVPA,moderatetovigorousphysicalactivity;SED,sedentarytime;ST,screentime. Note:Datainboldindicatesignificance(p<0.05).
608 FerrariGLetal.
promotionactionsaimed atschools andchildren. In addi-tiontoinitiativesin the fieldof publicpolicies indicating theencouragement of ahealthy dietasa priorityfor the promotionofhealthandfoodandnutritionalsecurity26the National Food and Nutrition Policy is in progress.26 From thisperspective, these results should bewidely disclosed inordertosubsidizeactionstobeimplemented,expanded, and/orreformulated.Furthermore,themaintenanceofthe surveillancesystemforhealthriskfactorsforchildrenshould bepartofthelistoffutureactions.27
Especially in children, prevention is universally seen as the best approach to reverse the increasing global prevalenceof overweight/obesity.1,2 Despite theapparent fascination of prevention, to date, there is limited evi-denceonthemosteffectivemeansofpreventingchildhood obesity.This maybepartlyrelatedtotherelatively small sample sizes for the expected effect size and/or insuffi-cientdurationofthelongitudinalstudyinmanyprevention trials.28 Prevention is multi-level andmeasures shouldbe institutedattheindividual,family,community,and institu-tionalhealthcarelevels.28
Thisstudycontributestotheexistingliteratureon over-weight/obesityinchildren,exploringtheroleofmodifiable life behaviors. This study has some strengthsthat should be highlighted: the robust quality and the guarantee of data collection procedures,11 as well as the inclusion of interveningvariablesthatwerecontrolledintheanalyses. Conversely, the fact that this was a cross-sectional study precludesthedeterminationofwhethertheseassociations areinanywaycausalorwhether,forinstance,screentime maybeamarkerofotherlifestylefactorsthatmayinfluence BMI,suchasdietaryfactors,socioeconomiclevel,physical activity,orothersedentaryactivities.However,the associ-ationsareconsistent withcross-sectionalstudies thatalso includedinterventionassessment.29 Thebiologicalagewas not controlled in the study, although most children were likelytobeprepubertal.Particularly,theresultsforhealthy andunhealthydietsshouldbetreatedwithcautiondueto thedifficultiesobservedwhenmeasuringthisbehavior.
Future studies should alsoaim to understand how dif-ferenttypesoftechnologyinfluenceoverweight/obesityin longitudinalstudies,sincethepresent studyonlyassessed totalscreentime.Thisisimportantforhealthprofessionals toplan publichealth strategies toreduce ST and, conse-quently,overweight/obesity.
High prevalence values of overweight/obesity were observedinchildrenfromSãoCaetanodoSul.Inboth gen-ders,whenconsideredtogether,thefactorsassociatedwith BMIwereBF%andST.Inboys,theidentifiedassociated fac-torswereBF%,ST,andhealthyeatingpoliciesorpractices. Ingirls,onlyBF%wasconsideredtobeassociatedwithBMI whenadjustedforgender,ethnicity,schooltype,numberof siblings,andtotalannualincome.
Funding
TheISCOLEBrazilresearchprojectwasfundedbythe Coca-Cola Company; P.T.K. is partially funded by Marie Edana Corcoraninobesityandchildhooddiabetes.
ISCOLE was sponsored by the Coca-Cola Company. The sponsor had no role in the study design, data collection
andanalysis,norinthepreparationofthismanuscriptand decisiontopublishit.
Conflicts
of
interest
Theauthorsdeclarenoconflictsofinterest.
Acknowledgements
The authors would like to thank all ISCOLE researchers, the participants, the parents and/or tutors,teachers and coordinatorsof theMunicipalEducationSecretariatofSão CaetanodoSul,andtheCityHallofSãoCaetanodoSul.
References
1.RiveraJA,deCossioTG,PedrazaLS,AburtoTC,SanchezTG, MartorellR.Childhoodandadolescentoverweightandobesityin LatinAmerica:asystematicreview.LancetDiabetesEndocrinol. 2014;2:321---32.
2.NgM,FlemingT,RobinsonM,ThomsonB,GraetzN,Margono C,et al. Global, regional, and nationalprevalence of over-weightand obesityin childrenandadultsduring1980---2013: asystematicanalysisfor theGlobalBurdenofDiseaseStudy 2013.Lancet.2014;384:766---81.
3.WorldHealthOrganization(WHO).Globalhealthrisks: mortal-ityandburdenofdiseaseattributabletoselectedmajorrisks. Geneva:WorldHealthOrganization;2009.
4.Cali AM, Bonadonna RC, Trombetta M, Weiss R, Caprio S. Metabolicabnormalities underlying the differentprediabetic phenotypes in obese adolescents. J Clin Endocrinol Metab. 2008;93:1767---73.
5.ParkS,BlanckHM,SherryB,BrenerN,O’TooleT.Factors asso-ciatedwith sugar-sweetened beverage intake among United Stateshighschoolstudents.JNutr.2012;142:306---12. 6.Pesquisa de Orc¸amentos Familiares (POF) 2008---2009:
Antropometriaeestadonutricionaldecrianc¸as,adolescentes e adultos no Brasil. Rio de Janeiro: Instituto Brasileiro de GeografiaeEstatística;2010.
7.OchiaiH,ShirasawaT,OhtsuT,NishimuraR,MorimotoA,Obuchi R,etal.Numberofsiblings,birthorder,andchildhood over-weight:apopulation-basedcross-sectionalstudyinJapan.BMC PublicHealth.2012;12:766.
8.Prentice-DunnH,Prentice-DunnS.Physicalactivity,sedentary behavior, and childhood obesity: a review of cross-sectional studies.PsycholHealthMed.2012;17:255---73.
9.Borghese MM, Tremblay MS, Leduc G, Boyer C, Belanger P, LeBlancAG,et al.Television viewingandfoodintake during televisionviewinginnormal-weight,overweightandobese 9-to11-year-oldCanadianchildren:across-sectionalanalysis.J NutrSci.2015;4:e8.
10.Ferrari GLM, Araujo TL, Oliveira LC, Matsudo V, Fisberg M. Associationbetweenelectronicequipmentinthebedroomand sedentarylifestyle,physicalactivity,andbodymassindexof children.JPediatr(RioJ).2015;91:574---82.
11.KatzmarzykPT,BarreiraTV,BroylesST,ChampagneCM,Chaput JP,Fogelholm M,etal.TheInternational StudyofChildhood Obesity,Lifestyle and the Environment (ISCOLE): designand methods.BMCPublicHealth.2013;13:900.
13.deOnisM,OnyangoAW,BorghiE,SiyamA,NishidaC,Siekmann J.DevelopmentofaWHOgrowthreferenceforschool-aged chil-drenandadolescents.BullWorldHealthOrg.2007;85:660---7. 14.ColleyR, ConnorGorberS,TremblayMS.Qualitycontroland
datareductionproceduresforaccelerometry-derivedmeasures ofphysicalactivity.HealthRep.2010;21:63---9.
15.Trost SG, Loprinzi PD, Moore R, Pfeiffer KA. Comparison of accelerometer cut points for predicting activity intensity in youth.MedSciSportsExerc.2011;43:1360---8.
16.Evenson KR, Catellier DJ, Gill K, Ondrak KS, McMurray RG. Calibrationoftwoobjectivemeasuresofphysicalactivityfor children.JSportsSci.2008;26:1557---65.
17.Ferrari GL, Matsudo VK, Barreira TV, Tudor-Locke C, Katz-marzyk PT, Fisberg M. Correlates of moderate-to-vigorous physical activity in Brazilian children. J Phys Act Health. 2016;13:1132---45.
18.Instituto Brasileiro de Geografia e Estatística. Pesquisa de Orc¸amentos Familiares 2008---2009: despesas, rendimentos e condic¸ões de vida. Rio de Janeiro: Instituto Brasileiro de GeografiaeEstatística;2010.
19.Han JC, Lawlor DA, Kimm SY. Childhood obesity. Lancet. 2010;375:1737---48.
20.KatzmarzykPT,BarreiraTV,BroylesST,ChaputJ-P,Fogelholm M,HuG,etal.Associationbetweenbodymassindexandbody fatin9---11-year-oldchildrenfromcountriesspanningarange ofhumandevelopment.IntJObesSuppl.2015;5:S43---6. 21.MeiZ,Grummer-StrawnLM,Pietrobelli A,GouldingA, Goran
MI, Dietz WH. Validity of body mass index compared with otherbody-compositionscreeningindexes fortheassessment ofbodyfatness inchildrenand adolescents.AmJClinNutr. 2002;75:978---85.
22.Robinson TN. Reducing children’s television viewing to pre-ventobesity:a randomizedcontrolledtrial.JAMA.1999;282: 1561---7.
23.Kimbro RT, Brooks-Gunn J, McLanahan S. Young children in urbanareas:linksamongneighborhoodcharacteristics,weight status, outdoor play, and television watching. Soc Sci Med. 2011;72:668---76.
24.Martinez-GomezD,MorenoLA,RomeoJ,Rey-LopezP,CastilloR, CaberoMJ,etal.Combinedinfluenceoflifestyleriskfactorson bodyfatinSpanishadolescents---theAvenastudy.ObesFacts. 2011;4:105---11.
25.VioqueJ,TorresA,QuilesJ.Timespentwatchingtelevision, sleepdurationandobesityinadultslivinginValencia,Spain. IntJObesRelatMetabDisord.2000;24:1683---8.
26.Brasil. Ministério da Saúde. Secretaria de Atenc¸ão a Saúde. Departamento de Atenc¸ão Básica. Política Nacional de Alimentac¸ão e Nutric¸ão. Brasília: Ministério da Saúde; 2013.
27.Levy RB,CastroIR,Cardoso LdeO, TavaresLF,SardinhaLM, Gomes Fda S, et al. Food consumption and eating behavior amongBrazilianadolescents:NationalAdolescentSchool-based HealthSurvey(PeNSE),2009.CienSaudeColet.2010;15Suppl 2:3085---97.
28.FosterBA,FarragherJ,ParkerP,SosaET.Treatment interven-tions for earlychildhood obesity: a systematic review.Acad Pediatr.2015;15:353---61.