ABSTRACT:Objective: To analyze the proile of 10 chronic noncommunicable diseases investigated in the National Health Survey carried out in Brazil in 2013 and their association with the self-rated health. Methods:
A cross-sectional, population-based nationwide study with 60,202 individuals aged 18 years old or more. Sampling process by conglomerate was carried out in three stages of selection: census tract, household, and individual. The prevalence of chronic diseases by age, gender and educational status and the conidence intervals of 95% , the mean age at the irst diagnosis and the proportion of limitation of the usual activities were calculated. To test the association with self-rated health, the logistic regression procedure adjusted for gender and age was used. Results: The more prevalent diseases were hypertension (21.4%), depression (7.6%), arthritis (6.4%), and diabetes mellitus (6.2%). Individuals diagnosed with stroke reported greater limitations in the daily activities (38.6%). There was a gradient in the prevalence by age and educational level, and all the diseases were more frequent among women. A worse self-rated health was observed among those with a diagnosis of stroke (OR = 3.60; p < 0.001) and those who referred two diseases (OR = 5.53; p < 0.001) or three or more diseases (OR = 10.86; p < 0.001). Conclusions: Because these diseases are associated with modiiable risk factors, the prevention with population focus is the best strategy to reduce the burden of these diseases.
Keywords: Chronic disease. Self-assessment. Cross-sectional studies. Health surveys. Epidemiology. Brazil.
Prevalence of chronic non-communicable
diseases and association with self-rated
health: National Health Survey, 2013
Prevalência de doenças crônicas não transmissíveis e associação
com autoavaliação de saúde: Pesquisa Nacional de Saúde, 2013
Mariza Miranda Theme FilhaI, Paulo Roberto Borges de Souza JuniorII,
Giseli Nogueira DamacenaII, Celia Landmann SzwarcwaldII ORIGINAL ARTICLE / ARTIGO ORIGINAL
INational School of Public Health, Fundação Oswaldo Cruz – Rio de Janeiro (RJ), Brazil.
IIInstitute of Scientiic and Technological Communication and Information in Health, Fundação Oswaldo Cruz – Rio de Janeiro
(RJ), Brazil.
Corresponding author: Mariza Miranda Theme Filha. Rua Leopoldo Bulhões, 1480, sala 813, Manguinhos, CEP: 21241-210, Rio de Janeiro, RJ, Brasil. E-mail: [email protected]
Conlict of interests: nothing to declare – Financial support: Ministry of Health, Health Surveillance Secretariat, process number
INTRODUCTION
The World Health Organization (WHO) deines cerebrovascular diseases, cardiovascular diseases, diabetes mellitus, obstructive respiratory diseases, asthma, and neoplasms, which share several risk factors, as chronic noncommunicable diseases (CNCD). It also includes in the list of chronic conditions the mental and neurological disorders; the bone and joint dis-eases; the mouth, eye and hearing disdis-eases; osteoporosis; and genetic disorders. Those are diseases that have long latency periods and prolonged course, which poses a great challenge for the public health1.
Since 1980, the Global Burden of Disease study has provided comprehensive estimates on the burden of 235 causes of death and 67 diferent risk factors in 21 regions of the world. The CNCDs are the most prevalent and account for most morbidity and mortality in world2. The WHO report on CNCDs published in 2011 pointed to these illnesses as the leading causes of death, surpassing together all the other causes and particularly afecting the countries of medium and low incomes3.
In Brazil, the study published on the global burden of disease (GBD) with data for 1998 showed that 59% of the years of life lost due to premature death and 74.7% of the years lived with disability were represented by the group of the CNCD4.
Owing to their chronic and often recurring nature, the CNCDs have a strong associa-tion with self-rated health. This is an indicator widely used in health surveys and considered a strong predictor of both morbidity and mortality, even when controlled by the presence of disease or disability. While it is measured using a single question, the self-rated health
RESUMO:Objetivo: Analisar o peril de dez doenças crônicas não transmissíveis investigadas na Pesquisa Nacional de Saúde realizada no Brasil em 2013 e sua associação com a auto-avaliação da saúde. Métodos: Estudo transversal de base populacional e abrangência nacional com 60.202 indivíduos com 18 anos ou mais. Foi utilizado processo amostral por conglomerado com três estágios de seleção: setor censitário, domicílio e indivíduo. Calculou-se a prevalência das doenças crônicas e os intervalos de coniança de 95% por idade, sexo e escolaridade, a idade média do primeiro diagnóstico e a proporção de limitação das atividades habituais. Para testar a associação com a auto-avaliação de saúde, utilizou-se o procedimento de regressão logística ajustada por sexo e idade. Resultados: As doenças mais prevalentes foram hipertensão arterial (21,4%), depressão (7,6%), artrite (6,4%) e diabetes mellitus (6,2%). Indivíduos com diagnóstico de acidente vascular cerebral (AVC) referiram maior limitação das atividades habituais (38,6%). Observou-se um gradiente na prevalência segundo idade e escolaridade, e todas as doenças foram mais frequentes entre as mulheres. Pior auto-avaliação de saúde foi encontrada entre aqueles com diagnóstico de AVC (OR = 3,60; valor de p < 0,001) e nos que referiram duas doenças (OR = 5,53; valor de p < 0,001) ou três ou mais doenças (OR = 10,86; valor de p < 0,001). Conclusões: Por se tratar de doenças associadas a fatores de risco modiicáveis, a prevenção com foco populacional é a melhor estratégia para redução da carga dessas doenças.
covers various dimensions of health, in an implicit ponderation process of these dimensions, suggesting that the feeling of well-being extrapolates the presence of objective conditions, although it has well-established relationships with clinical conditions and the morbidity and mortality indicators5.
In addition, the chronic course causes diferent degrees of limitation in usual activities that increase with the age. The evaluation of the degree of limitation as a result of CNCDs is also widely used in the health surveys. In addition to the self-rated health, the perception of the degree of limitation is easily questioned using a single question and has a high degree of con-cordance with the clinical evaluation. While the self-rated health is a global measure of health, the perception of limitations and disabilities is linked to the individual clinical conditions5.
Monitoring the prevalence of CNCDs, the related risk factors, the presence of limita-tions and disabilities, and questioning about the self-rated health enable us to obtain key indicators to deine health policies aimed at the prevention and control of these illnesses.
The objective of this research is to present the prevalence of some chronic diseases and the degree of limitation imposed by these illnesses investigated in the National Health Survey (PNS) of 2013 and to analyze its association with the self-rated health.
METHODS
The sample of the PNS is a subsample of the census tracts of the Geographic Operational Base of the 2010 Population Census, except for those with very small number of house-holds and the special sectors. The conglomerate sampling process was carried out in three stages with the stratiication of the primary sampling units (PSUs). The census tracts or set of sectors formed the PSUs, the households were the second stage units, and residents aged 18 years or more deined the units of the third stage. We selected 62,986 households, and 60,202 individuals responded to the individual interview. A responsible person in the selected household responded to the household questionnaire about all the residents, and an adult resident, randomly selected, responded to the individual interview. Because it is a complex sample, it was deined sample weights for the PSUs, for the households and all their inhabitants, and for the selected resident. More details about sampling and data col-lection can be found in the National Health Survey 2013 Report, published by the Brazilian Institute of Geography and Statistics (IBGE)6.
The variables related to 10 CNCDs [hypertension, diabetes mellitus, heart disease, cere-brovascular accident (CVA)/stroke, asthma, arthritis, work-related musculoskeletal disorders (WMSDs), depression, cancer, and chronic renal failure) and the self-rated health among the carriers of these diseases were considered. For the evaluation of the chronic diseases, the individual selected in the household was asked:
1. “Has any doctor given you the diagnosis of (disease)?”; 2. “How old were you at the irst diagnosis of (disease)?”;
We considered individuals with chronic diseases those who answered airmatively to the presence of at least one of the investigated diseases. A person could be afected by more than one chronic disease, and the presence of multimorbidities was analyzed considering the positive response to the diagnosis of two and three or more diseases.
The limitation of usual activities variable had ive options: no limits; a little; moder-ately; severely; and very severely. In the analysis of the percentage of limitation caused by the disease, the options moderately, severely, and very severely were aggregated. In partic-ular, for the limitation related to asthma, it was only asked to those that reported crisis in the last 12 months.
The self-rated health was assessed through the question (“In general, how do you eval-uate your health?”), with ive alternatives of answer: very good, good, moderate, poor, or very poor. In the analysis, the self-rated health variable was grouped into two categories: “good” (very good, good, and regular) and “poor” (poor or very poor).
The individuals diagnosed with one of the ten diseases investigated were analyzed according to age group, gender and years of schooling. For the variables age and gender, the proportional distributions and conidence intervals of 95% (95%CI) were calculated. Given that the chronic diseases are strongly associated with age and gender, to test the difer-ences in prevalence according to educational status, we used the multiple logistic regression model adjusted for these two variables. The same procedure was adopted to compare the proportion of poor self-rated health among the individuals with chronic diseases, having as a reference the good self-rated health.
The PNS project was approved by the National Research Ethics Commission (Conep), in June 2013, taking into account all the recommendations of the resolution 466/2012 of the National Health Council (NHC). The authors deny any conlict of interest.
RESULTS
Among the individuals who responded to the individual interview, 52% were women, 36.7%, between 18 and 34 years; 44.4%, between 35 and 59 years; and 18%, 60 years or older. As for the educational status, 38.7% had less than 8 years of schooling; 43.6%, between 8 and 11 years; and 17.5%, 12 years or more. Regarding the presence of the 10 CNCDs under analysis in this article, 62.7% reported no disease, 22.9% reported 1 disease, and 14.4% mul-timorbidities (9.2% with 2 diseases and 5.2% with 3 or more diseases). The poor self-rated health was reported by 33.9% of respondents.
the range of 40 – 49 years. The diagnosis of asthma was the one that happened earlier in life, on average at 18 years. The reference to moderate-to-intense limitation of usual activities was higher for diseases that afect the individuals later, such as stroke (38.6%) and arthritis (34.9%) (Table 1).
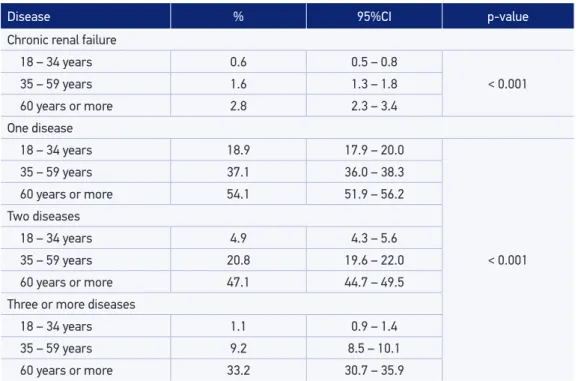
The distribution by age group reveals a signiicant gradient with the increasing age, except for asthma. Hypertension and diabetes mellitus were more prevalent among individuals aged 60 years or more (50.6 and 18.1%, respectively). The prevalence of depres-sion was similar in the age groups of 35 – 59 years (9.3%) and 60 years or more (9.5%). The proportion of WMSDs was higher in the group of 35 – 59 years (3.3%), reducing with an increasing age. The occurrence of 2 simultaneous diseases was 3.3 times higher among the individuals who were 35 – 59 years old and 5.6 times higher among those aged 60 years or older, using as a reference the age group of 18 – 34 years. The prevalence of three simultaneous diseases in the age group of 60 years or more was 3.7 times the prev-alence of the group of 35 – 59 years and almost 20 times compared with those between 18 and 34 years old (Table 2).
Hypertension was the most frequent disease in both the genders (18.3% among the men and 24.2% among the women). No statistically signiicant diferences by gender were
Disease Total sample
(n)
Individuals with diagnosis Mean age of
the individual
at the irst
diagnosis
% with limitation
of the usual
activities*
% 95%CI
Hypertension 12,885 21.4 20.8 – 22.0 44 12.1
Diabetes mellitus 3,753 6.2 5.9 – 6.6 49 16.0
Heart disease 2,516 4.2 3.9 – 4.5 45 27.0
CVA 918 1.5 1.4 – 1.7 53 38.6
Asthma 2,649 4.4 4.1 – 4.7 18 35.5**
Arthritis 3,860 6.4 6.1 – 6.7 43 34.9
WMSD 1,468 2.4 2.2 – 2.7 36 30.3
Depression 4,600 7.6 7.2 – 8.1 36 23.1
Cancer 1,103 1.8 1.6 – 2.0 52 19.5
Chronic renal failure 856 1.4 1.3 – 1.6 40 20.9
95%CI: conidence interval of 95%; CVA: cerebrovascular accident/stroke; WMSD: work-related musculoskeletal disorders; *moderate/severe/very severe limitation; **only for individuals who reported crisis in the last 12 months.
Table 1. Prevalence of diagnosis of selected chronic noncommunicable diseases among individuals aged 18 years or older by mean age at the irst diagnosis and limitation of usual activities owing
Disease % 95%CI p-value
Hypertension
18 – 34 years 4.2 3.8 – 4.6
< 0.001
35 – 59 years 24.1 23.1 – 25.0
60 years or more 50.6 48.9 – 52.4
Diabetes mellitus
18 – 34 years 0.7 0.5 – 0.9
< 0.001
35 – 59 years 6.1 5.6 – 6.7
60 years or more 18.1 16.9 – 19.4
Heart disease
18 – 34 years 1.0 0.8 – 1.3
< 0.001
35 – 59 years 3.9 3.5 – 4.4
60 years or more 11.4 10.3 – 12.7
CVA
18 – 34 years 0.1 0.1 – 0.2
<0.001
35 – 59 years 1.3 1.1 – 1.6
60 years or more 4.9 4.3 – 5.7
Asthma
18 – 34 years 4.6 4.2 – 5.1
0.092
35 – 59 years 4.1 3.7 – 4.5
60 years or more 4.8 4.1 – 5.5
Arthritis
18 – 34 years 1.4 1.2 – 1.8
< 0.001
35 – 59 years 6.5 6.1 – 7.1
60 years or more 16.4 15.3 – 17.7
WMSD
18 – 34 years 1.9 1.5 – 2.3
< 0.001
35 – 59 years 3.3 3.0 – 3.8
60 years or more 1.4 1.0 – 2.0
Depression
18 – 34 years 4.8 4.2 – 5.3
< 0.001
35 – 59 years 9.3 8.7 – 10.0
60 years or more 9.5 8.6 – 10.6
Cancer
18 – 34 years 0.4 0.2 – 0.6
< 0.001
35 – 59 years 1.6 1.3 – 1.8
60 years or more 5.6 4.9 – 6.4
Table 2. Prevalence of diagnosis of selected chronic noncommunicable diseases among individuals
aged 18 years or older by age group: PNS, Brazil, 2013.
Table 2. Continuation.
95%CI: conidence interval of 95%; CVA: cerebrovascular accident/stroke; WMSD: work-related musculoskeletal disorders.
Disease % 95%CI p-value
Chronic renal failure
18 – 34 years 0.6 0.5 – 0.8
< 0.001
35 – 59 years 1.6 1.3 – 1.8
60 years or more 2.8 2.3 – 3.4
One disease
18 – 34 years 18.9 17.9 – 20.0
< 0.001
35 – 59 years 37.1 36.0 – 38.3
60 years or more 54.1 51.9 – 56.2
Two diseases
18 – 34 years 4.9 4.3 – 5.6
35 – 59 years 20.8 19.6 – 22.0
60 years or more 47.1 44.7 – 49.5
Three or more diseases
18 – 34 years 1.1 0.9 – 1.4
35 – 59 years 9.2 8.5 – 10.1
60 years or more 33.2 30.7 – 35.9
observed for heart diseases, stroke, and chronic renal failure. All the other diseases under analysis were signiicantly more prevalent among women, including the presence of mul-timorbidities (two diseases and three or more diseases) (Table 3).
Except for asthma and WMSDs, all the diseases showed an inverse relationship with the educational status. After the adjustment for age and gender, there was a decrease in the strength of the association and loss of statistical signiicance for some diseases. Only stroke and arthritis maintained the inverse and signiicant gradient with the educational level. On the other hand, the diagnosis of cancer and WMSDs showed a direct and statistically signiicant association with a higher level of education. Individuals with hypertension, diabetes, and chronic renal failure showed a higher probability of experiencing the disease only among those with less than eight years of schooling (Table 4).
Disease % 95%CI p-value Hypertension
Male 18.3 17.5 – 19.1
< 0.001
Female 24.2 23.4 – 24.9
Diabetes mellitus
Male 5.4 4.8 – 5.9
< 0.001
Female 7.0 6.5 – 7.5
Heart disease
Male 3.9 3.5 – 4.4
0.115
Female 4.4 4.0 – 4.8
CVA
Male 1.6 1.3 – 1.9
0.314
Female 1.4 1.2 – 1.6
Asthma
Male 3.6 3.2 – 4.0
< 0.001
Female 5.1 4.7 – 5.5
Arthritis
Male 3.5 3.1 – 3.9
< 0.001
Female 9.0 8.5 – 9.6
WMSD
Male 1.5 1.2 – 1.8
< 0.001
Female 3.3 2.9 – 3.7
Depression
Male 3.9 3.5 – 4.4
< 0.001
Female 10.9 10.3 – 11.6
Cancer
Male 1.6 1.3 – 1.9
0.028
Female 2.0 1.8 – 2.3
Chronic renal failure
Male 1.4 1.1 – 1.6
0.426
Female 1.5 1.3 – 1.7
One disease
Male 27.9 26.9 – 28.9
< 0.001
Female 34.5 33.5 – 35.6
Two diseases
Male 13.4 12.6 – 14.3
Female 20.6 19.7 – 21.5
Three or more diseases
Male 5.3 4.7 – 6.0
Female 10.8 10.0 – 11.7
Table 3. Prevalence of diagnosis of selected chronic noncommunicable diseases among individuals
aged 18 years or older by gender: PNS, Brazil, 2013.
Disease % with
diagnosis Crude OR p-value OR adjusted p-value
Hypertension
< 8 31.1 2.63 < 0.001 1.27 < 0.001
8 – 11 years 16.7 1.16 0.012 1.05 0.460
12 years or more 14.7 1 1
Diabetes
< 8 9.6 2.81 < 0.001 1.48 < 0.001
8 – 11 years 5.4 1.50 < 0.001 1.26 0.052
12 years or more 3.6 1 1
Heart disease
< 8 6.3 2.38 < 0.001 1.14 0.349
8 – 11 years 3.1 1.12 0.417 0.95 0.734
12 years or more 2.7 1 1
CVA
< 8 2.7 3.83 < 0.001 2.58 < 0.001
8 – 11 years 0.8 1.13 0.558 2.23 < 0.001
12 years or more 0.7 1 1
Asthma
< 8 4.1 0.74 0.057 0.81 0.023
8 – 11 years 4.4 0.76 0.574 0.85 0.106
12 years or more 4.7 1 1
Arthritis
< 8 9.3 2.27 < 0.001 1.39 0.002
8 – 11 years 5.5 1.30 0.005 1.28 0.028
12 years or more 4.3 1 1
WMSD
< 8 2.0 0.66 < 0.001 0.57 < 0.001
8 – 11 years 1.9 0.63 < 0.001 0.69 0.005
12 years or more 3.0 1 1
Depression
< 8 8.6 1.24 < 0.001 0.94 0.433
8 – 11 years 6.9 0.99 0.886 0.81 0.014
12 years or more 7.0 1 1
Cancer
< 8 2.3 1.39 0.004 0.42 < 0.001
8 – 11 years 1.1 0.66 0.013 0.57 < 0.001
12 years or more 1.7 1 1
Table 4. Prevalence of diagnosis of selected chronic noncommunicable diseases among individuals aged 18 years or older by educational status and odds ratio adjusted for age and gender: PNS, Brazil, 2013.
Disease % with
diagnosis Crude OR p-value OR adjusted p-value Chronic renal failure
< 8 2.1 2.21 < 0.001 1.65 0.006
8 – 11 years 1.2 1.22 0.230 1.22 0.322
12 years or more 1.0 1 1
One disease
< 8 34.8 1.46 < 0.001 1.12 0.024
8 – 11 years 26.9 0.88 0.009 1.01 0.804
12 years or more 28.4 1 1
Two diseases
< 8 25.2 1.78 < 0.001 1.09 0.280
8 – 11 years 11.9 0.70 < 0.001 0.89 0.169
12 years or more 14.5 1 1
Three or more diseases
< 8 13.8 3.06 < 0.001 1.56 < 0.001
8 – 11 years 5.0 0.86 0.153 1.15 0.194
12 years or more 5.4 1 1
Table 4. Continuation.
OR: odds ratio; CVA: cerebrovascular accident/stroke; WMSD: work-related musculoskeletal disorders.
DISCUSSION
The results of this study suggest the importance of CNCDs in the illness proile of the Brazilian population, and the comparison with previous studies reveals the consolidation of our epidemiological transition. An analysis of the World Health Survey carried out in Brazil in 2003 had already shown the high prevalence of six CNCDs (arthritis, angina, asthma, depression, schizophrenia, and diabetes) being higher among women, for most of the analyzed diseases, and worse self-rated health compared with those individuals with no disease7. Data from the National Household Sample Survey (PNAD) of 2008 showed that the chronic diseases identiied by a doctor or health-care professional most often reported were hypertension (14%), spine disorders (13.5%), arthritis or rheumatism (5.7%), bron-chitis or asthma (5%), depression (4.1%), heart disease (4%), and diabetes (3.6%). With the increasing age, the number of diseases reported by the people also increased8. In this study, spinal disorders also showed a high prevalence in the population (18.5%), although, unlike PNAD, the information was obtained without reference to the medical diagnosis.
Disease % of “poor”
HSA Crude OR p-value OR adjusted p-value Hypertension
Yes 13.0 3.71
< 0.001 2.23 < 0.001
No 3.9 1 1
Diabetes
Yes 17.8 4.10
< 0.001 2.34 < 0.001
No 5.0 1 1
Heart disease
Yes 18.5 4.09
< 0.001 2.50 < 0.001
No 5.3 1 1
CVA
Yes 27.5 6.54
< 0.001 3.60 < 0.001
No 5.5 1 1
Asthma
Yes 9.9 1.83
< 0.001 1.86 < 0.001
No 5.6 1 1
Asthma
Yes 19.9 4.88
< 0.001 2.94 < 0.001
No 4.9 1 1
WMSD
Yes 7.2 1.26
0.129 1.28 0.119
No 5.8 1 1
Depression
Yes 15.9 3.59
< 0.001 3.14 < 0.001
No 5.0 1 1
Cancer
Yes 16.6 3.35
< 0.001 1.86 < 0.001
No 5.6 1 1
Chronic renal failure
Yes 18.8 3.87
< 0.001 2.80 < 0.001
No 5.6 1 1
One disease
Yes 6.4 3.72
< 0.001 3.09 < 0.001
No 5.6 1 1
Two diseases
Yes 12.2 7.53
< 0.001 5.53 < 0.001
No 5.0 1 1
Three or more diseases
Yes 23.1 16.34
< 0.001 10.86 < 0.001
No 4.3 1 1
HSA: health self-assessment; OR: odds ratio; CVA: cerebrovascular accident/stroke; WMSD: work-related musculoskeletal disorders.
Table 5. Prevalence of poor self-rated health among individuals aged 18 years or older with diagnosis of selected chronic noncommunicable disease and odds ratio adjusted for age and
in the prevalence with the age was observed, reaching, at the age group of 65 years or more, values between 48.2 and 66.2%. The same proile was found in the study carried out in São Paulo, with reference to the diagnosis of hypertension by 46.9% of individuals aged 60 or older, with a higher prevalence among women, those with educational status of uncompleted elementary school, and those who rated their health as poor or very poor, considering as a reference the assessment excellent/very good10.
Regarding heart disease, it ranked sixth, behind hypertension and diabetes mellitus, diseases that share the same risk factors and often occur together. The association of hypertension and diabetes was investigated in a study with PNAD data, showing that the standardized prevalence of diabetes alone increased from 2.9% in 1998 to 4.3% in 2008, while its associa-tion with hypertension increased from 1.7 to 2.8%. Although the results presented by PNAD were lower than those found in the PNS (prevalence of diabetes of 6.2%), in both the stud-ies, the pattern of higher prevalence among women and increase with age was maintained11. Among the cardiovascular diseases investigated in the PNS (hypertension, heart disease, and stroke), stroke was the one that showed the highest proportion of poor self-rated health and of limitation of usual activities. The observed pattern was very similar to the one found in the United States, which showed a prevalence adjusted for age of 2.6%, with great diferences according to gender and educational status12. Similarly, the data obtained from the Framingham study shows that about 50% of the survivors revealed a disability related to the disease with impairment ranging from moderate to severe13. Although the prevalence of the disease increases with age, a stroke may occur at any stage of life. In our data, 1.3% of the cases were in the range of 35 to 59 years old. Its occurrence among younger people has disproportionately greater economic impact, causing disability during the most productive years of life.
The observation in this study that asthma equally afects all age groups and is accompanied by a high degree of activity limitation among those that reported crisis in the last 12 months relects the natural history of the disease. Asthma afects people of all ages, and more recent estimates suggest that about 334 million people worldwide experience the disease; its preva-lence among various age groups is quite variable. Data from the WHO’s World Health Survey carried out between 2002 and 2003 revealed a prevalence of 4.3% of physician-diagnosed asthma in the age group of 18 – 45 years14. The burden of the disease, measured by disabil-ity and premature death, is higher among adolescents (10 – 14 years) and the elderly people (75 – 79 years), showing less impact among young adults (30 – 34 years). However, the disabil-ity component predominates among the younger, with direct impact on qualdisabil-ity of life and in the productive years15. Data from the Behavioral Risk Factor Surveillance System (BRFSS) from 2006 to 2009 carried out in the United States estimated at 8.4% the prevalence of asthma among adults (twice the prevalence found in the PNS), being lower among individuals aged older than 65 years (7.6% among the women and 6.3% among the men)16.
a higher risk of developing cardiovascular diseases (especially, ischemic heart disease) and type 2 diabetes and show a strong association with arthritis17-19.
The presence of multimorbidities is a key issue when one analyzes the chronic diseases. There are clearly interrelationships between them, and the occurrence of various diseases together is associated with the worsening of the self-rated health. A study on the incidence of lung, breast, and colorectal cancers showed that these types of cancer occur with cer-tain frequency in individuals with diabetes and cardiovascular disease, and the concomitant presence of the cancer with these diseases is associated with the negative perception of the health status and the reduced longevity20. The same behavior was observed regarding poor control of hypertension and its association with cardiovascular diseases and the develop-ment of chronic renal failure. In addition, in this case, the simultaneous presence of these diseases correlated with a worse health evaluation21.
In response to the persistent increase in the CNCDs, the Ministry of Health has invested in several consistent policies for controlling them, culminating in the preparation of the Strategic Action Plan to Combat Chronic Noncommunicable Disease in Brazil in 2011. The plan projects for the next 10 years the development and implementation of efective, integrated, sustain-able, and based on scientiic evidence public policies for the prevention and control of CNCDs, including stroke, myocardial infarction, hypertension, cancer, diabetes, and chronic respira-tory diseases and their risk factors, considering three strategic areas: surveillance, information, evaluation, and monitoring; health promotion; and comprehensive care22.
Given the complex determination of the health–disease process, we believe that these initiatives possess a good chance of success by reaching the entire population. However, we emphasize that these actions should be sustained and maintained over time. In addition, the burden of the CNCDs can be considerably reduced in the short and medium terms if the population approach is complemented by interventions aimed at high-risk individuals and supported by guaranteed access to timely and quality health services.
CONCLUSIONS
1. World Health Organization. Preventing chronic diseases a vital investment. Geneva; 2005.
2. Lozano R, Naghavi M, Foreman K, Lim S, Shibuya K, Aboyans V, et al. Global and regional mortality from 235 causes of death for 20 age groups in 1990 and 2010: a systematic analysis for the Global Burden of Disease Study 2010. Lancet 2012; 380(9859): 2095-128.
3. World Health Organization. Global status report on noncommunicable diseases, 2010. Geneva; 2011. Disponível em: http://www.who.int/nmh/publications/ncd_report_ full_en.pdf (Acessado em 30 de março de 2015).
4. Andrade Schramm JM, Oliveira AF, Leite IC, Valente JG, Gadelha AMJ, Portela MC, et al. Transição epidemiológica e o estudo de carga de doença no Brasil. Ciênc Saúde Coletiva 2004; 9(4): 897-908.
5. Theme Filha MM, Szwarcwald CL, Souza Junior PRB. Measurements of reported morbidity and interrelationships with health dimensions. Rev Saúde Pública 2008; 42(1): 73-81.
6. Instituto Brasileiro de Geograia e Estatística. Pesquisa Nacional de Saúde 2013. Disponível em: ftp://ftp. ibge.gov.br/PNS/2013/notastecnicas.pdf (Acessado em 30 de março de 2015).
7. Theme Filha MM, Szwarcwald CL, Souza Junior PRB. Características sócio-demográicas, cobertura de tratamento e auto-avaliação da saúde dos indivíduos que referiram seis doenças crônicas no Brasil, 2003. Cad Saúde Pública 2005; 21(Suppl 1): S43-S53.
8. Instituto Brasileiro de Geograia e Estatística. Pesquisa Nacional por Amostra de omicílios (PNAD 2008), um panorama da Saúde no Brasil: acesso e utilização dos serviços, condições de saúde e fatores de risco e proteção à saúde. Rio de Janeiro: IBGE; 2010.
9. Muraro AP, Santos DF, Rodrigues PRM, Braga JU. Factors associated with self-reported systemic arterial hypertension according to VIGITEL in 26 Brazilian capitals and the Federal District in 2008. Cienc Saúde Coletiva 2013; 18(5): 1387-98.
10. Mendes TAB, Goldbaum M, Segri NJ, Barros MBA, César CLG, Carandina L. Factors associated with the prevalence of hypertension and control practices among elderly residents of São Paulo city, Brazil.Cad Saúde Pública2013; 29(11): 2275-86.
11. Freitas LRS, Garcia LP. Evolução da prevalência do diabetes e deste associado à hipertensão arterial no Brasil: análise da Pesquisa Nacional por Amostra de Domicílios, 1998, 2003 e 2008. Epidemiol Serv Saúde 2012; 21(1): 7-19.
12. Centers for Disease Control and Prevention (CDC). Prevalence of stroke – United States, 2006- 2010. MMWR 2012; 61(20): 379-82.
13. Kelly-Hayes M, Beiser A, Kase CS, Scaramucci A, D’Agostino RB, Wolf PA. The inluence of gender and age on disability following ischemic stroke: the Framingham Study. J Stroke Cerebrovasc Dis 2003; 12(3): 119-26.
14. Smajlovic D. Strokes in young adults: epidemiology and prevention. Vasc Health Risk Manag 2015; 11: 157-64.
15. To T, Stanojevic S, Moores G, Gershon AS, Bateman ED, Cruz AA, et al. Global asthma prevalence in adults: indings from the cross-sectional world health survey. BMC Public Health 2012; 12: 204.
16. Marks G, Pearce N, Strachan D, Asher I. Global Burden of Disease due to Asthma. In: Global Asthma Network. The Global Asthma Report 2014. Auckland: Global Asthma Network; 2014.
17. Seligman F, Nemerof CB. The interface of depression and cardiovascular disease: therapeutic implications. Ann N Y Acad Sci 2015; 1345: 25-35.
18. Yu M, Zhang X, Lu F, Fang L. Depression and risk for diabetes: a meta-analysis. Can J Diabetes 2015; 39(4): 266-72.
19. Lin MC, Guo HR, Lu MC, Livneh H, Lai NS, Tsai TY. Increased risk of depression in patients with rheumatoid arthritis: a seven-year population-based cohort study. Clinics 2015; 70(2): 91-6.
20. Petrick JL, Foraker RE, Kucharska-Newton AM, Reeve BB, Platz EA, Stearns SC, et al. Trajectory of overall health from self-report and factors contributing to health declines among cancer survivors. Cancer Causes Control 2014; 25(9): 1179-86.
21. Marín R, Fernández-Vega F, Gorostidi M, Ruilope LM, Díez J, Praga M, et al. Blood pressure control in patients with chronic renal insuiciency in Spain: a cross-sectional study. J Hypertens 2006; 24(2): 395-402.
22. Brasil. Ministério da Saúde. Secretaria de Vigilância em Saúde. Departamento de Análise de Situação de Saúde. Plano de Ações Estratégicas para o Enfrentamento das Doenças Crônicas Não Transmissíveis (DCNT) no Brasil 2011-2022. Brasília: Ministério da Saúde; 2011.
23. Daar AS, Singer PA, Persad DL, Pramming SK, Matthews DR, Beaglehole R, et al. Grand challenges in chronic non-communicable diseases: the top 20 policy and research priorities for conditions such as diabetes, stroke and heart disease. Nature 2007; 450: 494-6.
Received on: 04/29/2015
Final version presented on: 06/16/2015 Accepted on: 07/16/2015