33
ABSTRACT:Objective: To investigate the determinants of self-rated health in Brazil and the inluence of healthy lifestyles. Methods: We used data from the National Health Survey (PNS), 2013. The self-rated health was categorized as very good/good, fair, and poor/very poor. Diferences in the distribution of self-rated health according to the age group and sex were tested. Logistic regression models were used to test the efects of educational level, race/skin color, and the presence of at least one noncommunicable chronic disease on poor/very poor health perception. In addition, the inluence of healthy behaviors was tested controlling for the efects of sociodemographic factors and the presence of at least one chronic disease. Results: We analyzed 60,202 individuals; about 66.1% rated their health as very good/good and 5.9% as poor/very poor; about 47.1% reported the diagnosis of at least one noncommunicable chronic disease; and only 9.3% reported a “healthy lifestyle” (do not use tobacco products, consume fruits and vegetables properly, and do physical activity during leisure time). Among the sociodemographic factors, age, sex, educational level, and race were signiicantly associated with self-rated health and the presence of at least one chronic disease. The efects of all healthy behaviors were statistically signiicant even after controlling for the other determinants. Conclusion: Although the adoption of healthy lifestyles in Brazil is still insuicient, the association of healthy practices with self-perception of health found in this study is an indication that the Brazilian population is beginning to relate healthy behaviors to their well-being and better health evaluation.
Keywords: Data collection. Morbilidad. Epidemiologic factors. Chronic disease. Healthy lifestyles. Brazil.
Determinants of self-rated health and
the inluence of healthy behaviors: results
from the National Health Survey, 2013
Determinantes da autoavaliação de saúde no Brasil e a inluência dos
comportamentos saudáveis: resultados da Pesquisa Nacional de Saúde, 2013
Celia Landmann SzwarcwaldI, Giseli Nogueira DamacenaI, Paulo Roberto Borges de Souza JúniorI,
Wanessa da Silva de AlmeidaI, Lilandra Torquato Medrado de LimaI, Deborah Carvalho MaltaII,
Sheila Rizzato StopaII, Maria Lúcia França Pontes VieiraIII, Cimar Azeredo PereiraIII ORIGINAL ARTICLE / ARTIGO ORIGINAL
IInstituto de Comunicação e Informação Cientíica e Tecnológica em Saúde, Fundação Oswaldo Cruz – Rio de Janeiro (RJ), Brazil. IIDepartment of Surveillance of Non-Communicable Diseases and Health Promotion, Secretariat of Health Surveillance, Ministry of Health – Brasília (DF), Brazil.
IIIInstituto Brasileiro de Geograia e Estatística – Rio de Janeiro (RJ), Brazil.
Corresponding author: Celia Landmann Szwarcwald. Instituto de Comunicação e Informação Cientíica e Tecnológica em Saúde, Fundação Oswaldo Cruz, Avenida Brasil, 4.365 – ICICT, Sala 225, Manguinhos, CEP: 21040-360, Rio de Janeiro, RJ, Brasil. E-mail: [email protected]
34
INTRODUCTION
Historically, the studies meant to establish that the health status of a population was based on mortality indicators. However, the increased longevity in developed countries brought the need for developing new health indicators, which would include measures of quality of life1. Because
a long life does not necessarily mean a healthy one, it is, nowadays, a consensus that mortality indicators are not enough in order to properly characterize the status of a population’s health2,3.
Over the past decades, diferent health indicators that considered morbidity and the dis-abilities and functional limitations have been proposed in order to complement the studies on mortality4-6. In the health surveys, the self-rated health (SRH) has been widely used in order to
describe the health status of a population7, to establish the diferences of morbidity in
popula-tional subgroups, to compare the needs for services and health resources by geographic areas, and to calculate other mortality and morbidity indicators such as the hope of a healthy life8-11.
The individual perception of the health status has been considered as an important indi-cator by itself, because the level of welfare of an individual may inluence their lifestyle12.
On the other hand, the utility of the SRH also comes from its validity, established by their relations with the clinical conditions and with morbidity and mortality indicators13,14.
Researches have demonstrated that the perception of health, frequently, agrees with the evaluation made by the doctor15. In terms of mortality, because researchers conirmed the
association between bad SRH and the increased risk of premature death still in the 1980s16,17,
several studies have demonstrated that a bad health perception is an important predictor of lower survival18-20. While the “objective” evaluation of the health status of an individual,
from the medical point of view, refers to the identiication of a disease indicated by a set
RESUMO:Objetivo: Investigar os determinantes da autoavaliação de saúde (AAS) no Brasil e a inluência dos comportamentos saudáveis. Métodos: Foram usados os dados da Pesquisa Nacional de Saúde (PNS) de 2013. A AAS foi categorizada em muito boa/boa, regular, ruim/muito ruim. Foram testadas diferenças na distribuição da AAS segundo faixa de idade e sexo e foram usados modelos de regressão logística para investigar os efeitos de grau de escolaridade, raça/cor e presença de pelo menos uma doença crônica não transmissível (DCNT) sobre a AAS ruim/ muito ruim. Adicionalmente, testou-se a inluência dos comportamentos saudáveis, controlando-se os efeitos dos fatores sociodemográicos e presença de pelo menos uma DCNT. Resultados: Foram analisados 60.202 indivíduos, 66,1% avaliaram o seu estado de saúde como muito bom/bom, e 5,9%, como ruim/muito ruim; 47,1% referiram o diagnóstico de pelo menos uma DCNT; e apenas 9,3% disseram ter “estilo de vida saudável” (não usa produtos de tabaco, consome frutas e hortaliças e pratica atividade física no lazer). Entre os fatores sociodemográicos, idade, sexo, grau de escolaridade e raça mostraram associações signiicativas com a AAS, bem como a presença de pelo menos uma DCNT. Os efeitos de todos os comportamentos saudáveis foram signiicativos, mesmo após o controle dos demais determinantes. Conclusão: Embora a adoção dos comportamentos saudáveis no Brasil ainda seja insuiciente, a associação dos hábitos saudáveis com a percepção da saúde encontrada neste estudo é um indício de que a população brasileira já começa a relacionar os comportamentos saudáveis ao seu bem-estar e à avaliação melhor da saúde.
35
of signals, symptoms, and laboratory results, the SRH is subjective, combining physical, emotional, and well-being and life satisfaction components21,22. Besides that, studies indicate
that a poor health self-perception may occur even in the absence of diagnosis of a disease, suggesting that there are feelings that create a bad perception of one’s own health before medical identiication of the disease23.
Brazil is currently going through a period of epidemiological transition, with an expressive growth of chronic noncommunicable diseases (NCDs)24. In the new scenario, eforts are being
made for the promotion of healthy behaviors25,26 not only in order to support the policies of
prevention of chronic disease but also to improve the quality of life of the Brazilian population. Using the data from the National Health Survey (Pesquisa Nacional de Saúde—PNS) of 2013, this study possessed the objective of investigating the SRH of Brazilians, in order to identify the main sociodemographic determinants, establishing the diference by the occur-rence/absence of diagnosis of at least one chronic disease, and analyzing the inluence of healthy behaviors in the perception of the health status.
METHODOLOGY
The PNS was a home-based research carried out by the Ministry of Health and the Oswaldo Cruz Foundation in partnership with the Brazilian Institute of Geography and Statistics (Instituto Brasileiro de Geograia e Estatística – IBGE) in the years of 2013 and 2014. The project was approved by the National Research Ethics Commission (CONEP) in June 2013.
The sample of the PNS is a subsample of the Master Sample of the Integrated System of Household Surveys (Sistema Integrado de Pesquisas Domiciliares – SIPD) from IBGE27. It was
selected by cluster sampling in three stages, with stratiication of the primary sampling units (PSUs). In the irst stage, for each stratum, the selection of the PSUs was performed by simple random sampling. In the second stage, for each PSU, a ixed number of house-holds were selected in a random manner. In the third stage, for each household, a resident aged 18 years or older was randomly selected.
In total, 81,254 households were visited, of which 69,994 households were occupied. A total of 64,348 household interviews were performed and 60,202 with the selected residents.
In this study, the information of the individual questionnaire was analyzed. The anal-ysis of the SRH was based on the following questions: “In general, how do you evaluate your health?” The answers varied from 1 (very good) to 5 (very bad), which were grouped in three categories (very good/good; regular; and bad/very bad).
The following sociodemographic characteristics were considered: gender (male; female); age range (18 – 29; 30 – 39; 40 – 49; 50 – 59; 60 – 69; and 70+ years); education degree (no instruction/incomplete elementary school; complete elementary school/incomplete high school; complete high school/incomplete college degree; and complete college degree); and race/color (Caucasian/white; black; brown; and other).
36
including hypertension, diabetes, heart diseases, stroke (AVC), asthma, arthritis, chronic spine problem, musculoskeletal disorder related to work (MSD), depression, other mental disorder, lung disease, cancer, chronic kidney failure, and other chronic physical or mental disease not previously speciied. The presence of NCD was considered when there was at least one air-mative answer and the absence of it when all the answers were negative.
For the analysis of the inluence of healthy behaviors on the SRH, the following hab-its were considered: smoking (currently smokes any tobacco product; has already smoked a tobacco product; and has never smoked); physical activity in leisure (practice of physi-cal activity in leisure at the recommended level – 150 minutes or more of light/moderate physical activities or 75 minutes or more in vigorous physical activity a week); and recom-mended consumption of vegetables and fruits (consumption of vegetable and fruit at least 5 times a day). In addition, a variable called “healthy lifestyle” was composed, adding up people who possess all the healthy habits.
A statistical application was used, which takes into account the efect of the sampling plan. For the SRH associations, test with the groups of age and gender and the χ2
-homoge-neity tests were used. For a multivariate analysis, models of logistic regression were used, presenting as variables the self-assessment answer bad/very bad and as independent vari-ables age, gender, education degree, race/color, and the presence of at least one NCD. In addition to that, the efects of healthy behaviors were tested with controlled sociodemo-graphic factors and the presence of some NCD.
RESULTS
A total of 60,202 individuals investigated by the PNS were analyzed (47.1% male and 52.9% female subjects) (Table 1). The age varied from 18 to 101 years, with a mean value of 43 years and median of 41 years. The distribution by age range showed that 81.9% of them were aged between 18 and 59 years and 18.1% aged 60 years or older.
The results by education degree showed that 38.9% of them do not possess complete elementary school degree and that 12.8% of them possessed a complete college degree. In relation to the color of the skin/race, 47.5% of them reported themselves as white/ Caucasian, 42.0%, brown, and 9.2%, black (Table 1).
In relation to one’s health self-perception, 66.1% of them evaluated their health as very good or good; 28% as regular; and 5.9% as bad or very bad. Among all the individuals inves-tigated in the PNS, 47.1% reported the diagnosis of at least one chronic disease (Table 1).
37
Variables n %
Gender
Male 28,357 47.1
Female 31,845 52.9
Age range (years)
18 – 29 15,701 26.1
30 – 39 13,020 21.6
40 – 49 10,872 18.0
50 – 59 9,742 16.2
60 – 69 6,129 10.2
70 and older 4,738 7.9
Education degree
Incomplete elementary school 23,438 38.9
Complete elementary school/incomplete high school 9,347 15.5 Complete high school/complete college degree 19,749 32.8 Complete college degree and more 7,668 12.8 Race/color
Causasian/white 28,573 47.5
Black 5,536 9.2
Brown 25,272 42.0
Other 821 1.3
Self-rated health
Very good/good 39,810 66.1
Regular 16,887 28.0
Bad/very bad 3,507 5.9
Diagnosis of at least one NCD
Yes 28,346 47.1
No 31,856 52.9
Intake of fruit and vegetable
Yes 37,478 37.3
No 22,724 62.7
Practice of physical activity in leisure
Yes 46,682 22.5
No 13,520 77.5
Smoking of any tobacco product
Current 8,855 14.7
Past 10,509 17.5
Never smoked 40,838 67.8
Healthy lifestyle
Yes 54,586 9.3
No 5,616 90.7
Table 1. Distribution of individuals by sociodemographic characteristics, health self-assesment, diagnosis of at least one chronic noncommunicable disease and healthy behaviors. National
Health Survey, Brazil, 2013.
38
In Table 2, the distributions of self-evaluation of the health status according to gender and age range are presented. The comparison by age range shows a signiicant gradient (p < 0.001) with the increasing age: the proportion to the very good/good SRH decreases from 81.6%, among people between 18 and 29 years of age, to 41.4%, in the group of those who are 70 years or older. The diferences by gender were also observed. The self-percep-tion of health is always worse among women, regardless of their age range. On average, the diference in the proportion of the good/very good SRH for female subjects (62.4%) in relation to that found for male subjects (70.3%) is almost 8%.
Gender/Age range (years)
Self-rated health
p-value
Very good/good Regular Bad/very bad
n % n % n %
Male
18 – 29 years 6,630 85.2 1,021 13.1 131 1.7
< 0.001 30 – 39 years 4,873 78.5 1,188 19.1 147 2.4
40 – 49 years 3,449 69.4 1,272 25.6 249 5.0
50 – 59 years 2,742 58.9 1,600 34.4 315 6.7
60 – 69 years 1,320 49.3 1,104 41.2 254 9.5
70 years and older 910 44.1 889 43.1 263 12.8
Total 19,924 70.3 7,074 24.9 1,359 4.8
Female
18 – 29 years 6,184 78.1 1,583 20.0 151 1.9
< 0.001 30 – 39 years 4,951 72.7 1,600 23.5 261 3.8
40 – 49 years 3,607 61.1 1,884 31.9 411 7.0
50 – 59 years 2,548 50.1 2,010 39.5 528 10.4
60 – 69 years 1,546 44.8 1,497 43.4 408 11.8
70 years and older 1,050 39.2 1,239 46.3 387 14.5
Total 19,886 62.4 9,813 30.8 2,146 6.8
Total
18 – 29 years 12,814 81.6 2,604 16.6 283 1.8
< 0.001 30 – 39 years 9,824 75.5 2,788 21.4 408 3.1
40 – 49 years 7,056 64.9 3,156 29.0 660 6.1
50 – 59 years 5,289 54.3 3,610 37.1 843 8.6
60 – 69 years 2,866 46.8 2,600 42.4 662 10.8
70 years and older 1,960 41.4 2,128 44.9 651 13.7
Total 39,809 66.1 16,886 28.0 3,507 5.9
Table 2. Distribution of individuals by categories of self-rated health, according to gender and
39
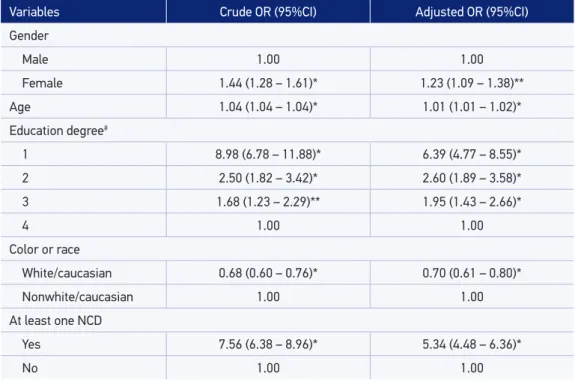
Variables Crude OR (95%CI) Adjusted OR (95%CI)
Gender
Male 1.00 1.00
Female 1.44 (1.28 – 1.61)* 1.23 (1.09 – 1.38)**
Age 1.04 (1.04 – 1.04)* 1.01 (1.01 – 1.02)*
Education degree#
1 8.98 (6.78 – 11.88)* 6.39 (4.77 – 8.55)*
2 2.50 (1.82 – 3.42)* 2.60 (1.89 – 3.58)*
3 1.68 (1.23 – 2.29)** 1.95 (1.43 – 2.66)*
4 1.00 1.00
Color or race
White/caucasian 0.68 (0.60 – 0.76)* 0.70 (0.61 – 0.80)*
Nonwhite/caucasian 1.00 1.00
At least one NCD
Yes 7.56 (6.38 – 8.96)* 5.34 (4.48 – 6.36)*
No 1.00 1.00
Table 3. Results of the univariate and multivariate models of logistic regression showing the outcome of very bad/bad self-rated health. National Health Survey, Brazil, 2013.
*p-value < 1%; **p-value < 5%.
#1-No instruction/incomplete elementary school; 2-Complete elementary school/incomplete high school; 3-Complete
high school/incomplete college degree; 4-Complete college degree and more. OR: odds ratio; 95%CI: conidence interval of 95%; NCD: chronic noncommunicable disease.
The results of the logistic regression models are presented in Table 3, showing as variable answer, the bad/very bad self-assessment, showed, irst, that all sociodemographic factors considered in the study possessed signiicant efects (p < 0.01). As for age, a direct association was evidenced, that is, the older the individual, the higher the bad perception percentage of their own health. As for the diferences by gender, women revealed worse SRH than men, and in relation to race/color, the non-Caucasian/white individuals showed a poorer evalu-ation of their health than that by the Caucasian/white people. The efects of the educevalu-ation degree were highly signiicant. The odds ratio (OR) of showing a bad/very bad evaluation of their own health was nine times higher among those who possessed incomplete elementary school degree, when compared with those who completed college degree, and seven times higher in the model adjusted by age, gender, race/color, and the presence of at least one NCD.
The results presented in Table 3 show, additionally, the signiicant efects (p < 0.01) of the presence of NCDs on the bad/very bad SRH. The OR was 5.3 times higher among indi-viduals who were diagnosed with at least one of the NCD, when compared with the others, even after the control of sociodemographic factors.
40
Variables Crude OR (95%CI) Adjusted OR## (95%CI) Adjusted OR### (95%CI)
Gender
Male 1.00 1.00 1.00
Female 1.44 (1.28 – 1.61)* 1.29 (1.14 – 1.46)* 1.23 (1.09 – 1.38)**
Age 1.04 (1.04 – 1.04)* 1.01 (1.01 – 1.02)* 1.01 (1.01 – 1.02)*
Education degree#
1 8.98 (6.78 – 11.88)* 5.16 (3.85 – 6.93)* 5.83 (4.36 – 7.80)*
2 2.50 (1.82 – 3.42)* 2.26 (1.64 – 3.12)* 2.45 (1.78 – 3.36)*
3 1.68 (1.23 – 2.29)** 1.81 (1.32 – 2.47)* 1.86 (1.37 – 2.54)*
4 1.00 1.00 1.00
Color or race
White/caucasian 0.68 (0.60 – 0.76)* 0.71 (0.62 – 0.81)* 0.70 (0.61 – 0.80)*
Nonwhite/caucasian 1.00 1.00 1.00
At least on NCD
Yes 7.56 (6.38 – 8.96)* 5.27 (4.43 – 6.27)* 5.37 (4.51 – 6.40)*
No 1.00 1.00 1.00
Intake of vegetable and fruit
Yes 0.79 (0.70 – 0.88)* 0.86 (0.76 – 0.97)**
–
No 1.00 1.00
Physical activity in leisure
Yes 0.26 (0.21– 0.31)* 0.45 (0.36 – 0.55)*
–
No 1.00 1.00
Smoking
Current 1.98 (1.71 – 2.30)* 1.51 (1.28 – 1.77)*
– Past 2.04 (1.78 – 2.33)* 1.19 (1.03 – 1.37)**
Never 1.00 1.00
Healthy lifestyle
Yes 0.25 (0.18 – 0.35)*
– 0.39 (0.27 – 0.56)*
No 1.00 1.00
Table 4. Efect of the healthy behaviors and the variable “healthy lifestyle” on the very bad/bad self-assessment controlled by gender, age, education degree, and race/color and diagnosis of a
chronic noncommunicable disease. National Health Survey, Brazil, 2013.
*p-value < 1%; **p-value < 5%.
#1-No instruction/incomplete elementary school; 2-Complete elementary school/incomplete high school; 3-Complete
high school/incomplete college degree; 4-Complete college degree and more. ##Considering the three healthy
behaviors.###Considering the variable “healthy lifestyle”.
41
intake of fruits and vegetables with the bad/very bad perception of one’s own health, while the efects of smoking, both for current or past use of tobacco products, were directly asso-ciated with the outcome (p < 0.001), even after the control of sociodemographic factors and the diagnosis of at least one NCD.
DISCUSSION
The results of the World Health Survey (WHS), a populational-based household survey carried out in Brazil in 2003, evidenced a proportion of very good/good self-assessment of 53%, varying from 47% among women and 60% among men28. Ten years later, using exactly
the same question used in the previous research, the PNS showed a much higher proportion of good perception for both genders: 66% for the total sample, 62% among women, and 70% among men. By considering the aging Brazilian population and the expressive growth of NCD, this result is, apparently, paradoxical.
In fact, in this study, 47% of the interviewed people reported the diagnosis of at least one NCD. Among these people, the percentage of very good/good self-assessment was signii-cantly lower (48.4%) in relation to the people who did not report the diagnosis of chronic diseases (81.9%). Thus, a likely explanation for the increase in the proportion of Brazilians who assessed their health as very good or good is in the improvement of the quality of life of the Brazilian population in terms of socioeconomic conditions and health assistance29.
Recent national studies have pointed out the inluence of the improvement of socioeco-nomic conditions and the impact of the reduction of income inequality and the progress made in health attention on the morbidity and mortality indicators30,31.
Such hypothesis is supported by the large association found in the PNS among the socio-demographic characteristics and the SRH. International and national works had already indicated the efects of socioeconomic conditions on the perception of the health status32-35.
In complete education, material diiculties, lower social status, and work situation, in addi-tion to environmental factors, have proven themselves as important determinants in health self-perception, following a negative gradient to the poorest social groups36-39.
Among the socioeconomic indicators, the level of education has been, probably, the most used, being considered more stable than the occupational situation and the outcome, which may vary over time40. However, one of the limitations of this study is that the
house-hold income per capita is still not available for analysis. As pointed out34, the level of income
relects not only the material needs of life, such as the possibility of having good nutrition and adequate housing, but also it is a social welfare marker.
42
The adoption of healthy behaviors has been growing in Brazil. Notable, for example, is the decrease in the use of tobacco products in Brazil46, as a result of public policies against
smoking, such as the prohibition of its publicity and advertizement, the prohibition of smoking in enclosed places, the limited exposure of products in sales outlets, the warning messages in the packages, and the increased taxes47. Individuals who currently use tobacco
products may be evaluating their health poorly not only because of some health problem but also for being informed on the harmful efects of smoking. The PNS showed that 52% of current smokers thought about quitting smoking owing to the warnings in the cigarette packages48 (data not presented in this work).
Eforts are being made, additionally, in order to encourage the practice of physical activ-ities, such as the Health Academy Program (programa Academia da Saúde)49. Although the
beneit of physical activity practice in leisure and the intake of ive portions or more of fruits and vegetables are properly recognized for the prevention of various chronic diseases50, the
adoption of these behaviors by the Brazilian population is, without a doubt, not enough.
CONCLUSION
Although the adoption of healthy lifestyles is still little frequent in the Brazilian popula-tion, the association of healthy behaviors with the perception of health found in this study, even with the control of the efects of socioeconomic factors and with the presence of at least one NCD, is an indication that the Brazilian population is starting to relate healthy lifestyles to their well-being and to a better assessment of their health.
1. Asada Y, Ohkusa Y. Analysis of health-related quality of life (HRQL), its distribution, and its distribution by income in Japan, 1989 and 1998. Soc Sci Med 2004; 59(7): 1423-33.
2. Verbrugge LM, Jette AM. The disablement process. Soc Sci Med 1994; 38(1): 1-14.
3. Luy M, Minagawa Y. Gender gaps-Life expectancy and proportion of life in poor health. Health Rep 2014; 25(12): 12-9.
4. GBD 2013 Mortality and Causes of Death Collaborators. Global, regional, and national age-sex speciic all-cause and cause-speciic mortality for 240 causes of death, 1990-2013: a systematic analysis for the Global Burden of Disease Study 2013. Lancet 2015; 385(9963): 117-71.
5. Campos MR, Doellinger Vdos R, Mendes LV, Costa Mde F, Pimentel TG, Schramm JM. Morbidity and mortality associated with injuries: results of the Global Burden of Disease study in Brazil, 2008. Cad Saúde Pública 2015; 31(1): 121-36.
6. Haro J, Tyrovolas S, Garin N, Diaz-Torne C, Carmona L, Riera L, et al. The burden of disease in Spain: results from the global burden of disease study 2010. BMC Med 2014; 12(1): 236.
7. Verropoulou G. Speciic versus general self-reported health indicators predicting mortality among older adults in Europe: disparities by gender employing SHARE longitudinal data. Int J Public Health 2014; 59(4): 665-78.
8. Devlin N, Hansen P, Herbison P. Variations in self-reported health status: results from a New Zealand survey. NZ Med J 2000; 113(1123): 517-20.
9. Romero DE, Leite Ida C, Szwarcwald CL. Healthy life expectancy in Brazil: applying the Sullivan method. Cad Saúde Pública 2005; 21(Suppl 1): 7-18.
10. Nepomuceno MR, Turra CM. Trends in healthy life expectancy among older Brazilian women between 1998 and 2008. Rev Saúde Pública 2015; 49:1-8.
43 11. Jagger C, Gillies C, Moscone F, Cambois E, Van Oyen
H, Nusselder W, et al. Inequalities in healthy life years in the 25 countries of the European Union in 2005: a cross-national meta-regression analysis. Lancet 2009; 372: 2124-31.
12. Zack MM, Centers for Disease Control and Prevention (CDC). Health-related quality of life - United States, 2006 and 2010. MMWR Surveill Summ 2013; 62(Suppl 3): 105-11.
13. Theme-Filha MM, Szwarcwald CL, Souza Junior PR. Measurements of reported morbidity and interrelationships with health dimensions. Rev Saúde Pública 2008; 42(1): 73-81.
14. Feng Q, Zhu H, Zhen Z, Gu D. Self-Rated Health, Interviewer-Rated Health, and Their Predictive Powers on Mortality in Old Age. J Gerontol B Psychol Sci Soc Sci 2015.
15. Nielsen TH. The Relationship Between Self-Rated Health and Hospital Records. Health Econ 2015.
16. Mossey JM, Shapiro E. Self-rated health: a predictor of mortality among the elderly. Am J Public Health 1982; 72(8): 800-8.
17. Kaplan GA, Camacho T. Perceived health and mortality: a nine-year follow-up of the human population laboratory cohort. Am J Epidemiol 1983; 117(3): 292-304.
18. Idler EL, Benyamini Y. Self-rated health and mortality: a review of twenty-seven community studies. J Health Soc Behav 1997; 38(1): 21-37.
19. Burstrom B, Fredlund P. Self rated health: Is it as good a predictor of subsequent mortality among adults in lower as well as in higher social classes? J Epidemiol Community Health 2001; 55(11): 836-40.
20. Razzaque A, Mustafa AH, Streatield PK. Do self-reported health indicators predict mortality? Evidence from Matlab, Bangladesh. J Biosoc Sci 2014; 46(5): 621-34.
21. Blank N, Diderichsen F. The Prediction of diferent experiences of longterm illness: a longitudinal approach in Sweden. J Epidemiol Community Health 1996; 50(2): 156-61.
22. Mithen J, Aitken Z, Ziersch A, Kavanagh AM. Inequalities in social capital and health between people with and without disabilities. Soc Sci Med 2015; 126: 26-35.
23. Froom P, Melamed S, Triber I, Ratson N, Hermoni D. Predicting self-reported health: the CORDIS study. Prev Med 2004; 39(2): 419-23.
24. Schmidt MI, Duncan BB, Azevedo e Silva G, Menezes AM, Monteiro CA, Barreto SM, et al. Chronic non-communicable diseases in Brazil: burden and current challenges. Lancet 2011; 377(9781): 1949-61.
25. Ramos LR, Malta DC, Gomes GA, Bracco MM, Florindo AA, Mielke GI, et al. Prevalence of health promotion programs in primary health care units in Brazil. Rev Saúde Pública 2014; 48(5): 837-44.
26. Malta DC, Silva MMA, Albuquerque GM, Lima CM, Cavalcante T, Jaime PC, et al. A implementação das prioridades da Política Nacional de Promoção da Saúde, um balanço, 2006-2014. Ciênc Saúde Colet 2014; 19(11): 4301-11.
27. Freitas MPS, Lila MF, Azevedo RV, Antonaci GA. Amostra Mestra para o Sistema Integrado de Pesquisas Domiciliares. Rio de Janeiro: IBGE; 2007. (Texto para discussão, nº 23). Disponível em: http://www.ibge. gov.br/home/estatistica/indicadores/sipd/texto_ discussao_23.pdf (Acessado em 02 de fevereiro de 2015).
28. Szwarcwald CL, Souza-Júnior PR, Esteves MA, Damacena GN, Viacava F. Socio-demographic determinants of self-rated health in Brazil. Cad Saúde Pública 2005; 21(Suppl 1): 54-64.
29. Victora CG, Barreto ML, do Carmo Leal M, Monteiro CA, Schmidt MI, Paim J, et al. Health conditions and health-policy innovations in Brazil: the way forward. Lancet 2011; 377(9782): 2042-53.
30. Soares GP, Brum JD, Oliveira GM, Klein CH, Souza e Silva NA. Evolution of socioeconomic indicators and cardiovascular mortality in three Brazilian states. Arq Bras Cardiol 2013; 100(2): 147-56.
31. Rasella D, Aquino R, Barreto ML. Impact of income inequality on life expectancy in a highly unequal developing country: the case of Brazil. J Epidemiol Community Health 2013; 67(8): 661-6.
32. Lima-Costa MF, Barreto S, Giatti L, Uchoa E. Desigualdade social e saúde entre idosos brasileiros: um estudo baseado na Pesquisa Nacional por Amostra de Domicílios. Cad Saúde Pública 2003; 19: 745-57.
33. Dachs JNW. Determinantes das desigualdades na auto-avaliação do estudo de saúde no Brasil: análise dos dados da PNAD/1998. Ciênc Saúde Colet 2002; 7: 641-57.
34. Martikainen P, Adda J, Ferrie JE, Smith GD, Marmot M. Efects of income and health on GHQ depression and poor self rated health in white collar women and men in the Whitehall II study. Journal of Epidemiology and Community Health 2003; 57: 718-23.
35. Kim J. Socioeconomic inequalities in self-rated health among middle-aged and older adults. Soc Work Health Care 2011; 50(2): 124-42.
36. Franks P, Gold MR, Fiscella K. Sociodemographics, self-rated health, and mortality in the US. Soc Sci Med 2003; 56(12): 2505-14.
44 38. Cummins S, Staford M, Macintyre S, Marmot M,
Ellaway A. Neighbourhood environment and its association with self rated health: evidence from Scotland and England. J Epidemiol Community Health 2005; 59(3): 207-13.
39. Szwarcwald CL, da Mota JC, Damacena GN, Pereira TG. Health inequalities in Rio de Janeiro, Brazil: lower healthy life expectancy in socioeconomically disadvantaged areas. Am J Public Health 2011; 101(3): 517-23.
40. Heistaro S, Vartiainen E, Puska P. Trends in self-rated health in Finland 1972-1992. Prev Med 1996;25(5): 625-32.
41. Borg V, Kristensen TS. Social class and self-rated health: can the gradient be explained by diferences in life style or work environment? Soc Sci Med 2000; 51: 1019-30.
42. Mood C. Life-style and self-rated global health in Sweden: a prospective analysis spanning three decades. Prev Med 2013; 57(6): 802-6.
43. Jankovic N, Geelen A, Streppel MT, de Groot LC, Orfanos P, van den Hooven EH, et al. Adherence to a healthy diet according to the World Health Organization guidelines and all-cause mortality in elderly adults from Europe and the United States. Am J Epidemiol 2014; 180(10): 978-88.
44. Kendig H, Browning CJ, Thomas SA, Wells Y. Health, lifestyle, and gender influences on aging well: an Australian longitudinal analysis to guide health promotion. Front Public Health 2014; 2: 70.
45. Rosenkranz RR, Duncan MJ, Rosenkranz SK, Kolt GS. Active lifestyles related to excellent self-rated
health and quality of life: cross sectional findings from 194,545 participants in The 45 and Up Study. BMC Public Health 2013; 13: 1071.
46. Malta DC, Oliveira TP, Luz M, Stopa SR, Silva Junior JB, Reis AA. Smoking trend indicators in Brazilian capitals, 2006-2013. Ciênc Saúde Colet 2015; 20(3): 631-40.
47. Silva ST, Martins MC, Faria FR, Cotta RM. Combate ao Tabagismo no Brasil: a importância estratégica das ações governamentais. Ciênc Saúde Colet 2014; 19(2): 539-52.
48. Brasil. Ministério do Planejamento, Orçamento e Gestão. Instituto Brasileiro de Geograia e Estatística - IBGE. Diretoria de Pesquisas Coordenação de Trabalho e Rendimento. Pesquisa Nacional de Saúde: Percepção do estado de saúde, estilos de vida e doenças Crônicas. Rio de Janeiro: IBGE; 2014. p. 181.
49. Reis RS, Kelly CM, Parra DC, Barros M, Gomes G, Malta D, et al. Developing a research agenda for promoting physical activity in Brazil through environmental and policy change. Rev Panam Salud Publica 2012; 32(2): 93-100.
50. World Health Organization (WHO). The World Health Report - Reducing Risks, Promoting Healthy Life. Geneva: WHO; 2002.
Received on: 04/23/2015