ABSTRACT: Objective: To describe health care indicators in adults with self‑reported hypertension in Brazil, according to socio‑demographic characteristics. Methods: Data from the National Health Survey 2013, a cross‑sectional population‑based study, about health care of self‑reported hypertension and health services were used. Prevalence and 95% conidence intervals (95%CI) were calculated for sex, age, race/color skin and schooling levels, representing Brazil and major regions. Results: Hypertension was reported by 21.4% (95%CI 20.8 – 22.0) of respondents, being higher in women and in people without instruction and incomplete middle school. Among these, 45.9% (95%CI 44.0 – 47.7) reported having received medical care for the last time in a basic health unit; 81.4% (95%CI 80.1 – 82.7) reported taking medication for high blood pressure; and 92.0% (95%CI 91.2 – 92.8) reported having taken all requested complementary examinations. Conclusion: It is important to know the coverage and access to health services for the care of patients with hypertension, in order to improve care quality and reduce identiied inequalities.
Keywords: Chronic disease. Hypertension. Health surveys. Health Services. Delivery of health care. Epidemiology, descriptive.
Health care in adults with self‑reported
hypertension in Brazil according to
the National Health Survey, 2013
Cuidado em saúde em adultos com hipertensão arterial autorreferida
no Brasil segundo dados da Pesquisa Nacional de Saúde, 2013
Deborah Carvalho MaltaI,II, Sheila Rizzato StopaI,III, Silvânia Suely Caribé de Araújo AndradeI,III, Celia Landmann SzwarcwaldIV, Jarbas Barbosa Silva JúniorV, Ademar Arthur Chioro dos ReisVI
IDepartment of Monitoring of Non‑Communicable Diseases, Health Surveillance Bureau, Ministry of Health – Brasília (DF), Brazil. IIUniversidade Federal de Minas Gerais – Belo Horizonte (MG), Brazil.
IIIDepartment of Epidemiology, School of Public Health, Universidade de São Paulo – São Paulo (SP), Brazil.
IVInstitute of Communication and Scientiic and Technological Information in Health, Oswaldo Cruz Foundation – Rio de Janeiro (RJ), Brazil.
VMinistry of Health – Brasília (DF), Brazil.
VIUniversidadade Federal de São Paulo – São Paulo (SP), Brasil.
Corresponding author: Deborah Carvalho Malta. Departamento de Vigilância de Doenças e Agravos Não Transmissíveis e Promoção da Saúde. SAF Sul, Trecho 02, Lotes 05/06, Bloco F, Torre 1, Edifício Premium, térreo, sala 16, CEP: 70070‑600, Brasília, DF, Brasil. E‑mail: [email protected]
INTRODUCTION
In Brazil the circulatory system diseases (CSD) correspond to the main cause of death, despite having a tendency to reduction1. Studies show that 7.6 million deaths worldwide were attributed to
high blood pressure (BP), being 54% of them by stroke and 47% by ischemic heart disease (IHD)2,3.
The arterial hypertension (AH) has high prevalence, being considered one of the main changeable risk factors (RF) for CSD and one of the most important public health prob‑ lems4. Clinical studies show that the detection, treatment and control of AH are essential
for the reduction of cardiovascular events4. Therefore, to early diagnose and to maintain
adherence to the treatment are cost‑efective measures in public health.
The changes in lifestyle are recommended in the primary prevention of AH, especially in adults with borderline BP (130 to 139/85 to 89 mmHg). Changes in lifestyle may control the AH, as well as the cardiovascular mortality4‑7. Healthy lifestyles should be adopted since the
childhood and adolescence, with the main non‑pharmacological recommendations: a healthy diet, practicing physical activities, reducing the intake of sodium and alcohol, not consuming tobacco4,6,8,9. Some authors argue that the BP ≥ 140/90 mmHg alone does not necessarily char‑
acterize this population as a priority target for pharmacological treatments, considering people at cardiovascular risk should be prioritized for tretament6,10. While other authors point out
the eicacy and safety of medication in patients with slightly high blood pressure (pre‑hyper‑ tension) in the prevention of cerebrovascular diseases, and show that drugs are well indicated and prevent the development of severe outcomes in populations with pre‑hypertension, which indicated the need to advance in the evidences about the implementation of the treatment11.
In order to provide appropriate care to hypertensive patients, the health care services, specially the primary care, should establish diferent strategies. Within the factors of service
RESUMO: Objetivo: Descrever indicadores de cuidado em saúde em adultos com hipertensão arterial autorreferida no Brasil, segundo características sociodemográicas. Métodos: Foram utilizados dados da Pesquisa Nacional de Saúde 2013, estudo transversal de base populacional, referentes ao cuidado em saúde com a hipertensão arterial autorreferida quanto ao uso de serviços de saúde. As prevalências e seus intervalos de coniança de 95% (IC95%) foram calculados segundo sexo, idade, raça/cor e escolaridade, representativos para Brasil e grandes regiões. Resultados: A hipertensão arterial foi referida por 21,4% (IC95% 20,8 – 22,0) dos entrevistados, sendo maior em mulheres e em pessoas sem instrução e com ensino fundamental incompleto. Dentre estes, 45,9% (IC95% 44,0 – 47,7) referiram ter recebido assistência médica pela última vez em uma Unidade Básica de Saúde; 81,4% (IC95% 80,1 – 82,7) referiram tomar medicamentos para a hipertensão; e 92,0% (IC95% 91,2 – 92,8) referiram ter realizado todos os exames complementares que foram solicitados. Conclusão: É importante conhecer a cobertura e o acesso aos serviços de saúde para o cuidado aos indivíduos com hipertensão arterial, de modo a avançar na qualidade da assistência prestada e reduzir as desigualdades identiicadas.
organization, the access to the entrance door and in patient’s referral should be ensured, as well as performing a full comprehensive, continued and responsible approach, establishing appropriate lines of care to each user. The protocols used in primary care should ensure the linkage of professionals and services, the knowledge of the patients on the disease, its risk factors and the measures implemented, for the adhesion to the chosen therapy, including the adoption of healthy life styles, family and community support, in short, empowering users12‑14.
For the monitoring of the AH and other non‑communicable chronic disease, the moni‑ toring of indicators on the low of users, access and efectiveness of the care spent13 is very
important in order to support decision making and to deine priorities. Besides knowing the quality of the care given to users, in order to obtain better results, such as the AH control, the reduction of morbidities and more severe outcomes3,4.
The household surveys using questions on self‑reported hypertension with previous medical diagnosis have been widely used as a reference for the planning of public health15‑18.
In 2013, The National Health Survey (NHS) approached the theme of self‑reported and mea‑ sured HA. The analysis of these informations are a great advance for the country and this is the irst study to analyze these national results about the health assistance given out to hypertensive patients. In the future, physical measures also measured by the NHS will be available and allow even more accurate analysis19.
The objective of this study was to describe indicators of health care among adults with self‑reported AH in Brazil, according to sociodemographic characteristics.
METHODS
It is a descriptive study, with data from the NHS 2013. The NHS is a populational based survey, whose sampling process was clustered in three stages: census sectors or set of sectors (primary units), households (secondary units) and adult residents (≥ 18 years of age) (tertiary units). The randomly chosen sample consisted of 81,357 households, 69,994 occupied ones and therefore eligible for the research. With a no‑response rate of 8.1%, information were collected in 64,348 households20, where an adult resident (≥ 18 years of age) was selected to
answer to the questionnaire. The NHS was the result of the partnership between the Brazilian Institute of Geography and Statistics (Instituto Brasileiro de Geograia e Estatística – IBGE) and the Ministry of Health; further details on the methodology may be found in speciic publications19,20.
The following indicators regarding the health care of adults with self‑reported AH were analyzed in the current study as well as the access to the services, among others, the propor‑ tion (%) of adults who have never gotten their blood pressure measured; and the proportion (%) of self‑reported hypertensive adults. Such information was built based on the previous medical diagnosis of arterial hypertension. The following indicators were investigated.
hypertensive adults who had their last medical appointment in a Basic Health Unit (Básica de Saúde – UBS); proportion (%) of self‑reported hypertensive adults and the doctors from their last appointment were the same from the previous ones; proportion (%) of self‑reported hyperten‑ sive adults, to which additional tests were requested and who were able to do all the required examinations; proportion (%) of self‑reported hypertensive adults, who were referred to a medi‑ cal appointment with a specialist and got all appointments with the specialist; proportion (%) of self‑reported hypertensive adults who hospitalized themselves because of hypertension or any other complication; proportion (%) of self‑reported hypertensive adults who have a severe or very severe degree in daily activities due to hypertension or any other complications.
The calculation of the prevalences and their respective conidence intervals of 95% (95%CI) was made according to: gender (male and female); age (18 to 29 years of age; 30 to 59 years of age; 60 to 64 years of age; 65 to 74 years of age; 75 years of age or more); race/color (White/ Caucasian, black, brown), the remaining race/color categories were added in total, not being individualized due to a small number of observations; and school education (with no instruc‑ tion and incomplete elementary school; complete elementary school and incomplete high school; complete high school and incomplete college degree; complete college degree), being representative for Brazil and ive great regions. The comparison of the prevalences and their 95%CI was performed, and the diference was considered signiicant when there was no over‑ lap of conidence intervals. The data were analyzed in the Stata version 11.0 software, through the survey module, which considers efects on the complex sampling.
The NHS was approved in the Research Ethics Committee, under the number 328.159, in June 26th 2013. All individuals were consulted, informed and agreed to take part in the
research through the Informed Consent.
RESULTS
Among the respondents, 3.0% of them reported not having measured the BP, meaning, 4.3 million adults. Men had the highest proportion (4.3%) among the individuals who have never had their pressure measured. The AH diagnosis was reported by 21.4% of the adults (31.3 million) and the proportion was higher among women 24.2% (Table 1).
Among the adults who reported hypertension, 81.4% of them mentioned taking medication and 69.7% of the adults with self‑reported AH received medical assistance within the last 12 months, and 45.9% (12.8 million) had their last appointment in a UBS. It was also investigated whether the doctor in this appointment was the same one from the previous consultations and 56.4% of the respondents stated yes; 92.0% claimed having been able to perform ass the examinations required. Regarding being referred to an specialist, 87.1% of the reported being able to take all the appoint‑ ments with specialist. From the total adults with self‑reported AH, 14.0% (4.3 million) mentioned hospitalization due to hypertension or to complications due to the disease. They reported severe/ very severe limitation degree 4.7% (1.4 million) of adults with self‑reported AH (Table 1).
Indicators Expanded number 1000 inhabitants
Total
Gender
Male Female
% 95%CI % 95%CI % 95%CI
Never measured their blood pressure 4,325 3.0 2.7 – 3.2 4.3 3.9 – 4.8 1.7 1.5 – 2.0
Self-reported hypertension 31,315 21.4 20.8 – 22.0 18.3 17.5 – 19.1 24.2 23.4 – 24.9
Mong teh self-reported hypertensive people, the percentage of those who:
...took medication wihtin the last two weeks 25,489 81.4 80.1 – 82.7 76.1 74.5 – 78.8 84.6 83.2 – 86.0
...received medical assistance for hypertension within the last 12
months 21,823 69.7 68.2 – 71.2 65.6 63.2 – 68.1 72.4 70.6 – 74.2
...had their last medical appointment in a Primary Care unit
(Unidade Básica de Saúde) 12,778 45.9 44.0 – 47.7 40.7 37.9 – 43.6 49.2 47.1 – 51.4
...the doctor in the last appointment was the same from the
previous appointments 15,694 56.4 54.7 – 58.1 54.8 52.0 – 57.5 57.4 55.4 – 59.4
...had complementary exams required and were able to tak all of them 21,822 92.0 91.2 – 92.8 92.3 91.0 – 93.6 91.8 90.8 – 92.9
... were referred to a medical appointment with a specialist doctor,
and were able to tak all apointments with the specialist 5,981 87.1 84.9 – 89.4 86.5 82.8 – 90.1 87.6 84.9 – 90.3
...were hospitalized due to hypertension or some complication 4,394 14.0 12.9 – 15.1 12.5 10.8 – 14.3 15.0 13.6 – 16.5
...have severe/very severe degree of limitations, daily activities due
or complications 1,474 4.7 4.0 – 5.4 4.1 3.0 – 5.2 5.1 4.2 – 6.0
95%CI: conidence interval of 95%.
Source: National Health Survey (IBGE, 2013).
was higher among women (72.4%). Also, the proportion of individuals who had their last appointment in the UBS was also higher among women (49.2%). The remaining indicators presented similar proportions among genders (Table 1).
Among the respondents who claimed never having measured the BP, the greater propor‑ tion was in the North region (7.0%) and the smaller one in Southeast (1.9%). The diagnosis of hypertension was reported by 21.4% of adults, most of them in the Southeast (23.3%) and South (22.9%) (Table 2). As for being taken care of by the same doctor in the previous appointments, the greater proportion was in the Southeast (61.3%) and the smallest one in the North (44.3%). Regarding the complementary tests required, 92.0% of patients reported having been able to perform all of the requested tests, with higher proportion in the South region (94.1%). The Northeast region had higher proportion of hospitalization, with 16.0%. Severe/very severe degree of limitation was reported by 4.7% of the adults with self‑re‑ ported hypertension, most of it in the Northeast region, with 5.4% (Table 2).
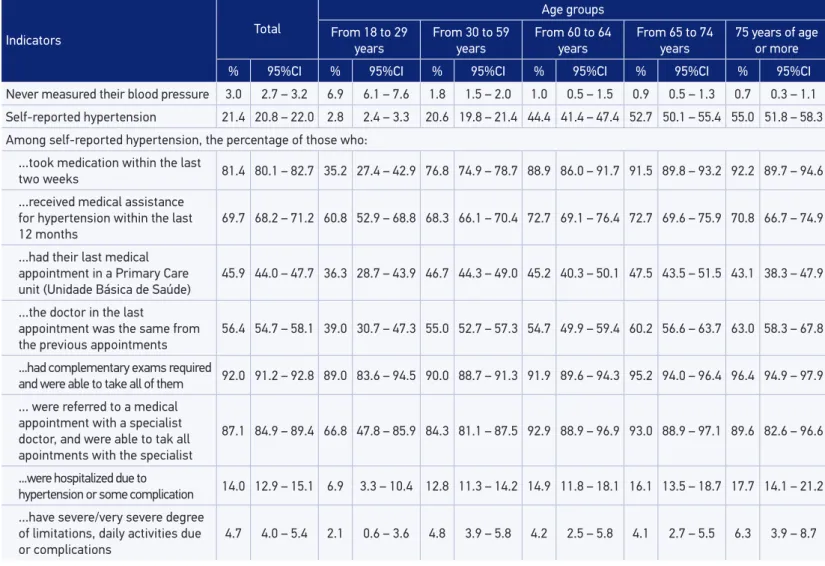
The proportion of individuals who have never measured their BP was higher among the ones from 18 to 29 years of age (6.9%). On the other hand, for the adults who reported having been diagnosed with hypertension, the highest proportion was among the ones with 75 years of age or more (55.0%), as well as the proportion of those who reported taking medication for hypertension (92.2%). Among the adults with self‑reported hypertension who mentioned hospitalization due to the disease or some complication, the proportion was higher in the age range from 75 years of age or more (17.7%). The proportion of adults with self‑reported hypertension who mentioned a severe/very severe degree of limitation was lower among individuals from 18 to 29 years of age. The remaining indicators showed similar proportions among the age ranges studies (Table 3).
Individuals with complete elementary school to incomplete high school had the highest pro‑ portion among the ones who reported having never measured their BP (4.8%). The proportion of medical diagnosis for hypertension was higher among the individuals without education (31.1%). Individuals with complete high school and incomplete college degree had less medication The proportion of adults with self‑reported hypertension who had their last medical appointment in a UBS was higher among individuals without education (56.1%), while for complete college degree ones the proportion was 17.9%. As for the individuals who reported, in their last appointment, having been taken care of by the same doctors from the previous appointments, the highest pro‑ portion (69.2%) was found among individuals with complete college degree. The proportion of adults with self‑reported hypertension who indicated severe/very severe limitation degree was 4.7% and it was lower among the individuals with complete college degree (0.7%). The other indicators had similar proportions among the school education ranges studied (Table 4).
Indicators Brazil North Northeast Southeast South Middle-West
% 95%CI % 95%CI % 95%CI % 95%CI % 95%CI % 95%CI
Never measured their blood pressure 3.0 2.7 – 3.2 7.0 5.9 – 8.2 4.2 3.7 – 4.7 1.9 1.5 – 2.2 2.2 1.6 – 2.8 2.3 1.8 – 2.9
Self-reported hypertension 21.4 20.8 – 22.0 14.5 13.6 – 15.5 19.4 18.5 – 20.4 23.3 22.3 – 24.3 22.9 21.5 – 24.3 21.2 20.0 – 22.4
Among self-reported hypertension, the percentage of those who:
...took medication within the last
two weeks 81.4 80.1 – 82.7 71.4 67.6 – 75.1 78.5 76.0 – 80.9 83.4 81.4 – 85.4 83.6 80.8 – 86.4 80.3 77.5 – 83.0
...received medical assistance for
hypertension within the last 12 months 69.7 68.2 – 71.2 72.6 69.2 – 76.0 67.8 64.9 – 70.6 71.7 69.1 – 74.2 68.0 64.8 – 71.3 64.8 61.2 – 68.3
...had their last medical
appointment in a Primary Care unit (Unidade Básica de Saúde)
45.9 44.0 – 47.7 49.0 44.4 – 53.7 45.3 42.3 – 48.3 44.9 41.7 – 48.1 48.4 44.3 – 52.6 46.9 43.4 – 50.3
...the doctor in the last appointment
was the same from the previous
appointments
56.4 54.7 – 58.1 44.3 39.9 – 48.8 46.8 44.0 – 49.7 61.3 58.5 – 64.2 59.7 55.8 – 63.6 55.8 52.5 – 59.1
...had complementary exams required and were able to
take all of them
92.0 91.2 – 92.8 89.0 86.1 – 91.9 87.1 85.3 – 88.9 93.7 92.5 – 95.0 94.1 92.4 – 95.9 92.5 90.6 – 94.4
... were referred to a medical
appointment with a specialist doctor, and were able to tak all apointments with the specialist
87.1 84.9 – 89.4 88.2 84.0 – 92.3 81.4 75.9 – 86.8 87.9 84.4 – 91.3 92.1 88.0 – 96.2 87.2 81.9 – 92.4
...were hospitalized due to
hypertension or some complication 14.0 12.9 – 15.1 14.6 12.0 – 17.3 16.0 13.8 – 18.2 13.0 11.2 – 14.7 14.3 11.8 – 16.8 13.5 11.4 – 15.5
...have severe/very severe degree
of limitations, daily activities due or
complications
4.7 4.0 – 5.4 4.8 2.8 – 6.8 5.4 4.1 – 6.6 4.3 3.2 – 5.4 5.0 3.5 – 6.4 4.5 3.1 – 5.9
Table 2. Health care indicators in adults with hypertension, according Brazil and major regions, National Health Survey, Brazil, 2013.
95%CI: conidence interval of 95%.
Indicators Total
Age groups
From 18 to 29 years
From 30 to 59 years
From 60 to 64 years
From 65 to 74 years
75 years of age or more
% 95%CI % 95%CI % 95%CI % 95%CI % 95%CI % 95%CI
Never measured their blood pressure 3.0 2.7 – 3.2 6.9 6.1 – 7.6 1.8 1.5 – 2.0 1.0 0.5 – 1.5 0.9 0.5 – 1.3 0.7 0.3 – 1.1
Self-reported hypertension 21.4 20.8 – 22.0 2.8 2.4 – 3.3 20.6 19.8 – 21.4 44.4 41.4 – 47.4 52.7 50.1 – 55.4 55.0 51.8 – 58.3
Among self-reported hypertension, the percentage of those who:
...took medication within the last
two weeks 81.4 80.1 – 82.7 35.2 27.4 – 42.9 76.8 74.9 – 78.7 88.9 86.0 – 91.7 91.5 89.8 – 93.2 92.2 89.7 – 94.6
...received medical assistance
for hypertension within the last
12 months
69.7 68.2 – 71.2 60.8 52.9 – 68.8 68.3 66.1 – 70.4 72.7 69.1 – 76.4 72.7 69.6 – 75.9 70.8 66.7 – 74.9
...had their last medical appointment in a Primary Care unit (Unidade Básica de Saúde)
45.9 44.0 – 47.7 36.3 28.7 – 43.9 46.7 44.3 – 49.0 45.2 40.3 – 50.1 47.5 43.5 – 51.5 43.1 38.3 – 47.9
...the doctor in the last
appointment was the same from
the previous appointments
56.4 54.7 – 58.1 39.0 30.7 – 47.3 55.0 52.7 – 57.3 54.7 49.9 – 59.4 60.2 56.6 – 63.7 63.0 58.3 – 67.8
...had complementary exams required
and were able to take all of them 92.0 91.2 – 92.8 89.0 83.6 – 94.5 90.0 88.7 – 91.3 91.9 89.6 – 94.3 95.2 94.0 – 96.4 96.4 94.9 – 97.9 ... were referred to a medical
appointment with a specialist doctor, and were able to tak all apointments with the specialist
87.1 84.9 – 89.4 66.8 47.8 – 85.9 84.3 81.1 – 87.5 92.9 88.9 – 96.9 93.0 88.9 – 97.1 89.6 82.6 – 96.6
...were hospitalized due to
hypertension or some complication 14.0 12.9 – 15.1 6.9 3.3 – 10.4 12.8 11.3 – 14.2 14.9 11.8 – 18.1 16.1 13.5 – 18.7 17.7 14.1 – 21.2
...have severe/very severe degree
of limitations, daily activities due
or complications
4.7 4.0 – 5.4 2.1 0.6 – 3.6 4.8 3.9 – 5.8 4.2 2.5 – 5.8 4.1 2.7 – 5.5 6.3 3.9 – 8.7
95%CI: conidence interval of 95%.
Source: National Health Survey (IBGE, 2013).
Indicators Total
Education level
Without education and incomplete
elementary school
Complete elementary School
and incomplete High School
Complete High School and incomplete College degree
Complete College degree
% 95%CI % 95%CI % 95%CI % 95%CI % 95%CI
Never measured their blood pressure 3.0 2.7 – 3.2 3.4 3.0 – 3.8 4.8 4.0 – 5.5 2.5 2.1 – 2.8 0.7 0.4 – 1.0
Self-reported hypertension 21.4 20.8 – 22.0 31.1 30.1 – 32.2 16.7 15.3 – 18.0 13.4 12.5 – 14.2 18.2 16.5 – 19.8
Among self-reported hypertension, the percentage of those who:
...took medication within the last two weeks 81.4 80.1 – 82.7 83.9 82.3 – 85.5 79.6 76.3 – 83.0 75.4 72.4 – 78.4 81.6 77.7 – 85.5
...received medical assistance for hypertension
within the last 12 months 69.7 68.2 – 71.2 72.1 70.1 – 74.1 67.5 63.0 – 72.0 66.6 63.3 – 70.0 65.4 60.1 – 70.6
...had their last medical appointment in a Primary
Care unit (Unidade Básica de Saúde) 45.9 44.0 – 47.7 56.1 53.8 – 58.4 42.9 38.3 – 47.4 33.5 30.1 – 36.9 17.9 13.2 – 22.7
...the doctor in the last appointment was the same
from the previous appointments 56.4 54.7 – 58.1 55.0 52.7 – 57.2 54.1 49.8 – 58.3 55.0 51.3 – 58.7 69.2 63.7 – 74.7
...had complementary exams required and were able
to take all of them 92.0 91.2 – 92.8 91.9 90.8 – 92.9 89.7 86.8 – 92.7 92.6 90.8 – 94.4 94.1 91.8 – 96.4
... were referred to a medical appointment with a
specialist doctor, and were able to tak all apointments with the specialist
87.1 84.9 – 89.4 86.9 83.9 – 89.9 85.2 79.1 – 91.4 86.6 81.7 – 91.5 92.7 87.3 – 98.0
...were hospitalized due to hypertension or some
complication 14.0 12.9 – 15.1 15.8 14.3 – 17.3 13.1 10.1 – 16.1 12.0 9.5 – 14.4 9.6 6.6 – 12.6
...have severe/very severe degree of limitations, daily
activities due or complications 4.7 4.0 – 5.4 6.1 5.1 – 7.0 4.5 2.5 – 6.5 3.2 2.0 – 4.5 0.7 0.2 – 1.1
Table 4. Health care indicators in adults with hypertension by school education. National Health Survey, Brazil, 2013.
95%CI: conidence interval of 95%.
Indicators
Total
Color or race
White/Caucasian Black Brown
% 95%CI % 95%CI % 95%CI % 95%CI
Never measured their blood pressure 3.0 2.7 – 3.2 1.8 1.6 – 2.1 3.5 2.7 – 4.4 4.1 3.7 – 4.5
Self-reported hypertension 21.4 20.8 – 22.0 22.1 21.3 – 23.0 24.2 22.2 – 26.3 20.0 19.2 – 20.8
Among self-reported hypertension, the percentage of those who:
...took medication within the last two weeks 81.4 80.1 – 82.7 84.5 82.9 – 86.0 79.6 75.6 – 83.7 78.2 76.1 – 80.3
...received medical assistance for hypertension within the
last 12 months 69.7 68.2 – 71.2 70.1 67.9 – 72.3 70.7 65.6 – 75.9 69.1 66.9 – 71.4
...had their last medical appointment in a Primary Care unit
(Unidade Básica de Saúde) 45.9 44.0 – 47.7 41.3 38.6 – 44.0 50.1 45.2 – 55.1 50.8 48.2 – 53.3
...the doctor in the last appointment was the same from the
previous appointments 56.4 54.7 – 58.1 62.1 59.7 – 64.5 51.2 45.9 – 56.5 50.4 47.9 – 52.9
...had complementary exams required and were able to take
all of them 92.0 91.2 – 92.8 94.1 93.0 – 95.1 86.3 82.8 – 89.8 90.8 89.5 – 92.1
... were referred to a medical appointment with a specialist
doctor, and were able to tak all apointments with the specialist 87.1 84.9 – 89.4 90.7 88.0 – 93.4 80.4 71.2 – 89.5 84.4 80.7 – 88.1
...were hospitalized due to hypertension or some
complication 14.0 12.9 – 15.1 13.2 11.7 – 14.8 15.7 12.3 – 19.2 14.6 12.9 – 16.3
...have severe/very severe degree of limitations, daily
activities due or complications 4.7 4.0 – 5.4 4.5 3.5 – 5.5 4.2 2.3 – 6.1 5.2 4.1 – 6.2
Table 5. Health care indicators in adults with hypertension by race/color. National Health Survey, Brazil , 2013.
95%CI: conidence interval of 95%.
DISCUSSION
The main results show that nearly the whole adult population have already had their BP measured at any time in their lives and that hypertension has afected over a ifth of the adult Brazilian population (about 31.3 million adults). Over four‑ifths of adults with self‑reported hypertension took medication within the last 2 weeks and almost 70% of those with self‑re‑ ported hypertension received medical assistance for this health condition within the last 12 months. Approximately half the adults with self‑reported hypertension was assisted by a UBS; the doctor who assisted the last medical appointment was the same form the previous appoint‑ ments in more than half the cases; complementary tests were requested and almost all adults with self‑reported hypertension were able to take all the tests; they were also referred to an appointment with a specialist doctor and almost the universe of individuals with self‑reported hypertension managed to have all the appointments with a medical specialist. About 14% of them were hospitalized due to hypertension or come sort of complications at some point in their lives and 4.7% reported having limitations, due to hypertension.
In general, women were more often diagnosed and received more medical assistance, medication and medical appointments, as well as the population with higher school educa‑ tion, living in the South and Southeast regions and the Caucasian/White people. According to the data from the NHS, small parts of the adult Brazilian population have never had their BP measured, especially men. The percentage of individuals who received medical assis‑ tance within the last year was high, and the regular attendance of hypertensive people to medical appointments is essential for the adherence to the treatment and the continuity of the care21. The NHS conirmed that women have greater opportunity of being diagnosed,
received more medical assistance for hypertension within the last 12 months, had medical appointments in UBS more often and took more medications. Which is consistent with the indings of other studies, pointing out that women seek more often for assistance, which leads to greater opportunities for diagnosis and treatment16.
The Ministry of Health has been performing the expansion of the population’s access to primary health care, especially the expansion of the Family Health program (Programa Saúde da Família), together with states and municipalities22. In addition to that, the protocols of the
Primary Care Guidelines (Cadernos de Atenção Básica) have oriented the Family Health teams in the care of hypertension, diabetes mellitus and other prevalent diseases22,23. The expansion of
service care ofers and the greater access to the assistance network may explain the increased percentage of access to services and diagnostics. The search for care is still uneven between men and women16,21. Women have greater opportunity of diagnosis since they more often
seek for health care16. Besides that, most hypertension cases did not display symptoms for this
condition24, a fact which may also contribute for not searching for the diagnosis.
as bad/very bad and more than one medical appointment within the last 12 months16 were
associated to the knowledge of the condition of hypertensive people.
When pointing out that more than half of the doctors were the same from the previous appointments, the respondents conirmed the importance of continued care, indicating that the best results come from the relation between user and their caregiver13. It is noteworthy
that the data in the NHS suggest that one of the aspects for the solution of health care ser‑ vices26 was contemplated, once that there were increased frequencies of those who could
take the requested exams and were assisted by the specialist.
The prevalences of hypertension, the hospitalization and limitations due to this condition were lower in the population with higher school education, as well as the hospitalization in life were also lower. The percentage of hypertensive people using medication for hypertension was increased, and there no diferences according to education, showing the importance of the SUS in the pro‑ motion of health equity22. The frequency of follow‑up by the same doctor/caregiver was higher
among individuals with higher education. The prevalence of hypertension and their complica‑ tions and limitations is unevenly distributed between the levels of school education, afecting more often individuals with less years of education27. The Northeast region, which has the low‑
est education rates28, was also the one presenting higher percentage of adults with self‑reported
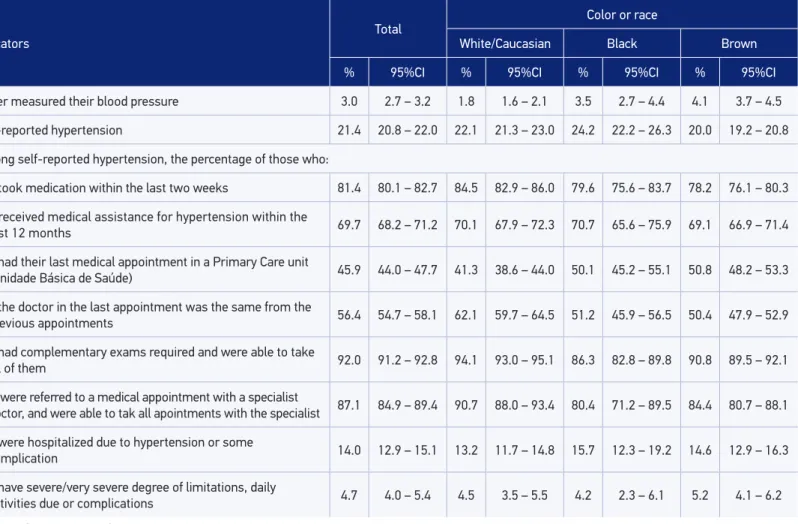
hypertension, hospitalization and severe or very severe degree of limitations on daily activities. As for the race/color, Brown people less often reported hypertension, and there was no diference between Black and Caucasian/White people. The NHS indicated inequali‑ ties, lower frequency of medication use, less access to appointments with specialists, lower frequency of treatment continuity with the same doctor and lower frequency of medical exams in the Black population. However, the UBS access was higher by the Black the access of the Black population to the services.
Therefore, both the lowest school education and the race/color Black are iniquity fac‑ tors in the access to care practices of hypertensive people29, demanding more and more
airmative public policies in ighting inequalities27‑30.
The Surveillance system for risk and protective factors for chronic diseases by telephone survey (Sistema de Vigilância de Fatores de Risco e Proteção para Doenças Crônicas por Inquérito Telefônico – Vigitel), carried out with adults in capitals and in the Federal District, showed a prevalence of hypertension of 24.1% (95%CI 23.4 – 24.8) in 2013, slightly above the NHS. Still according to the Vigitel, the highest prevalences of hypertension were observed among women, elderly and adults with lower education, similarly to what was described by the NHS. It is noteworthy that the NHS has nationwide coverage. The morbidity and mortal‑ ity by non‑communicable chronic diseases in general and speciically by hypertension, and also the exposure to their risk factors, tend to focus on individuals with low income; also, the most unfavorable outcomes with the worst socioeconomic conditions9.
the care of people with non‑communicable Chronic diseases (NCD)13,22. The attention given
to individuals with NCD should be carried out in full, with the integration and articulation of actions of protection, promotion, surveillance, prevention and assistance in all levels of the system, directed to the speciicities of groups or individual needs13.
As limitations of this study, we may list the non‑evaluation of the quality of health assis‑ tance, a fact which implies the access and use of health services; not having been explored, at this moment, the possible diferences between users of the SUS and users of private health insurance31. Also, it is a self‑reported diagnosis, subject to information bias.
CONCLUSION
The NHS is the irst national inquiry approaching in details the prevalence of hyperten‑ sion and the attention received by adults with self‑reported hypertension, making it possible to have data on the access to health care services, analyzing the care given, the use of medica‑ tion, exams, among others. Positive aspects were observed when identifying increased coverage mentioned by the adults with self‑reported hypertension as for the use of medication, exams, medical appointments with specialists, among others. It is extremely important this knowl‑ edge in order to advance in the quality of assistance given to people with hypertension in the country and establishing policies in order to reduce the inequalities according to race/color and school education identiied here.
The reduction of the NCD and the hypertension constitute a global goal, and knowing their distribution is essential for the planning of health actions and guidance of public poli‑ cies of health promotion in populational coverage level, such as the reduction of salt in food, practicing physical activities, prevention of tobacco and also assistential care, use of medica‑ tion, guidance, access to specialist, support in the diagnosis and others, when necessary6,32.
1. Schmidt MI, Duncan BB, Silva GA, Menezes AM, Monteiro CA, Barreto SM, et al. Doenças crônicas não transmissíveis no Brasil: carga e desaios atuais. Lancet 2011; 61‑74.
2. Williams B. The year in hypertension. J Am Coll Cardiol2009; 55(1): 65‑73.
3. Ribeiro AB. Atualização em hipertensão arterial: clínica, diagnóstico e terapêutica. São Paulo: Atheneu; 2007.
4. Sociedade Brasileira De Cardiologia. VI Diretrizes Brasileiras de Hipertensão. Rev Bras Hipertens 2010; 17(1): 7‑10.
5. Lewington S, Clarke R, Qizilbash N, Peto R, Collins R; Prospective Studies Collaboration. Age‑speciic relevance of usual blood pressure to vascular mortality: a meta‑analysis of individual data for one million adults
in 61 prospective studies. Lancet 2002; 360(9349): 1903‑13.
6. Beaglehole R, Bonita R, Horton R, Ezzati M, Bhala N, Amuyunzu‑Nyamongo M, et al. Measuring progress on NCDs: one goal and five targets. Lancet 2012; 380(9850): 1283‑5.
7. Rainforth MV, Schneider RH, Nidich SI, Gaylord‑King C, Salerno JW, Anderson JW. Stress reduction programs in patients with elevated blood pressure: a systematic review and meta‑analysis. Curr Hypertens Rep 2007; 9(6): 520‑8.
8. Brasil. Ministério da Saúde. Plano de ações estratégicas para o enfrentamento das doenças crônicas não transmissíveis (DCNT) no Brasil, 2011–2022. Brasília: MS; 2011.
9. World Health Organization (WHO). Global status report on noncommunicable diseases 2010. Geneva: WHO; 2011.
10. Williams SA, Michelson EL, Cain VA, Yang M, Nesbitt SD, Egan BM, et al. An evaluation of the efects of an angiotensin receptor blocker on health‑related quality of life in patients with high‑normal blood pressure (prehypertension) in the Trial of Preventing Hypertension (TROPHY). J Clin Hypertens 2008; 10(6): 436‑42.
11. Lüders S, Schrader J, Berger J, Unger T, Zidek W, Böhm M, et al. The PHARAO study: prevention of hypertension with the angiotensin‑converting enzyme inhibitor ramipril in patients with high‑normal blood pressure: a prospective, randomized, controlled prevention trial of the German Hypertension League. J Hypertens 2008; 26(7): 1487‑96.
12. Paulucci TD, Velasquez‑Mendelez G, Bernal RIT, Lana FF, Malta DC. Análise do cuidado dispensado a portadores de hipertensão arterial em Belo Horizonte, segundo inquérito telefônico. Rev Bras Epidemiol 2014; (Suppl): 227‑40.
13. Malta DC, Merhy EE. O percurso da linha do cuidado sob a perspectiva das doenças crônicas não transmissíveis. Interface 2010; 14(34): 593‑605.
14. Brasil. Ministério da Saúde. Cadernos de Atenção Básica. Estratégias para o Cuidado da Pessoa com Doença Crônica. Hipertensão Arterial. Brasília: MS; 2013.
15. Barros MBA, Cesar CLG, Carandina L, Goldbaum M. As dimensões da saúde: inquérito populacional em Campinas. São Paulo: Hucitec; 2008.
16. Lima‑Costa MF, Peixoto SV, Firmo JOA. Validade da hipertensão arterial auto‑referida e seus determinantes. Rev Saúde Pública 2004; 38(5): 637‑42.
17. Schmidt MI, Duncan BB, Hoffmann JF, Moura L, Malta DC, Carvalho RM, et al. Prevalência de diabetes e hipertensão no Brasil baseada em inquérito de morbidade auto‑referida, Brasil, 2006. Rev Saúde Pública 2009; 43(Suppl 2): 74‑82.
18. Andrade SSCA, Malta, DC, Iser BM, Sampaio PC, Moura L. Prevalência da hipertensão arterial autorreferida nas capitais brasileiras em 2011 e análise de sua tendência no período de 2006 a 2011.Rev Bras Epidemiol 2014; 17(Suppl 1): 215‑26.
19. Szwarcwald CL, Malta DC, Pereira CA, Vieira MLFP, Conde WL, Souza Júnior PRB, et al. Pesquisa Nacional de Saúde no Brasil: concepção e metodologia de aplicação. Ciênc Saúde Coletiva 2014; 19(2): 333‑42.
20. Instituto Brasileiro de Geograia e Estatística (IBGE). Pesquisa Nacional de Saúde 2013: percepção do estado de saúde, estilos de vida e doenças crônicas. Rio de Janeiro: IBGE; 2014.
21. Pinheiro RS, Viacava F, Travassos C, Brito AS. Gênero, morbidade, acesso, utilização de serviços de saúde no Brasil. Ciênc Saúde Coletiva 2002; 7(4): 687‑707.
22. Magalhães Junior HM, Aurélio Pinto H. Atenção básica enquanto coordenadora da rede e coordenadora do cuidado: ainda uma utopia? Saúde em Debate 2014; 51; 14‑29.
23. Brasil. Ministério da Saúde. Secretaria de Atenção à Saúde. Departamento de Atenção Básica. Diretrizes para o cuidado das pessoas com doenças crônicas nas redes de atenção à saúde e nas linhas de cuidado prioritárias. Brasília: MS; 2013.
24. World Health Organization (WHO). A global brief on hypertension. Geneva: WHO; 2013.
25. Passos VMA, Assis TD, Barreto SM. Hipertensão arterial no Brasil: estimativa de prevalência a partir de estudos de base populacional. Epidemiol Serv Saúde 2006; 15(1): 35‑45.
26. Turrini RNT, Lebrão ML, Cesar CLG. Resolutividade dos serviços de saúde por inquérito domiciliar: percepção do usuário. Cad Saúde Pública 2008; 24(3): 663‑74.
27. Barros MBA, Francisco PMSB, Zanchetta LM, César CLG. Tendências das desigualdades sociais e demográicas na prevalência de doenças crônicas no Brasil, PNAD: 2003‑2008. Cienc Saúde Coletiva 2011; 16(9): 3755‑68.
28. Instituto Brasileiro de Geograia e Estatística (IBGE). Síntese de indicadores sociais 2010: uma análise das condições de vida da população brasileira. Rio de Janeiro: IBGE; 2010.
29. Araújo EM, Costa MCN, Hogan VK, Araújo TM, Dias AB, Oliveira LOA. A utilização da variável raça/cor em Saúde Pública: possibilidades e limites. Interface 2009; 13(31): 383‑94.
30. Lopes F. Para além da barreira dos números: desigualdades raciais e saúde. Cad Saúde Pública 2005; 21(5): 1595‑1601.
31. Malta DC, Bernal RTI. Comparison of risk and protective factors for chronic diseases in the population with and without health insurance in the Brazilian capitals, 2011. Rev Bras Epidemiol 2014; 17(Suppl): 241‑55.
32. Malta DC, Silva Junior JB. O Plano de Ações Estratégicas para o Enfrentamento das Doenças Crônicas Não Transmissíveis no Brasil e a deinição das metas globais para o enfrentamento dessas doenças até 2025: uma revisão. Epidemiol Serv Saúde 2013; 22(1): 151‑64.
Received on: 04/08/2015