*Correspondence: Muhammad Harris Shoaib. Department of Pharmaceutics, University of Karachi, 75270 - Main University Road – Karachi - Sindh, Paki-stan. E-mail: [email protected]
A
vol. 50, n. 4, oct./dec., 2014 http://dx.doi.org/10.1590/S1984-82502014000400016
Use of hydrophilic and hydrophobic polymers for the development
of controlled release tizanidine matrix tablets
Tariq Ali
1, Muhammad Harris Shoaib
1,*, Rabia Ismail Yousuf
1, Sabahat Jabeen
1,
Iyad Naeem Muhammad
1, Asia Tariq
21Department of Pharmaceutics, Faculty of Pharmacy, University of Karachi, Karachi, Pakistan, 2Dow University of Health Sciences, Karachi, Pakistan
The aim of the present study was to develop tizanidine controlled release matrix. Formulations were designed using central composite method with the help of design expert version 7.0 software. Avicel pH
101 in the range of 14-50% was used as a iller, while HPMC K4M and K100M in the range of 25-55%,
Ethylcellulose 10 ST and 10FP in the range of 15 - 45% and Kollidon SR in the range of 25-60% were used as controlled release agents in designing different formulations. Various physical parameters
including powder low for blends and weight variation, thickness, hardness, friability, disintegration
time and in-vitro release were tested for tablets. Assay of tablets were also performed as speciied in USP
35 NF 32. Physical parameters of both powder blend and compressed tablets such as compressibility index, angle of repose, weight variation, thickness, hardness, friability, disintegration time and assay were evaluated and found to be satisfactory for formulations K4M2, K4M3, K4M9, K100M2, K100M3, K100M9, E10FP2, E10FP9, KSR2, KSR3 & KSR9. In vitro dissolution study was conducted in 900 ml
of 0.1N HCl, phosphate buffer pH 4.5 and 6.8 medium using USP Apparatus II. In vitro release proiles
indicated that formulations prepared with Ethocel 10 standard were unable to control the release of drug while formulations K4M2, K100M9, E10FP2 & KSR2 having polymer content ranging from 40-55% showed a controlled drug release pattern in the above mentioned medium. Zero-order drug release kinetics was observed for formulations K4M2, K100M9, E10FP2 & KSR2. Similarity test (f2) results for K4M2, E10FP2 & KSR2 were found to be comparable with reference formulation K100M9. Response Surface plots were also prepared for evaluating the effect of independent variable on the responses.
Stability study was performed as per ICH guidelines and the calculated shelf life was 24-30 months for
formulation K4M2, K100M9 and E10FP2.
Uniterms: Tizanidine/controlled release. Hydroxypropyl methylcellulose/controlled release agent. Ethylcellulose/controlled release agent. Kollidon SR/controlled release agent. Tablets/controlled release.
O objetivo do presente estudo foi desenvolver matriz de de tizanidina de liberação controlada. As formulações foram projetadas usando o método do componente, central com a ajuda de software Design expert®, versão 7.0. Utilizou-se Avicel pH 101, no intervalo de 14-50%, como material de preenchimento, enquanto HPMC K4M e K100M, no intervalo de 25-55%, Etilcelulose 10 ST e 10FP, no intervalo de
15-45% e Kollidon SR, na faixa de 25-60% foram utilizados como agentes de liberação controlada, no planejamento de formulações diferentes. Vários parâmetros físicos, incluindo o luxo de pó para as misturas e variação de peso, espessura, dureza, friabilidade, tempo de desintegração e liberação
in vitro, foram testados para comprimidos. Ensaios dos comprimidos foram, também, realizados, tal
como especiicado em USP 35 NF 32. Avaliaram-se os parâmetros físicos de ambos, mistura em pó e
comprimidos, como índice de compressibilidade, ângulo de repouso, variação de peso, espessura, dureza,
friabilidade, tempo de desintegração e de ensaio, considerando-os satisfatórios para as formulações K4M2,
aparelho USP II. Os peris de liberação in vitro indicaram que as formulações preparadas com Ethocel 10 padrão não foram capazes de controlar a liberação do fármaco, enquanto as formulações K4M2, K100M9, E10FP2e KSR2, com teor de polímero variando entre 40 e 55% apresentaram padrão de liberação controlada de fármaco no meio anteriormente mencionado. Observou-se cinética de liberação de fármaco de ordem zero para as formulações K4M2 , K100M9, E10FP2 e KSR2. Resultados do teste de similaridade (f2) para K4M2, E10FP2 e KSR2 foram comparáveis com a formulação de referência K100M9. Gráicos de superfície de resposta também avaliaram o efeito da variável independente sobre as respostas. Estudo de estabilidade foi realizado conforme as diretrizes do ICH e a vida de prateleira
calculada foi de 24-30 meses para as formulações K4M2, K100M9 e E10FP2.
Unitermos: Tizanidina/liberação controlada.Hidroxipropilmetilcelulose/agente de liberação controlada.
Etilcelulose/agente de liberação controlada. Kollidon SR./agente de liberação controlada. Comprimidos/
liberação controlada.
INTRODUCTION
Controlled release formulations of drugs may
increase their therapeutic benefits, minimize side effects and enhance the patient compliance, therefore the overall disease management will be improved. Matrix based drug release systems offer many advantages such as the combination of matrix former and other materials can help in correlating the release characteristics to the requirements of drug and disease condition (Wilson,
Crowley, 2011).
Tizanidine hydrochloride is an imidazoline derivative.
It is a white to off white fine crystalline and odorless
powder which is slightly soluble in water and methanol.
Its solubility in water decreases with the increase in pH
(Moffat,Osselton, Widdop, 2011). Acts on α2 receptors that are centrally located and produces a myotonolytic response on skeletal muscle (Wagstaff, Bryson, 1997)
It acts mainly at spinal and supraspinal levels to inhibit
excitatory inter neuron and is used for the symptomatic relief of spasticity associated with multiple sclerosis or with
spinal cord injury or disease (Sweetman, 2009). It is also
used in relieving pain with many disorders like myofascial (Meythaler et al., 2001), refractory and neuropathic pain, chronic tension type headache and chronic daily headache (Saper et al., 2002). After oral administration, tizanidine is widely absorbed from the gastrointestinal tract (53 to 66%). Peak plasma concentration is achieved within 1 to
2 h. It has a bioavailability of about 34% to 40% and has a
half-life of 2.5 h. Protein binding of tizanidine is 30% and
it undergoes rapid and extensive irst-pass metabolism in
the liver (approximately 95% of a dose) (Shanker et al., 2009). The therapeutic dose of tizanidine is 2 mg and 4 mg twice a day. The maximum recommended dose is 36 mg/day (Kulkarni, Babu, 2012). The short half-life, low bioavailability and extensive first-pass metabolism make tizanidine a good candidate for the development of controlled release formulations.
In the present study controlled release formulations
of tizanidine hydrochloride were designed using different viscosity grades of hydroxopropyl methylcellulose, ethyl cellulose and Kollidon® SR. HPMC is an important
hydrophilic polymer extensively used for controlled release dosage forms development (Siepmann,Streubel,
Peppas, 2002). Its fast gel forming characteristics not
only control the initial release but also exert sustained release effect through strong viscous gel formation (Reza, Quadir, Haider, 2003). Moreover, its non-toxic nature, easy compressibility made it ideal for controlled release formulations of many drugs (Shoaib et al., 2010). Ethyl cellulose is also a nontoxic, inert hydrophobic polymer widely used in sustained release formulations and to control the dissolution rate of drugs (Quadir et al., 2005). As a matrix forming excipient for controlled release formulations Kollidon® SR is also an extensively used
polymer consisting of 80% water insoluble poly(vinyl
acetate) with a molecular weight of about 450.000 and about 20% water soluble poly(vinyl pyrrolidone), named as Kollidon® 30 (Strübing,Metz, Mäder, 2008). Many
researchers (Draganoiu, Andheria, Sakr, 2001; Shao
et al., 2001) used Kollidon® SR to delay the release of
highly water soluble drugs such as propranolol HCl, diphenhydramine HCl etc., with low friability and high
crushing strengths at low compression pressure (Kolter, 2002).
Response surface methodology applied for illustration of effect of independent variables (such
as polymers and illers) on the dependent variables or
responses (such as disintegration time and drug release). Response surface methodology (RSM) is a statistical tool for optimization of multifactor experiments (Hamsaveni,
Prapulla, Divakar, 2001; Chiang,Chang, Shieh, 2003;
Zhang et al., 2007). It is used to illustrate the correlation
between independent variables and responses (Vicente
et al., 1998). RSM require less effort with minimum
(Liyana-Pathirana, Shahidi, 2005; Xiong et al., 2009). Central
composite rotatable design (CCRD), is one of the design
approaches in RSM, was developed by Box and Wilson (Box, Wilson, 1951) and later improvement has been made in this design by Box and Hunter (Box, Hunter,
1957). CCRD is an effective optimization technique
which enables to recognize optimum responses around center points through its rotatable characteristics (Zhang
et al., 2010 a).
The aim of present work is to develop controlled release tizanidine matrix tablets using different polymers
i.e., HPMC, Ethocel and Kollidon® SR, by direct
compression method. Formulation of controlled release tizanidine tablets with these polymers using software Design expert® and application of response surface
models, has not been reported earlier. Study showed importance and give a detailed analysis of work which proved formulation of tizanidine with hydrophilic and hydrophobic polymers.
MATERIAL AND METHODS
Material
The following materials were used: tizanidine
hydrochloride (Novartis Pharma, Karachi), HPMC K4M
& K100M, Ethocel 10 Standard Premium and Ethocel 10
FP (Colorcon, England), Kollidon SR (BASF, Germany) Avicel PH 101 (FMC Corporation, USA) and magnesium stearate (Dow Chemical, USA).
Methods
Calculation of dose for controlled release tizanidine tablets
The total dose for tizanidine controlled release tablet can be calculated by using the following equation (Shoaib
et al., 2010).
t n d 1
2
D =D
(
1+0.693×T / t)
Eq (1)where Dt is the prolonged action dose, Dn is the normal dose and Td is a required maintenance time.
For tizanidine hydrochloride, immediate release dose (Dn) is 4mg and half-life is 2.5 hours. Therefore, for
a controlled release during 24h (Td), 30 mg of tizanidine (equivalent to 34 mg of tizanidine hydrochloride) per tablet was taken.
Preparation of tablets
Formulations were designed by using a software
Design expert®. Different formulations of HPMC
viscosity grades of K4M & K100M, Ethocel 10 ST (standard grade) & 10 FP(fine particle grade) and Kollidon SR were prepared by direct compression method. Each tablet containing 34 mg of tizanidine hydrochloride (equivalent to 30 mg of tizanidine) and
2mg of magnesium stearate, while polymers HPMC
K4M & K100M ranging from 25 to 55%, Ethocel 10ST & 10 FP (15% to 45%) and Kollidon SR (25 to 60%) were used as independent variable (X1) and Avicel PH 101(14
to 50% in HPMC formulations, 26 to 48% in Ethocel formulations and 8-51% in Kollidon SR formulations) was
used as second independent variable (X2). Formulation excipients and active ingredient were passed through 40-mesh size sieve and accurately weighed. Excipients and active ingredient of each formulation were blended
by tumbling method in a polybag for about 8-10 min and
then compressed on manually operated single punch tablet
press (Korsch Erweka, Frankfurt, Germany). Convex
round shaped punch was used and tablets were pressed in a range of 96 to 126 mg.
Experimental design
To find out the optimum level of variable, a two
factor with ive levels CCD was developed. It consists of
factorial points at two levels, axial points at two levels and center point. Hence, independent variables (X1:Polymer
and X2: Avicel PH 101) at ive levels were considered. The levels were -α, -1, 0,1 and +α. The alpha value (1.414)
was taken to execute design rotatibility. Disintegration
time and drug release both at 2 and 8 h were selected as
responses. The coded and actual values of variables are
given in Table I. By using Design Expert software (Version 7, Stat-Ease Inc., Minneapolis, MN), CCD generated a
total of nine (9) experiments with four factorial, four axial and one center point. Hao et al also used central composite
response surface design with ive replicated center points
(Hao et al., 2012).
Micromeritic Study
Mi c r o m e r i t i c p r o p e r t i e s o f p o wd e r b l e n d s such as tapped density, bulk density, Hausner’s ratio, compressibility index and angle of repose were evaluated using the procedure specified in US pharmacopeia (USP35-NF30, 2012).
Hausner’s ratio, compressibility index and angle of repose were calculated by the following equations.
tapped bulk
Hausner’s ratio ( ρ= /ρ ) Eq (2)
tapped bulk tapped
TABLE I - A two factor central composite rotatable design of experiments for tizanidine formulations
Formulation Code
Coded factor level Factors Amount (% )
Factors Amount
(mg) Total Wt. of Tablet (mg)
Total wt. adjusted (mg)
X 1 X 2
HPMC K4M HPMC K4M Avicel PH 101 HPMC K4M Avicel PH 101 HPMC K4M Avicel PH 101
K4M 1 -1 -1 30.00 20.00 30.84 20.56 87.40 88
K4M 2 1 -1 50.00 20.00 51.40 20.56 107.96 108
K4M 3 -1 1 30.00 45.00 30.84 46.26 113.10 113
K4M 4 1 1 50.00 45.00 51.40 46.26 133.66 134
K4M 5 -1.414 0 25.86 32.50 26.58 33.41 95.99 96
K4M 6 1.414 0 54.14 32.50 55.66 33.41 125.07 125
K4M 7 0 -1.414 40.00 14.82 41.12 15.23 92.35 93
K4M 8 0 1.414 40.00 50.18 41.12 51.58 128.70 128
K4M 9 0 0 40.00 32.50 41.12 33.41 110.53 110
HPMC K100M HPMC K100M Avicel PH 101 HPMC K100M Avicel PH 101 HPMC K100M Avicel PH 101
K100M 1 -1 -1 30.00 20.00 30.84 20.56 87.40 88
K100M 2 1 -1 50.00 20.00 51.40 20.56 107.96 108
K100M 3 -1 1 30.00 45.00 30.84 46.26 113.10 113
K100M 4 1 1 50.00 45.00 51.40 46.26 133.66 134
K100M 5 -1.414 0 25.86 32.50 26.58 33.41 95.99 96
K100M 6 1.414 0 54.14 32.50 55.66 33.41 125.07 125
K100M 7 0 -1.414 40.00 14.82 41.12 15.23 92.35 93
K100M 8 0 1.414 40.00 50.18 41.12 51.58 128.70 128
K100M 9 0 0 40.00 32.50 41.12 33.41 110.53 110
Ethocel 10 Standard Ethocel 10 ST Avicel PH 101 Ethocel 10 ST Avicel PH 101 Ethocel 10 ST Avicel PH 101
E10ST 1 -1 -1 20.00 30.00 22.00 33.00 91.00 91
E10ST 2 1 -1 40.00 30.00 44.00 33.00 113.00 113
E10ST 3 -1 1 20.00 45.00 22.00 49.50 107.50 108
E10ST 4 1 1 40.00 45.00 44.00 49.50 129.50 130
E10ST 5 -1.414 0 15.86 37.50 17.45 41.25 94.70 95
E10ST 6 1.414 0 44.14 37.50 48.56 41.25 125.81 126
E10ST 7 0 -1.414 30.00 26.89 33.00 29.58 98.58 99
E10ST 8 0 1.414 30.00 48.11 33.00 52.92 121.92 122
E10ST 9 0 0 30.00 37.50 33.00 41.25 110.25 110
Ethocel 10 FP Ethocel 10 FP Avicel PH 101 Ethocel 10 FP Avicel PH 101 Ethocel 10 FP Avicel PH 101
E10FP 1 -1 -1 20.00 30.00 22.00 33.00 91.00 91
E10FP 2 1 -1 40.00 30.00 44.00 33.00 113.00 113
E10FP 3 -1 1 20.00 45.00 22.00 49.50 107.50 108
E10FP 4 1 1 40.00 45.00 44.00 49.50 129.50 130
E10FP 5 -1.414 0 15.86 37.50 17.45 41.25 94.70 95
E10FP 6 1.414 0 44.14 37.50 48.56 41.25 125.81 126
E10FP 7 0 -1.414 30.00 26.89 33.00 29.58 98.58 99
E10FP 8 0 1.414 30.00 48.11 33.00 52.92 121.92 122
E10FP 9 0 0 30.00 37.50 33.00 41.25 110.25 110
Kollidon SR KSR Avicel PH 101 KSR Avicel PH 101 KSR Avicel PH 101
KSR 1 -1 -1 30.00 15.00 33.00 16.50 85.50 86
KSR 2 1 -1 55.00 15.00 60.50 16.50 113.00 113
KSR 3 -1 1 30.00 45.00 33.00 49.50 118.50 118
KSR 4 1 1 55.00 45.00 60.50 49.50 146.00 146
KSR 5 -1.414 0 24.82 30.00 27.30 33.00 96.30 96
KSR 6 1.414 0 60.18 30.00 66.20 33.00 135.20 135
KSR 7 0 -1.414 42.50 8.79 46.75 9.67 92.42 92
KSR 8 0 1.414 42.50 51.21 46.75 56.33 139.08 139
tan(α)=height / 0.5 base Eq (4)
where ρtapped and ρbulk were the tapped and bulk densities of
blends, respectively and α was the angle of repose.
Evaluation of tizanidine tablets
Tizanidine tablets were evaluated using several physical parameters including weight variation, hardness, thickness, friability and disintegration. Weight variation
was performed by using digital balance (Sartorius CP
224S, Germany) for all compressed formulations. Tablet hardness was determined using Fujiwara Seisakusho
tablet hardness tester, Ogawa Seiko Co Ltd, Tokyo,
Japan. Tablet disintegration test were performed using USP basket rack assembly (Erweka disintegration tester, ZT2, Heusenstamm, Germany). Tablet friability was carried out using Roche type friabilator (H Jurgens
friabilator GmbH & Co. D-2800 Breman, Germany)
(USP 35-NF 30, 2012).
Swelling studies
Swelling studies of tablets were performed by gently placing a tablet (using a wire) in a beaker containing about 250 mL of distilled water at room temperature. The weights of swollen tablets (after absorbing excess water
through a ilter paper) were recorded at 1, 2, 3, 4, 6 and 8 h. Water uptake (%) was expressed as a percentage of initial tablet weight (Cao et al., 2005).
t o
0
W W
% S 100
W
−
= × Eq (5)
where S is the swelling of tablet, Wt is the weight of swollen tablet and Wo is the initial weight of tablet.
Dissolution studies
Dissolution studies were performed by placing six tablets of each formulation in 900 mL of dissolution medium at 37±0.5 ºC using a USP apparatus II dissolution tester (DT 600, Erweka, Germany). Paddles were rotated
at 100rpm and the medium used was 0.1 N HCl, Phosphate buffer at pH 4.5 & 6.8. Samples were analyzed using UV-VIS spectrophotometer (UV-1800, Shimadzu, Kyoto,
Japan) at 320 nm by withdrawing 5 mL of aliquots at
regular time interval of 30min, 1, 2, 3, 4, 5, 6, 8, 10, 12, 16, 20 and 24h and iltered using a 0.45 μm ilter. These
aliquots were replaced by the same medium previously maintained at 37±0.5 ºC.
Quantification of tizanidine in the formulation
Drug quantification was performed using high performance liquid chromatographic method. The mobile
phase was composed of acetonitrile and buffer solution of sodium 1-petanesulfonate in a ratio of 4:1 (buffer solution was prepared by adding 3.5g of sodium 1-pentane sulfonate in 1 liter of water and pH was adjusted with phosphoric acid solution or 1 N sodium hydroxide at pH
3.0±0.05). The HPLC system consists of a pump LC- 10 AT VP, Communication Bus Module CBM 102, and a UV
detector SPD 10-A VP (Shimadzu Corp, Tokyo, Japan).
The column used was Intersil ODS-3, 4.6 x 250mm which
was maintained at 50 °C in a column oven (CTO-10A,
Shimadzu Corp., Kyoto, Japan) with a flow rate of 1 mL/min. Injection volume was 10 µL and detection wave
length was 230 nm. Software used was class GC 10 ver. 2.0 (1993-2000), (Shimadzu Corp., Kyoto, Japan) was used
for data processing (USP 35-NF 30, 2012).
Stability studies
The optimized formulations were then subjected to
accelerated stability study as per ICH guidelines i.e. by
placing tablets in a Stability chamber ((Binder GMBH Bergster, Tullingen,Germany) at 40±2 °C and 75±5% RH (ICH, 2003). The samples were removed and tested at 0, 1, 3 and 6 months and different physico-chemical parameters like hardness, friability, disintegration,
dissolution and quantiication were assessed. The shelf life
was calculated using R-Gui version 2.15.2 (stab) package
(The R Foundation for Statistical Computing).
Data Analysis
• Model-dependent methods
In order to propose mechanism of drug release from
these formulations, in vitro dissolution proiles data were
itted into different kinetic models. These models were
zero order (cumulative amount of drug released vs time),
irst-order (log cumulative percentage of drug remaining
vs time), Higuchi’s (cumulative percentage of drug released vs square root of time), Hixson–Crowell (cube
root percent drug remaining vs time) and Korsmeyer’s (log cumulative percentage of drug released vs log time).
• Zero order equation:
Qt = Kot Eq (6)
where Ko is the zero-order rate constant expressed in units
of concentration/time, t is the time in hours, and Qt is the amount of drug release in time t.
• First-order equation:
where Qt is the amount released at time t, Qo is the initial
amount of drug in solution and k is the first order rate constant and t is the time.
• Higuchi’s equation:
Q = kt1/2 Eq (8)
where k is the release rate constant and t is the time in hours. Hence, the drug release rate is proportional to the reciprocal of the square root of time (David, 2002).
• Hixson–Crowell Cube Root equation
Qo1/3 – Qt1/3 = KHC × t Eq (9)
where KHC is the Hixson–Crowell rate constant, Qo is the
intial amount of drug and Qt is the amount of drug release at time t (Higuchi, 1963).
For zero order, Higuchi, and Hixson–Crowell model,
the rate constant were also calculated that is simply equal to the slope of the straight line:
Ko = Slope Eq (10)
Below is showed the equation used for irst-order
rate constant
K = –Slope × 2.303 Eq (11)
Korsmeyer’s equation (Power law),
Mt / M∞ = Kt
n Eq (12)
where Mt is the amount of drug released at time t, M∞
is the amount of drug released after ininite time (total
drug in a dosage form), K is the Korsmeyer’s dissolution rate constant and n is the release exponent which was calculated through the slope of the straight line which
characterizes the mechanism of release (Hixson, Crowell,
1931).
For matrix devices that are cylindrical-shaped, if the exponent n value is 0.45 it is indicative of Fickian release
(case I), for non-Fickian release (anomalous) it should be >0.45 but <0.89, value of 0.89 is indicative of case II (zero order) release, and >0.89 is super case II type of release
(Korsmeyer et al., 1983).
Model Independent Method
• Similarity Factor (f2)
The similarity factor (f2) is a logarithmic reciprocal
square root transformation of the sum of squared error and is a measurement of the similarity in the percent dissolution between the two curves:
(
)
2 0.52 i i
1
f 50 log 1 R T 100
N
−
= × + − ×
∑
Eq (13)
where Ri is the percent dissolved of referenced drug, Ti is the percent dissolved of test drug at each time point and
N is the number of samples. Its value will be 100 where test and reference drug proiles are identical. Dissimilarity in proiles increases with the decrease in f2 (Costa, Sousa
Lobo, 2001).
RESULTS AND DISCUSSION
Formulation of tizanidine matrix tablets
Tizanidine controlled release formulations were designed using software Design Expert version 7.0. The coded and actual quantities of individual content of tablet
for different polymers i.e HPMC (K4M & K100M) Ethocel (10 ST & 10 FP) and Kollidon SR are shown in Table I. HPMC K4M and K100M formulations were assigned formulation code K4M and K100M as preix followed
by numeric number as suffix. Similarly, formulations containing Ethocel 10 Standard grade, Ethocel 10 fine particle grade and Kollidon SR were assigned formulation codes E10ST, E10FP and KSR, respectively and followed
by a numeric number as sufix.
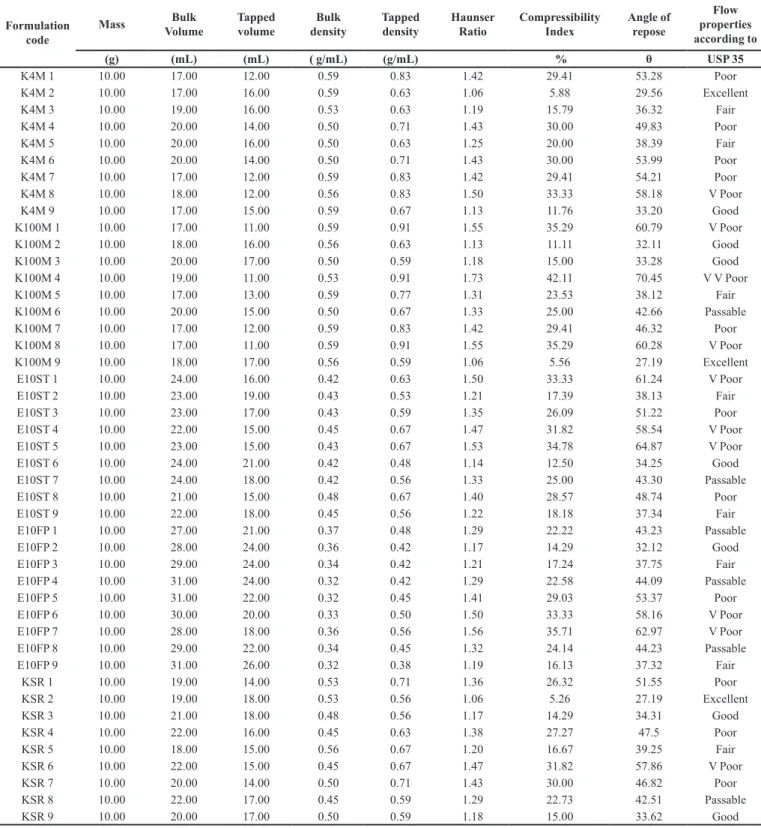
Evaluation of powder blends and tablets
Micromeritic evaluation of powder blends, Hausner’s ratio, compressibility index and angle of repose were calculated for the formulations and showed in Table
II. The powder blends which comply with USP standard
and categorized as Fair to Excellent, were chosen for compression and further studies. The formulations which
complied with USP standards in terms of low properties
were K4M2, K4M3, K4M5, K4M9, K100M2, K100M 3, K100M 5, K100M9, E10ST 2, E10ST 6, E10ST 9, E10FP 2, E10FP 3, E10FP 9, KSR 2, KSR 3, KSR 5 and KSR 9. These formulations were evaluated for physical parameters such as thickness, hardness, weight variation,
friability, disintegration time and assay (Table III). The mean thickness and hardness of tablets were in the range
of 3.67 ± 0.14 to 4.39 ± 0.18 mm and 3.40 ± 0.78 to 12.92 ± 1.80kg, respectively. Powder flowability and
due to binding characteristic of the filler and the force of compression with which the ingredients have been compressed (Siddiqui, Nazzal, 2007). Weight variation was in the range of 95.74 ± 6.32 to 125.35 ± 4.53 mg. Friability of compressed formulations was < 1% except
for formulations K4M5 and KSR5. Disintegration time of less than 4 hours was observed for K4M5, K100M5, E10ST 2, 6 & 9, E10FP3 and KSR 5 formulations. Early disintegration observed in formulation where the concentration of polymers was low, it seemed that low
TABLE II - Micromeritic Properties of different formulation blends
Formulation code
Mass Bulk Volume
Tapped volume
Bulk density
Tapped density
Haunser Ratio
Compressibility Index
Angle of repose
Flow properties according to
(g) (mL) (mL) ( g/mL) (g/mL) % θ USP 35
K4M 1 10.00 17.00 12.00 0.59 0.83 1.42 29.41 53.28 Poor
K4M 2 10.00 17.00 16.00 0.59 0.63 1.06 5.88 29.56 Excellent
K4M 3 10.00 19.00 16.00 0.53 0.63 1.19 15.79 36.32 Fair
K4M 4 10.00 20.00 14.00 0.50 0.71 1.43 30.00 49.83 Poor
K4M 5 10.00 20.00 16.00 0.50 0.63 1.25 20.00 38.39 Fair
K4M 6 10.00 20.00 14.00 0.50 0.71 1.43 30.00 53.99 Poor
K4M 7 10.00 17.00 12.00 0.59 0.83 1.42 29.41 54.21 Poor
K4M 8 10.00 18.00 12.00 0.56 0.83 1.50 33.33 58.18 V Poor
K4M 9 10.00 17.00 15.00 0.59 0.67 1.13 11.76 33.20 Good
K100M 1 10.00 17.00 11.00 0.59 0.91 1.55 35.29 60.79 V Poor
K100M 2 10.00 18.00 16.00 0.56 0.63 1.13 11.11 32.11 Good
K100M 3 10.00 20.00 17.00 0.50 0.59 1.18 15.00 33.28 Good
K100M 4 10.00 19.00 11.00 0.53 0.91 1.73 42.11 70.45 V V Poor
K100M 5 10.00 17.00 13.00 0.59 0.77 1.31 23.53 38.12 Fair
K100M 6 10.00 20.00 15.00 0.50 0.67 1.33 25.00 42.66 Passable
K100M 7 10.00 17.00 12.00 0.59 0.83 1.42 29.41 46.32 Poor
K100M 8 10.00 17.00 11.00 0.59 0.91 1.55 35.29 60.28 V Poor
K100M 9 10.00 18.00 17.00 0.56 0.59 1.06 5.56 27.19 Excellent
E10ST 1 10.00 24.00 16.00 0.42 0.63 1.50 33.33 61.24 V Poor
E10ST 2 10.00 23.00 19.00 0.43 0.53 1.21 17.39 38.13 Fair
E10ST 3 10.00 23.00 17.00 0.43 0.59 1.35 26.09 51.22 Poor
E10ST 4 10.00 22.00 15.00 0.45 0.67 1.47 31.82 58.54 V Poor
E10ST 5 10.00 23.00 15.00 0.43 0.67 1.53 34.78 64.87 V Poor
E10ST 6 10.00 24.00 21.00 0.42 0.48 1.14 12.50 34.25 Good
E10ST 7 10.00 24.00 18.00 0.42 0.56 1.33 25.00 43.30 Passable
E10ST 8 10.00 21.00 15.00 0.48 0.67 1.40 28.57 48.74 Poor
E10ST 9 10.00 22.00 18.00 0.45 0.56 1.22 18.18 37.34 Fair
E10FP 1 10.00 27.00 21.00 0.37 0.48 1.29 22.22 43.23 Passable
E10FP 2 10.00 28.00 24.00 0.36 0.42 1.17 14.29 32.12 Good
E10FP 3 10.00 29.00 24.00 0.34 0.42 1.21 17.24 37.75 Fair
E10FP 4 10.00 31.00 24.00 0.32 0.42 1.29 22.58 44.09 Passable
E10FP 5 10.00 31.00 22.00 0.32 0.45 1.41 29.03 53.37 Poor
E10FP 6 10.00 30.00 20.00 0.33 0.50 1.50 33.33 58.16 V Poor
E10FP 7 10.00 28.00 18.00 0.36 0.56 1.56 35.71 62.97 V Poor
E10FP 8 10.00 29.00 22.00 0.34 0.45 1.32 24.14 44.23 Passable
E10FP 9 10.00 31.00 26.00 0.32 0.38 1.19 16.13 37.32 Fair
KSR 1 10.00 19.00 14.00 0.53 0.71 1.36 26.32 51.55 Poor
KSR 2 10.00 19.00 18.00 0.53 0.56 1.06 5.26 27.19 Excellent
KSR 3 10.00 21.00 18.00 0.48 0.56 1.17 14.29 34.31 Good
KSR 4 10.00 22.00 16.00 0.45 0.63 1.38 27.27 47.5 Poor
KSR 5 10.00 18.00 15.00 0.56 0.67 1.20 16.67 39.25 Fair
KSR 6 10.00 22.00 15.00 0.45 0.67 1.47 31.82 57.86 V Poor
KSR 7 10.00 20.00 14.00 0.50 0.71 1.43 30.00 46.82 Poor
KSR 8 10.00 22.00 17.00 0.45 0.59 1.29 22.73 42.51 Passable
concentration of polymers was unable to control tablet
disintegration upto 4 hours. It was also observed that
tablets formulated with Ethocel 10 Standard grade were unable to control the disintegration that may be due to their larger particle size which allows water to penetrate inside
the void spaces as reported by Crowley et al. (2004). Assay of all compressed formulations were within the limits as
speciied in USP (USP35-NF30, 2012).
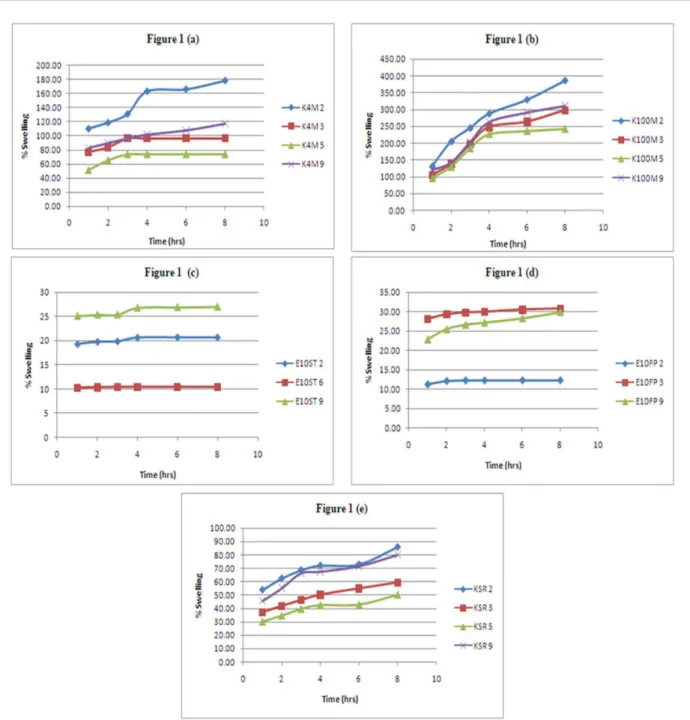
Study of hydration behavior
Swelling studies revealed the swelling properties of tablets and studied as a function of polymers used in the study. The swelling behavior of a polymer enables the formation of swellable layer or the gel layer. The gel layer hindered movement of drug from inner dry layer and enable the release of drug only from the upper gel layer and causing a controlled release of drug. Formulations containing hydrophilic polymers swell well while the hydrophobic polymers showed less swelling behavior.
The results of swelling behavior with different
polymers were shown in Figure 1. It is clear from the results that HPMC showed highest hydration ability
as compared to Kollidon SR and Ethocel due to its hydrophilic nature. Formulation containing Ethocel
showed least swelling among three tested polymers due to its higher hydrophobic nature. The data showed that by
increasing the quantity of HPMC K4M and K100M, tablet
swelling has been increased. Nerurkar et al., also noticed that increase in concentration of polymer in matrix will cause an increase of amount of water uptake (Nerurkar
et al., 2005). Further, from these results it is also clear
that with change of HPMC viscosity grade to higher side,
swelling properties also enhanced.
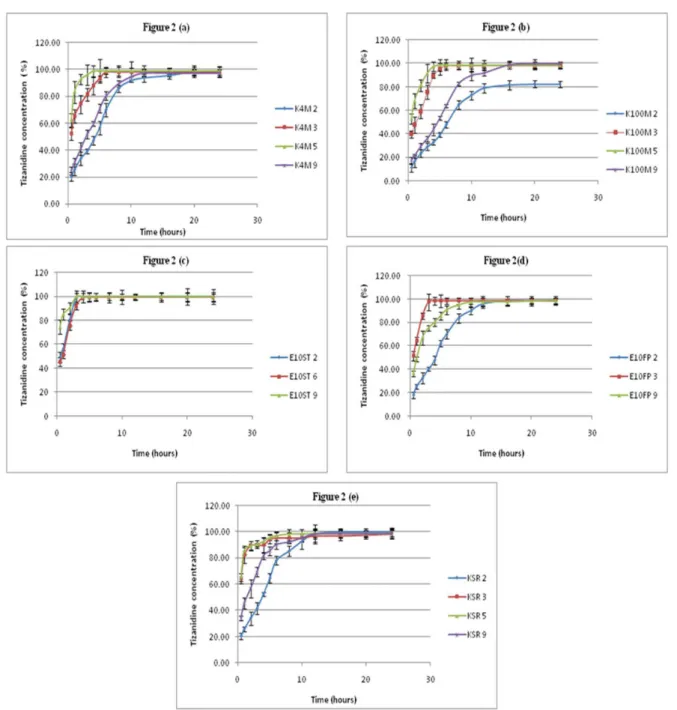
In vitro drug release profiles
Tizanidine formulations release proiles in 0.1 N HCl, phosphate buffer pH 4.5 and 6.8 were presented
in Figure 2, 3 and 4, respectively. Release profiles of tizanidine tablets in different dissolution media were not
found signiicantly different. Amir and Ahmad (2010),
also found the similar type of drug release behavior of
tizanidine and tramadol modiied release microparticles in 0.1 N HCl and pH 6.8 phosphate buffer. It was found that
formulations with Ethocel 10 standard grade were unable to control the release and nearly the entire drug has been released within 4 hours in the three dissolution media. According to Percolation theory, in a matrix formulation of hydrophilic drug and hydrophobic polymer, drug release
TABLE III - Physical Evaluation and assay of tizanidine matrix
Formulation code
Thickness (mm)
Hardness (kg)
Weight Variation (mg)
Friablity (%)
Disintegration time (hrs)
Assay (%)
K4M 2 3.96 ± 0.10 4.81 ± 0.52 108.23 ± 2.80 0.76 4.82 98.76
K4M 3 4.05 ± 0.12 4.20 ± 0.38 113.21 ± 2.80 0.91 4.18 97.25
K4M 5 3.67 ± 0.14 3.74 ± 0.70 96.98 ± 5.00 1.14 3.55 96.38
K4M 9 3.99 ± 0.12 4.69 ± 1.18 110.71 ± 4.06 0.94 4.30 98.05
K100M 2 4.01 ± 0.14 5.87 ± 0.68 109.30 ± 3.66 0.57 6.87 98.37
K100M 3 4.03 ± 0.16 4.30 ± 0.70 113.37 ± 4.78 0.85 4.95 97.82
K100M 5 3.97 ± 0.16 4.04 ± 1.12 95.74 ± 6.32 0.99 3.73 98.61
K100M 9 3.98 ± 0.08 5.57 ± 0.76 110.27 ± 4.00 0.63 6.58 98.87
E10ST 2 4.01 ± 0.15 8.04 ± 1.86 113.54 ± 3.71 0.76 1.42 96.81
E10ST 6 4.39 ± 0.18 8.53 ± 2.26 125.35 ± 4.53 0.69 2.10 97.32
E19ST 9 4.05 ± 0.13 7.96 ± 1.57 109.85 ± 3.82 0.97 1.38 96.18
E10FP 2 3.99 ± 0.08 12.92 ± 1.80 113.77 ± 3.74 0.30 5.72 98.79
E10FP 3 4.00 ± 0.10 11.75 ± 2.14 109.46 ± 4.5 0.95 3.68 96.32
E10FP 9 3.98 ± 0.14 12.57 ± 2.30 110.82 ± 5.38 0.47 5.13 98.24
KSR 2 4.24 ± 0.10 5.01 ± 0.74 113.30 ± 3.04 0.29 7.52 98.39
KSR 3 4.07 ± 0.14 4.24 ± 0.88 118.97 ± 3.98 0.84 4.25 96.51
KSR 5 4.04 ± 0.12 3.40 ± 0.78 96.82 ± 5.28 1.53 3.15 95.23
FIGURE 1 - Hydration behavior of tizanidine matrix formulations containing (a) HPMC K4M (b) HPMC K100M (c) Ethocel 10ST (d) Ethocel 10 FP (e) Kollidon SR.
was derived by dissolution of drug through capillaries composed of interconnecting drug particle cluster and
pore network (Holman, Leuenberger, 1988). With more
ethyl cellulose particles fewer pore networks were formed
(Crowley et al., 2004) as the case with ine particles and
retard the release while in case of coarser particles the more pore network will be formed that was unable to control the release of drug.
Formulations containing 25% or less of polymer (K4M5, K100M5, E10FP3 and KSR5) were also unable to retard the release and more than 90% of drug was
available in dissolution media in 4 hours. Tablets with a polymer ratio of 30% (K4M3, K100M3 and KSR3)
released about 80% of drug except in case of Ethocel 10
FP (E10FP9) where 76% release was observed with 30%
of polymer. K100M9 (HPMC K100M: 40% polymer) given a good controlled release proile. From K100M9 formulation, around 40% drug released in 4h, 80% in 8h and 98% in 24 hours. Similar type of profiles were
observed in formulations K4M2 (50% polymer), E10FP2 (40% polymer) and KSR2 (55% polymer) in which around
85% drug released in 8 hours and 94 to 99% drug released in 24 hours. It was observed in all formulations that drug
release has inverse relation with polymer concentration. Barakat,Elbagory and Almurshedi (2009) found that
increase in the concentration of HPMC results in reduction
in the release rate from carbamazepine matrix formulation and followed non-fickian diffusion which shifted to
case II with the increase in HPMC ratio in formulation, showed signiicant contribution through erosin. Similarly,
Baviskar,Sharma and Jain (2013) observed retard release of verapamil hydrochloride matrix tablet with increase
in concentration of HPMC K15M and Eudragit RSPO.
Reza,Quadir and Haider (2003) found increase in drug release rate with decreasing total polymeric content of matrix tablets of theophylline, diclofenac sodium and diltiazem hydrochloride by using plastic, hydrophobic and hydrophilic polymers. The release rate was much retarded in formulation K100M2 which contains 50% of
polymer and around 80% of the drug release in 24 hours.
Huang et al. (2004) had similar finding where release was incomplete from propranalol hydrochloride tablet
containing high amount of HPMC.
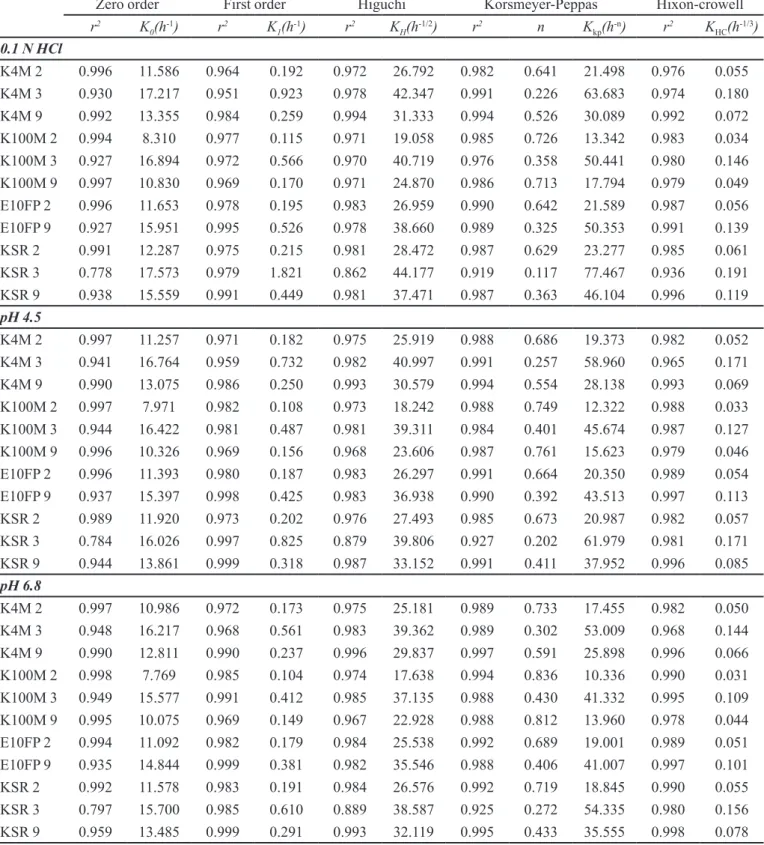
Drug release kinetics
Model dependent method
Drug release kinetics from tizanidine matrix tablets was described by various mathematical models
and equations. The dissolution data was itted to zero
order, first order, Higuchi, Korsmeyer-Peppas and
Hixon-Crowell to determine the mechanism of drug release. The Regression coeficients and release constants were calculated by DD-solver and shown in Table IV.
DD Solver is an add-in program for Microsoft Excel®
for dissolution data modeling and proile comparison
(Zhang et al., 2010b). The dissolution data up to 8 hours
were used for all formulations. The data selection was based on the data until the time which represent the dynamics of dissolution process (Polli et al., 1997). The tizanidine formulations which were best support the zero order release kinetics were K4M2, K100M9, E10FP2 and KSR2 as highest linearity values were
observed in 0.1 N HCl, phosphate buffer pH 4.5 and 6.8. Formulation, K100M2 although yielded zero-order
but incomplete release kinetics. Bravo, Lamas and
Salomon (2002) found zero order release kinetics for
diclofenac sodium HPMC matrix tablets with highest regression coeficient values followed by Higuchi and
first order. SankaliaSankalia, Mashru (2008) have
formulated glipizide matrix tablets with xanthan:MCC PH301 and xanthan:HPMC K4M:Starch 1500 with
Korsmeyer–Peppas’ and zero-order release mechanism, respectively. Jan et al. (2011) successfully developed sustained release Ketoprofen tablets with different grades of Ethocel FP and found release kinetics nearly zero-order. Sahoo et al. (2008) prepared controlled release
propranalol hydrochloride tablet by direct compression with 40% Kollidon SR that showed a zero-order release kinetics.
The diffusional coefficient (n) obtained from Korsmeyers equation were in the range of > 0.45 to
< 0.89 for K4M2, K100M9, E10FP2 and KSR2 which
showed that drug was release through anomalous transport also known as non-Fickian release that was an indication that the release of drug is controlled by
both diffusion and erosion mechanism (Peppas, 1985).
This equation has also been used by many researchers
TABLE IV - Model dependent assessment of tizanidine formulations
Zero order First order Higuchi Korsmeyer-Peppas Hixon-crowell
r2 K
0(h
-1) r2 K
1(h
-1) r2 K
H(h
-1/2) r2 n K
kp(h
-n) r2 K
HC(h-1/3)
0.1 N HCl
K4M 2 0.996 11.586 0.964 0.192 0.972 26.792 0.982 0.641 21.498 0.976 0.055
K4M 3 0.930 17.217 0.951 0.923 0.978 42.347 0.991 0.226 63.683 0.974 0.180
K4M 9 0.992 13.355 0.984 0.259 0.994 31.333 0.994 0.526 30.089 0.992 0.072
K100M 2 0.994 8.310 0.977 0.115 0.971 19.058 0.985 0.726 13.342 0.983 0.034
K100M 3 0.927 16.894 0.972 0.566 0.970 40.719 0.976 0.358 50.441 0.980 0.146
K100M 9 0.997 10.830 0.969 0.170 0.971 24.870 0.986 0.713 17.794 0.979 0.049
E10FP 2 0.996 11.653 0.978 0.195 0.983 26.959 0.990 0.642 21.589 0.987 0.056
E10FP 9 0.927 15.951 0.995 0.526 0.978 38.660 0.989 0.325 50.353 0.991 0.139
KSR 2 0.991 12.287 0.975 0.215 0.981 28.472 0.987 0.629 23.277 0.985 0.061
KSR 3 0.778 17.573 0.979 1.821 0.862 44.177 0.919 0.117 77.467 0.936 0.191
KSR 9 0.938 15.559 0.991 0.449 0.981 37.471 0.987 0.363 46.104 0.996 0.119
pH 4.5
K4M 2 0.997 11.257 0.971 0.182 0.975 25.919 0.988 0.686 19.373 0.982 0.052
K4M 3 0.941 16.764 0.959 0.732 0.982 40.997 0.991 0.257 58.960 0.965 0.171
K4M 9 0.990 13.075 0.986 0.250 0.993 30.579 0.994 0.554 28.138 0.993 0.069
K100M 2 0.997 7.971 0.982 0.108 0.973 18.242 0.988 0.749 12.322 0.988 0.033
K100M 3 0.944 16.422 0.981 0.487 0.981 39.311 0.984 0.401 45.674 0.987 0.127
K100M 9 0.996 10.326 0.969 0.156 0.968 23.606 0.987 0.761 15.623 0.979 0.046
E10FP 2 0.996 11.393 0.980 0.187 0.983 26.297 0.991 0.664 20.350 0.989 0.054
E10FP 9 0.937 15.397 0.998 0.425 0.983 36.938 0.990 0.392 43.513 0.997 0.113
KSR 2 0.989 11.920 0.973 0.202 0.976 27.493 0.985 0.673 20.987 0.982 0.057
KSR 3 0.784 16.026 0.997 0.825 0.879 39.806 0.927 0.202 61.979 0.981 0.171
KSR 9 0.944 13.861 0.999 0.318 0.987 33.152 0.991 0.411 37.952 0.996 0.085
pH 6.8
K4M 2 0.997 10.986 0.972 0.173 0.975 25.181 0.989 0.733 17.455 0.982 0.050
K4M 3 0.948 16.217 0.968 0.561 0.983 39.362 0.989 0.302 53.009 0.968 0.144
K4M 9 0.990 12.811 0.990 0.237 0.996 29.837 0.997 0.591 25.898 0.996 0.066
K100M 2 0.998 7.769 0.985 0.104 0.974 17.638 0.994 0.836 10.336 0.990 0.031
K100M 3 0.949 15.577 0.991 0.412 0.985 37.135 0.988 0.430 41.332 0.995 0.109
K100M 9 0.995 10.075 0.969 0.149 0.967 22.928 0.988 0.812 13.960 0.978 0.044
E10FP 2 0.994 11.092 0.982 0.179 0.984 25.538 0.992 0.689 19.001 0.989 0.051
E10FP 9 0.935 14.844 0.999 0.381 0.982 35.546 0.988 0.406 41.007 0.997 0.101
KSR 2 0.992 11.578 0.983 0.191 0.984 26.576 0.992 0.719 18.845 0.990 0.055
KSR 3 0.797 15.700 0.985 0.610 0.889 38.587 0.925 0.272 54.335 0.980 0.156
KSR 9 0.959 13.485 0.999 0.291 0.993 32.119 0.995 0.433 35.555 0.998 0.078
to identify the release mechanism of drug. Savaşer et al.
used the same application for drug release mechanism
evaluation from diclofenac sodium containing HPMC matrices (Savaşer,Özkan, Işmer, 2005), Roni,Kibria and
TABLE V - Similarity Factor (f2) Values of Tizanidine formulations
Comparision f2 Dissolution Proile
0.1 N HCl pH 4.5 pH 6.8
K100M9 and K4M2 69.28 65.69 65.80 Similar
K100M9 and K4M3 20.42 20.96 22.44 Dissimilar
K100M9 and K4M9 43.66 42.05 42.22 Dissimilar
K100M9 and K100M2 47.22 48.88 49.19 Dissimilar
K100M9 and K100M3 23.73 24.33 26.37 Dissimilar
K100M9 and E10FP2 66.04 60.97 59.94 Similar
K100M9 and E10FP9 26.00 27.33 28.24 Dissimilar
K100M9 and KSR2 55.27 53.27 54.19 Similar
K100M9 and KSR3 16.57 20.68 21.93 Dissimilar
K100M9 and KSR9 28.13 33.48 34.45 Dissimilar
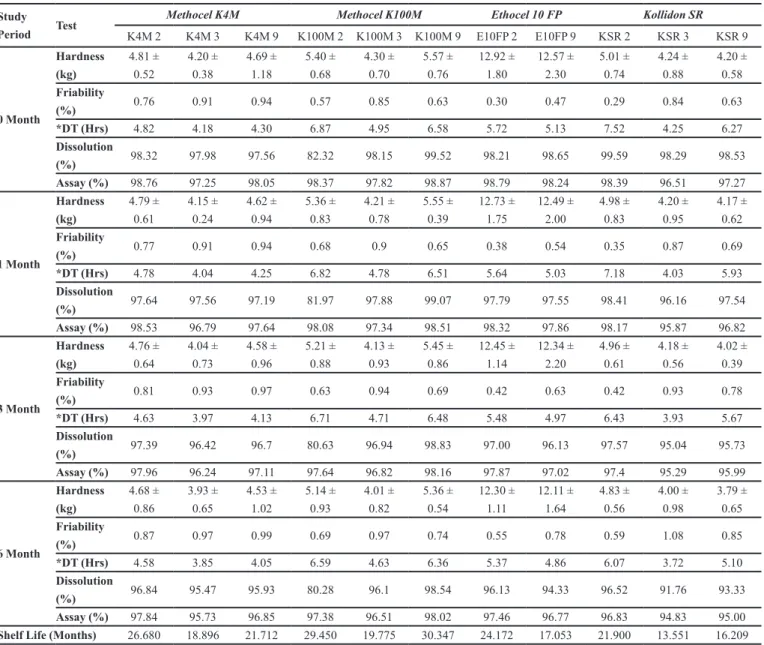
TABLE VI - Stability studies and shelf life of Controlled release tizanidine formulations
Study Period Test
Methocel K4M Methocel K100M Ethocel 10 FP Kollidon SR
K4M 2 K4M 3 K4M 9 K100M 2 K100M 3 K100M 9 E10FP 2 E10FP 9 KSR 2 KSR 3 KSR 9
0 Month
Hardness (kg)
4.81 ± 0.52 4.20 ± 0.38 4.69 ± 1.18 5.40 ± 0.68 4.30 ± 0.70 5.57 ± 0.76 12.92 ± 1.80 12.57 ± 2.30 5.01 ± 0.74 4.24 ± 0.88 4.20 ± 0.58 Friability
(%) 0.76 0.91 0.94 0.57 0.85 0.63 0.30 0.47 0.29 0.84 0.63
*DT (Hrs) 4.82 4.18 4.30 6.87 4.95 6.58 5.72 5.13 7.52 4.25 6.27
Dissolution
(%) 98.32 97.98 97.56 82.32 98.15 99.52 98.21 98.65 99.59 98.29 98.53 Assay (%) 98.76 97.25 98.05 98.37 97.82 98.87 98.79 98.24 98.39 96.51 97.27
1 Month Hardness (kg) 4.79 ± 0.61 4.15 ± 0.24 4.62 ± 0.94 5.36 ± 0.83 4.21 ± 0.78 5.55 ± 0.39 12.73 ± 1.75 12.49 ± 2.00
4.98 ± 0.83 4.20 ± 0.95 4.17 ± 0.62 Friability
(%) 0.77 0.91 0.94 0.68 0.9 0.65 0.38 0.54 0.35 0.87 0.69
*DT (Hrs) 4.78 4.04 4.25 6.82 4.78 6.51 5.64 5.03 7.18 4.03 5.93
Dissolution
(%) 97.64 97.56 97.19 81.97 97.88 99.07 97.79 97.55 98.41 96.16 97.54
Assay (%) 98.53 96.79 97.64 98.08 97.34 98.51 98.32 97.86 98.17 95.87 96.82
3 Month Hardness (kg) 4.76 ± 0.64 4.04 ± 0.73
4.58 ± 0.96 5.21 ± 0.88 4.13 ± 0.93 5.45 ± 0.86 12.45 ± 1.14 12.34 ± 2.20 4.96 ± 0.61
4.18 ± 0.56
4.02 ± 0.39 Friability
(%) 0.81 0.93 0.97 0.63 0.94 0.69 0.42 0.63 0.42 0.93 0.78
*DT (Hrs) 4.63 3.97 4.13 6.71 4.71 6.48 5.48 4.97 6.43 3.93 5.67
Dissolution
(%) 97.39 96.42 96.7 80.63 96.94 98.83 97.00 96.13 97.57 95.04 95.73
Assay (%) 97.96 96.24 97.11 97.64 96.82 98.16 97.87 97.02 97.4 95.29 95.99
6 Month
Hardness (kg)
4.68 ± 0.86 3.93 ± 0.65 4.53 ± 1.02 5.14 ± 0.93 4.01 ± 0.82 5.36 ± 0.54 12.30 ± 1.11 12.11 ± 1.64
4.83 ± 0.56 4.00 ± 0.98 3.79 ± 0.65 Friability
(%) 0.87 0.97 0.99 0.69 0.97 0.74 0.55 0.78 0.59 1.08 0.85
*DT (Hrs) 4.58 3.85 4.05 6.59 4.63 6.36 5.37 4.86 6.07 3.72 5.10
Dissolution
determination of theophylline matrix tablets prepared
with Kollidon SR, Carnauba wax and ethylcellulose.
Model independent method
Formulation K100M9 was considered as reference and f2 similarity test was performed for selected
formulations. Dissolution proile was found to be similar for K4M2, E10FP2 and KSR2 (Table V). Comparison of dissolution proiles of drug through similarity test (f2)
was used in other research studies for SR preparations (Dash et al., 2010; Shoaib et al., 2010; Salústio et al., 2011).
Response surface analysis
Response surface models of effect of HPMC K4M
and Avicel pH 101 are shown in Figure 5a, 5b and 5c. The
3D plots clearly showed that polymer had greater inluence
on response as compared to Avicel pH 101. Disintegration time increased drastically with an increase in polymer concentration while Avicel has lesser effect in enhancing
disintegration time as compare to HPMC K4M. Increase in HPMC K4M ratio in the formulation caused a steep
decrease in the release in 2 hours and Avicel seems to
produce not a very signiicant impact on matrix release.
FIGURE 5a - Response surface model (RSM) showing effect
of independent variables HPMC K4M and Avicel pH 101 on
Disintegration time.
FIGURE 5b - Response surface model (RSM) showing effect
of independent variables HPMC K4M and Avicel pH 101 on
responses Drug release in 2 hours.
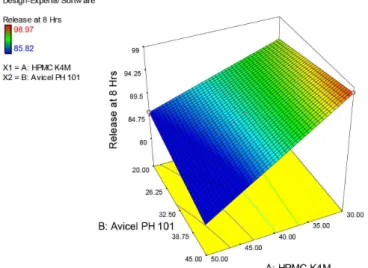
FIGURE 5c - Response surface model (RSM) showing effect of
independent variables HPMC K4M and Avicel pH 101 on Drug release in 8 hours.
FIGURE 6a - Response surface model (RSM) showing effect
of independent variables HPMC K100M and Avicel pH 101 on
FIGURE 6b - Response surface model (RSM) showing effect
of independent variables HPMC K100M and Avicel pH 101 on
Drug release in 2 hours.
FIGURE 6c - Response surface model (RSM) showing effect
of independent variables HPMC K100M and Avicel pH 101 on Drug release in 8 hours.
FIGURE 7a - Response surface model (RSM) showing effect of independent variables Ethocel 10FP and Avicel pH 101 on Disintegration time.
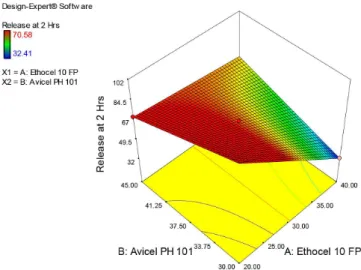
FIGURE 7b - Response surface model (RSM) showing effect of independent variables Ethocel 10FP and Avicel pH 101 on Drug release in 2 hours.
FIGURE 7c - Response surface model (RSM) showing effect of independent variables Ethocel 10FP and Avicel pH 101 on
Drug release in 8 hours.
At 8 hours, no prominent effect on release can be seen with HPMC K4M change and a near to linear response
found with change in Avicel pH101. Similar responses
were observed with HPMC K100M for disintegration time and release at 2 hours while release at 8 hours has been signiicantly inluenced with increase in HPMC K100M
as presented in Figure 6a, 6b and 6c. RSM for Ethocel
10FP effect on responses were shown in Figure 7. It can
be clearly seen that increase in concentration of polymer caused an increase in disintegration time and Avicel did
not produce any signiicant change in disintegration time
(Figure 7a, 7b and 7c). There was a declining response in
(ICH, 2003). Formulation K4M2, K4M3, K4M9,
K100M2, K100M3, K100M9, E10FP2, E10FP9, KSR2, KSR3 and KSR9 were evaluated for quality attribute, shelf life were calculated using software R-Gui version 2.15.2
(stab) and results were given in Table VI. It was found
that all formulations were within the acceptable limits for physical and chemical parameter but formulations K4M3 and KSR3 were failed for disintegration time and friability.
It was found that formulations K4M2, K100M2, K100M9
(highest shelf life: 30.347 months) and E10FP2 had the shelf life of more than 24 months and were considered as stable formulations.
CONCLUSION
Tizanidine hydrochloride formulations with controlled release characteristics were prepared by using
HPMC K4M and K100M, Ethocel 10FP and Kollidon SR. It was observed that the formulations with polymer
contents lesser than 40% remained ineffective in controlling the release of drug however, satisfactory
release proiles were obtained with HPMC K4M (K4M2)
50%, K100M (K100M9) 40%, Ethocel 10FP (E10FP2) 40% and Kollidon SR (KSR2) 55%. Formulation K100M9
with HPMC K100M showed highest shelf life of 30.347
months. Therefore, it can be concluded that controlled release tizanidine hydrochloride tablets can effectively be prepared by using these polymers through direct compression method. Moreover, formulation K100M9 was found to be the best formulation for controlled release tizanidine.
FIGURE 8a - Response surface model (RSM) showing effect of independent variables Kollidon SR and Avicel pH 101 on Disintegration time.
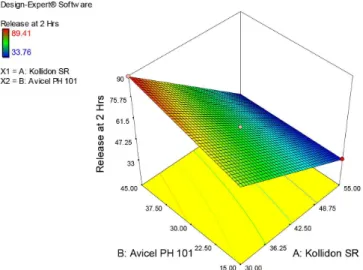
FIGURE 8b - Response surface model (RSM) showing effect of independent variables Kollidon SR and Avicel pH 101 on Drug release in 2 hours.
FIGURE 8c - Response surface model (RSM) showing effect of independent variables Kollidon SR and Avicel pH 101 on Drug
release in 8 hours.
in Ethocel 10FP proportion in the formulation (Figure 7b and 7c). Kollidon SR produced expected response of increase in disintegration time with increase in polymer concentration. An inverse relationship found between
Kollidon SR proportion and release at 2 and 8 hours (Figure 8b and 8c). Bose,Wong and Singh (2012) found
similar type of effect of HPMC K100M on Itopride SR
matrix tablet release.
Stability evaluation
The formulations showing disintegration time greater than 4 hours were subjected to accelerated stability
REFERENCES
AAMIR, M.N.; AHMAD, M. Production and stability
evaluation of modified-release microparticles for the delivery of drug combinations. AAPS PharmSciTech, v.11, n.1, p.351-355, 2010.
BARAKAT, N.S.; ELBAGORY, I.M.; ALMURSHEDI, A.S. Controlled-release carbamazepine matrix granules and
tablets comprising lipophilic and hydrophilic components.
Drug Deliv., v.16, n.1, p.57-65, 2009.
BAVISKAR, D.; SHARMA, R.; JAIN, D. Modulation of
drug release by utilizing pH-independent matrix system comprising water soluble drug verapamil hydrochloride.
Pak. J. Pharm. Sci., v.26, n.1, p.137, 2013.
BOSE, A.; WONG, T.W.; SINGH, N. Formulation development
and optimisation of sustained release matrix tablet of itopride hcl by response surface methodology and its evaluation of release kinetics. Saudi Pharm. J., v.21, n.2, p.201-213, 2012.
BOX, G.E.; HUNTER, J.S. Multi-factor experimental designs for exploring response surfaces. Ann. Math. Statist., v.28,
n.1, p.195-241, 1957.
BOX, G.E.; WILSON, K. On the experimental attainment of
optimum conditions. J. Roy. Stat. Soc. B-stat. Met., v.13, n.1, p.1-45, 1951.
BRAVO, S.A.; LAMAS, M.C.; SALOMON, C.J. Invitro studies
of diclofenac sodium controlled-release from biopolymeric hydrophilic matrices. J. Pharm. Pharm. Sci., v.5, n.3, p.213-219, 2002.
CAO, Q.R.; CHOI, Y.W.; CUI, J.H.; LEE, B.J. Formulation,
release characteristics and bioavailability of novel monolithic hydroxypropylmethylcellulose matrix tablets containing acetaminophen. J. Control. Release, v.108,
n.2-3, p.351-361, 2005.
CHIANG, W.D.; CHANG, S.W.; SHIEH, C.J. Studies on the
optimized lipase-catalyzed biosynthesis of cis-3-hexen-1-yl acetate in n-hexane. Process Biochem., v.38, n.8,
p.1193-1199, 2003.
COSTA, P.; SOUSA LOBO, J.M. Modeling and comparison of dissolution proiles. Eur. J. Pharm. Sci., v.13, n.2, p.123-133, 2001.
CROWLEY, M.M.; SCHROEDER, B.; FREDERSDORF, A.; OBARA, S.; TALARICO, M.; KUCERA, S.; MCGINITY,
J.W. Physicochemical properties and mechanism of drug release from ethyl cellulose matrix tablets prepared by direct compression and hot-melt extrusion. Int. J. Pharm., v.269, n.2, p.509-522, 2004.
DASH, S.; MURTHY, P.N.; NATH, L.; CHOWDHURY, P.
Kinetic modeling on drug release from controlled drug delivery systems. Acta Pol. Pharm., v.67, n.3, p.217-223, 2010.
DAVIES, P.N.J.M.N. Pharmaceutical powder compaction
technology. New York: Marcel Dekker, 1995. 358 p.
DRAGANOIU, E.; ANDHERIA, M.; SAKR, A. Evaluation
of the new polyvinylacetate/povidone excipient for matrix sustained release dosage forms. Pharmazeutische Industrie,
v.63, n.6, p.624-629, 2001.
DAVID, W.B. Pharmacokinetics: in modern pharmaceutics.
New York: MarcelDekker, 2002. v.4, p.66-91.
BAGORY, I.; BARAKAT, N.; IBRAHIM, M.A.;
EL-ENAZI, F. Formulation and in vitro evaluation of
theophylline matrix tablets prepared by direct compression: effect of polymer blends. Saudi Pharm. J., v.20, n.3,
p.229-238, 2012.
HAMSAVENI, D.; PRAPULLA, S.; DIVAKAR, S. Response
surface methodological approach for the synthesis of isobutyl isobutyrate. Process Biochem., v.36, n.11, p.1103-1109, 2001.
HAO, J.; WANG, F.; WANG, X.; ZHANG, D.; BI, Y.; GAO,
Y.; ZHAO, X.; ZHANG, Q. Development and optimization of baicalin-loaded solid lipid nanoparticles prepared by coacervation method using central composite design. Eur. J. Pharm. Sci., v.47, n.2, p.497-505, 2012.
HIGUCHI, T. Mechanism of sustained-action medication.
Theoretical analysis of rate of release of solid drugs dispersed in solid matrices. J. Pharm. Sci., v.52, n.12, p.1145-1149, 1963.
HIXSON, A.; CROWELL, J. Dependence of reaction velocity
upon surface and agitation. Ind. Eng. Chem., v.23, n.8,
HOLMAN, L.; LEUENBERGER, H. The relationship between solid fraction and mechanical properties of compacts—the percolation theory model approach. Int. J. Pharm., v.46,
n.1, p.35-44, 1988.
HUANG, Y.B.; TSAI, Y.H.; YANG, W.C.; CHANG, J.S.; WU, P.C. Optimization of sustained-release propranolol
dosage form using factorial design and response surface methodology. Biol. Pharm. Bull., v.27, n.10, p.1626-1629, 2004.
INTERNATIONAL CONFERENCE ON HARMONISATION.
Harmonised Tripartite Guideline. Q1A (R2)–stability
testing of new drug substances and products. ICH, 2003. Available at: http://www.ich.org/ileadmin/Public_Web_ Site/ICH_Products/Guidelines/Quality/Q1A_R2/Step4/ Q1A_R2__Guideline.pdf. Accessed on: Mar. 2013
JAN, S.U.; KHAN, G.M.; KHAN, K.A.; REHMAN, A.; KHAN, H. In vitro release pattern of Ketoprofen using ethyl cellulose ether derivatives. J. App. Pharm, v.1, n.3,
p.149-158, 2011.
KOLTER, K. Compression behaviour of kollidon SR. Proc.4th
World meeting on Pharm. Biol. Pharm. Pharm. Technol,
2002. p.119-120.
KORSMEYER, R.W.; GURNY, R.; DOELKER, E.; BURI, P.;
PEPPAS, N.A. Mechanisms of solute release from porous hydrophilic polymers. Int J. Pharm, v.15, n.1, p.25-35,
1983.
KULKARNI, G.S.; BABU, P.S. Design and evaluation of
tizanidine buccal mucoadhesive patches. J. Appl. Pharm. Sci., v.2, n.4, p.74-81, 2012.
LIYANA-PATHIRANA, C.; SHAHIDI, F. Optimization of
extraction of phenolic compounds from wheat using
response surface methodology. Food Chem., v.93, n.1,
p.47-56, 2005.
MEYTHALER, J.M.; GUIN-RENFROE, S.; JOHNSON, A.;
BRUNNER, R.M. Prospective assessment of tizanidine for spasticity due to acquired brain injury. Arch. Phys. Med. Rehabil.,v.82, n.9, p.1155-1163, 2001.
MOFFAT, A.C.; OSSELTON, D.M.; WIDDOP, B. Clarke’s
analysis of drugs and poisons: in pharmaceuticals, body fluids, and postmortem material. 4th ed. Pharmaceutical
Press, 2011. p.2161-2162.
NERURKAR, J.; JUN, H.; PRICE, J.; PARK, M.
Controlled-release matrix tablets of ibuprofen using cellulose ethers and carrageenans: effect of formulation factors on dissolution rates. Eur. J. Pharm. Biopharm., v.61, n.1, p.56-68, 2005.
PEPPAS, N. Analysis of ickian and non-ickian drug release
from polymers. Pharm. Acta Helv., v.60, n.4, p.110, 1985.
POLLI, J.E.; REKHI, G.S.; AUGSBURGER, L.L.; SHAH, V.P. Methods to compare dissolution proiles and a rationale for wide dissolution speciications for metoprolol tartrate
tablets. J. Pharm. Sci., v.86, n.6, p.690-700, 1997.
QUADIR, M.A.; CHANDA, E.; HAIDER, S.S.; REZA, M.S.;
DATTA, B.K. Evaluation of ethylcellulose ss matrices for controled release drug delivery. Pak. J. Pharm. Sci., v.18,
n.2, p.29-34, 2005.
REZA, M.S.; QUADIR, M.A.; HAIDER, S.S. Comparative
evaluation of plastic, hydrophobic and hydrophilic polymers as matrices for controlled-release drug delivery.
J. Pharm. Pharm. Sci., v.6, n.2, p.282-91, 2003.
RONI, M.A.; KIBRIA, G.; JALIL, R.U. In vitro studies of
controlled release alfuzosin matrix tablets prepared with ethylcellulose and hydroxypropyl methylcellulose. Iran J. Pharm. Sci., v.5, n.2, p.59-68, 2009.
SAHOO, J.; MURTHY, P.; BISWAL, S.; SAHOO, S.; MAHAPATRA, A. Comparative study of propranolol
hydrochloride release from matrix tablets with Kollidon® SR
or hydroxy propyl methyl cellulose. AAPS PharmSciTech,
v.9, n.2, p.577-582, 2008.
SALÚSTIO, P.; CABRAL-MARQUES, H.; COSTA, P.; PINTO, J. Comparison of ibuprofen release from minitablets and capsules containing ibuprofen:<i>β</i>-Cyclodextrin
complex. Eur. J. Pharm. Biopharm., v.78, n.1, p.58-66,
2011.
SANKALIA, J.M.; SANKALIA, M.G.; MASHRU, R.C.
Drug release and swelling kinetics of directly compressed glipizide sustained-release matrices: establishment of level
A IVIVC. J. Control. Release, v.129, n.1, p.49-58, 2008.
SAPER, J.R.; LAKE, A.E.; CANTRELL, D.T.; WINNER, P.K.; WHITE, J.R. Chronic daily headache prophylaxis with
SAVAŞER, A.; ÖZKAN, Y.; IŞMER, A. Preparation and in vitro evaluation of sustained release tablet formulations of diclofenac sodium. Farmaco, v.60, n.2, p.171-177, 2005.
SHANKER, G.; KUMAR, C.K.; GONUGUNTA, C.S.R.;
KUMAR, B.V.; VEERAREDDY, P.R. Formulation and evaluation of bioadhesive buccal drug delivery of tizanidine hydrochloride tablets. AAPS Pharmscitech, v.10, n.2, p.530-539, 2009.
SHAO, Z.J.; FAROOQI, M.I.; DIAZ, S.; KRISHNA, A.K.;
MUHAMMAD, N.A. Effects of formulation variables and post-compression curing on drug release from a new sustained-release matrix material: polyvinylacetate-povidone. Pharm. Dev. Technol., v.6, n.2, p.247-254, 2001.
SHOAIB, M.H.; SIDDIQI, S.A.S.; YOUSUF, R.I.; ZAHEER, K.; HANIF, M.; REHANA, S.; JABEEN, S. Development
and evaluation of hydrophilic colloid matrix of famotidine tablets. AAPS Pharmscitech, v.11, n.2, p.708-718, 2010.
SIDDIQUI, A.; NAZZAL, S. Measurement of surface color as an expedient QC method for the detection of deviations
in tablet hardness. Int. J. Pharm., v.341, n.1-2, p.173-180,
2007.
SIEPMANN, J.; STREUBEL, A.; PEPPAS, N. Understanding
and predicting drug delivery from hydrophilic matrix tablets using the “sequential layer” model. Pharm. Res., v.19, n.3, p.306-314, 2002.
STRÜBING, S.; METZ, H.; MÄDER, K. Characterization of poly (vinyl acetate) based loating matrix tablets. J. Control. Release,v.126, n.2, p.149-155, 2008.
SWEETMAN, S.C. Martindale: the complete drug reference.
36th ed.London: Pharmaceutical Press, 2009. 1899 p.
THE UNITED STATES PHARMACOPEIAL CONVENTION.
USP35-NF30. USA: The United States Pharmacopeial
Convention, 2012. Accessed on: Dec. 2012.
VICENTE, G.; COTERON, A.; MARTINEZ, M.; ARACIL,
J. Application of the factorial design of experiments and response surface methodology to optimize biodiesel production. Ind. Crops Prod., v.8, n.1, p.29-35, 1998.
WAGSTAFF, A.; BRYSON, H. Tizanidine: a review of its pharmacology clinical efficacy and tolerability in the management of spasticity associated with cerebral and spinal disorders. Drugs, v.53, n.3, p.435-452, 1997.
WILSON, C.G.; CROWLEY, P.J. Controlled release in oral
drug delivery. Springer: New York, 2011. p.1-26.
XIONG, Y.; GUO, D.; WANG, L.; ZHENG, X.; ZHANG, Y.; CHEN, J. Development of nobiliside a loaded liposomal
formulation using response surface methodology. Int. J. Pharm., v.371, n.1, p.197-203, 2009.
ZHANG, X.; LIU, J.; QIAO, H.; LIU, H.; NI, J.; ZHANG, W.; SHI, Y. Formulation optimization of dihydroartemisinin
nanostructured lipid carrier using response surface methodology. Powder Technol., v.197, n.1, p.120-128,
2010a.
ZHANG, Y.; HUO, M.; ZHOU, J.; ZOU, A.; LI, W.; YAO, C.; XIE, S. DDSolver: an add-in program for modeling and comparison of drug dissolution proiles. AAPS J., v.12, n.3, p.263-271, 2010b.
ZHANG, Z.S.; LI, D.; WANG, L.J.; OZKAN, N.; CHEN, X.D.;
MAO, Z.H.; YANG, H.Z. Optimization of ethanol–water
extraction of lignans from laxseed. Sep. Purif. Technol.,
v.57, n.1, p.17-24, 2007.
Received for publication on 22nd July 2013