CONCENTRATION DEPENDENT DIFFUSION IN BUILDING MATERIALS –
APPLICATION OF DIFFERENT METHODS
Nuno RAMOS*, João DELGADO and Vasco FREITAS
LFC − Laboratório de Física das Construções, Departamento de Engenharia Civil Faculdade de Engenharia da Universidade do Porto,
Rua Dr. Roberto Frias s/n, 4200-465 Porto, Portugal
*Corresponding author. Fax: +351 225 081 449; Email: [email protected] Abstract
Moisture is one of the most deteriorating factors of buildings. Environmental factors, such as air temperature and air humidity affected moisture content. In this experimental work, the measurements of water vapour diffusion coefficients of three different types of building materials commonly used in Portugal (gypsum plasterboard, gypsum plaster and plaster) were obtained and they were carried out for a range of the relevant parameters, as temperature and relative humidity.
The results obtained were in good agreement with the values found in literature and show that the increase in temperature resulted in an increase in molecular diffusion coefficient and an increased in relative humidity (54% to 69%) resulted in a decreased in Dw. Finally, a good agreement with literature values was found.
Keywords: Concentration Dependent Diffusion, Mass Transfer, Porous Media, Building Materials.
1 Introduction
The life of building structures is dependent on moisture performance of the porous materials. The specification of any porous building material with respect to moisture performance requires the knowledge of some properties as molecular diffusion coefficients, one of the most commonly defined parameters to characterize the moisture transport through any building materials.
The transport coefficient of water vapour is necessary to determine the moisture processes and to identify the moisture gradients that are formed within structural elements concerned in result of the exchange of moisture with the environment.
The aim of this work is determined effective molecular diffusion coefficients, D , on the basis w
of non-stationary absorption processes. In this study the influence of temperature and relative humidity on the D through building materials w
has been investigated.
Three commonly used building materials are considered in the study: gypsum plasterboard, gypsum plaster and plaster (50% gypsum and 50% lime). In these work an option was made in using specimens of common materials used in Portugal
gypsum materials are one of the most important building materials used in Portugal construction sector. These materials are continuously exposed to smaller or larger changes in outdoor and indoor climate. The relative humidity change are presented during the night and day or related to the activities of the residents, respectively.
2 Theory
In an absorption run of the single-sided experiment, the sample of thickness L initially contains moisture concentration Ci. At a time
0
=
t , the surface concentration is increased to a maximum value Ceq and held at that value for the experiment. This gives for the boundary conditions: 0 = t 0< x<∞ C=Ci (1a) 0 > t x=0 C=Ceq (1b) 0 > t x→∞ C=Ci (1c) For a diffusion coefficient, Dw, independent of penetrate concentration, the equation for the variation of mass uptake with time for this
− = − − t D x erf C C C C w i eq i 2 1 (2)
Integrating in respect of t the rate of the penetration of sample face unit area (x=0) by water vapour, the total amount of diffusing substance in time t is obtained,
∞ = ∞ + − + − = ∆ ∆ 0 2 2 2 w 2 2 ) 1 2 ( exp ) 1 2 ( 1 8 1 n t L t n D n m m π π (3)
According some researchers (Crank, Künzel and Kiessl and Garbalinska [1-3]) the changes in mass during the initial part of sorption processes,
5 . 0 /∆ < ∆mt m∞ , is given by π t D L m mt = 4 w ∆ ∆ ∞ (4)
Make a derivation of ∆mt /∆m∞ in respect to
t, the following equation is obtained
2 2 2 w 16 ∆ ∆ = ∞ d t m d m L D π t (7)
where the slope of the line designed by
t d m
d∆ t / makes it possible to calculate D in w
the initial state of the process of absorption. For the final part of the sorption,
0 . 1 / 4 .
0 <∆mt ∆m∞ < , the changes in mass is
given by (Garbalinska [4]) ∆ ∆ − = ∞) / 1 ( 8 ln t 2 2 2 w m m t L D π π (8)
As shown Künzel and Kiessl [2] the mass changes in the initial phase of sorption are proportional to the square root of time (see Eq. 4). Introducing the so-called half-time t1/2, corresponding to the time to reach 50% of equilibrium water vapour content (∆mt =0.5∆m∞), Eq. 4 can be given as follows,
π1/2 w 4 2 1 D t L = (9)
and after rearranging result in
2 / 1 2 w 64 t L D = π (10)
A practical application of these methods to
evaluate D of different building materials w in
some humidity ranges will be discussed in Results section.
3 Experimental setup
In these tests, several specimens of building materials are submitted to transient conditions of relative humidity, at two different temperatures (15ºC and 23ºC). These experiments simulate the cyclic variations in moisture loads and relative humidity levels that can be found in bedrooms, for instance, where during the night, there will be an increase in relative humidity due to vapour production by the occupants.
To perform these experiments, a climatic chamber was used (see Figure 1) to subject the specimens to simulated climatic conditions over extended periods of time; namely the control of temperature and relative humidity. Both the relative humidity and the temperature of the chamber can be independently controlled to constant values or to cycles of change. The transition from low to high relative humidity values inside the chamber can be achieved after thirty minutes and the opposite movement will be attained in one hour. A precision balance was located inside the climatic chamber and the mass change registered continuously by a personal computer.
The experiments were performed with gypsum plasterboard (ρ=730 kg/m3, L=12.5 mm, A=0.0484 m2), gypsum plaster (ρ=1200 kg/m3, L=20 mm, A=0.0441 m2) and plaster-50% gypsum and 50% lime (ρ=1340 kg/m3, L=10 mm, A=0.0441 m2). The samples are sealing around the edges, leaving one open surface.
The specimens were stabilized inside a climate chamber at constant temperature and relative humidity. Each specimen was tested for a few days period with a square wave of relative humidity with step cycles of 8 hours with high RH
low RH value (33% or 48% RH), and a constant temperature. The tests were run until the cyclic behaviour of the specimen was stable, that is, when the cycles fully repeated themselves. However, it is important to enhance that for our experiments of measurement of water vapour permeability only the first 8 hours, initial cycle of adsorption, are considered.
Climatic chamber precision balance specimen t (s) RH (%) t (s) ∆ ∆∆ ∆w (g/m2)
Input signal Output signal
Change of RH Change of mass/area
Personal computer (data logger)
Input signal Output signal
Specimen RH (%) Precision balance Personal computer (data logger) ∆m/A (g/m2) t (s) t (s) Climatic chamber (a) 20 30 40 50 60 70 80 0 20 40 60 80 100 120 t (h) R H (% ) RH cycle-theoretical RH cycle-Real (b)
Figure 1 – (a)-Sketch of experimental set-up; (b)-Example of step cycle of relative humidity
theoretical vs. real cycle.
4 Results and Discussion
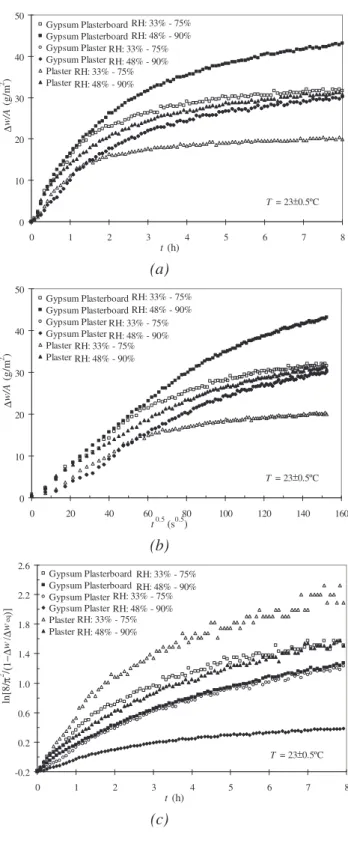
The series of tests performed on the specimens meant to analyze the response in terms of water vapour content variation. Figure 2(a) shows the mass variation observed in three different materials, for two different RH ranges.
Experimental values of D were calculated w
using Eqs. 7, 8 and 10 and listed in Table 1, at two different temperatures (15ºC and 23ºC) and for 54% and 69% of RH. The application of t method to determine Dw is presented in Figure 2(b), as example, with d∆mt /d t determined by fitting the proposed equation to the experimental data points, minimizing the following standard deviation. The measurement of Dw values using the logarithmic method, as given by Eq. 8, is
shown in Figure 2(c). The stage of processing the results of the half-time method, Eq. 10, is relatively less time consuming and the evaluation
of Dw only required the identification of time
2 / 1 t . 0 10 20 30 40 50 0 1 2 3 4 5 6 7 8 t (h) w /A (g /m 2 ) Gypsum Plasterboard Gypsum Plasterboard Gypsum Plaster Gypsum Plaster Plaster Plaster T = 23±0.5ºC RH: 33% - 75% RH: 48% - 90% RH: 33% - 75% RH: 48% - 90% RH: 33% - 75% RH: 48% - 90% (a) 0 10 20 30 40 50 0 20 40 60 80 100 120 140 160 t0.5 (s0.5) w /A (g /m 2 ) Gypsum Plasterboard Gypsum Plasterboard Gypsum Plaster Gypsum Plaster Plaster Plaster T = 23±0.5ºC RH: 33% - 75% RH: 48% - 90% RH: 33% - 75% RH: 48% - 90% RH: 33% - 75% RH: 48% - 90% (b) -0.2 0.2 0.6 1.0 1.4 1.8 2.2 2.6 0 1 2 3 4 5 6 7 8 t (h) ln [8 /π 2/ w weq Gypsum Plasterboard Gypsum Plasterboard Gypsum Plaster Gypsum Plaster Plaster Plaster T = 23±0.5ºC RH: 33% - 75% RH: 48% - 90% RH: 33% - 75% RH: 48% - 90% RH: 33% - 75% RH: 48% - 90% (c)
0 5 10 15 20 25 30 0 20 40 60 80 100 RH (%) D w .1 0 -9 (m 2 /s ) Gypsum Plasterboard Gypsum Plaster Plaster T = 23±0.3ºC (d)
Figure 2 – Example of (a) – experimental mass
variation; (b) – dependence of ∆mt/A= f( t)
and (c) – dependence of
[
8/ /(1 / )]
( )ln π2 −∆mt ∆m∞ = f t . (d) – Mass diffusivity vs. relative humidity, at T =23ºC.
In order to investigate the accuracy of the different methods presents in Theory section for the evaluation of effective molecular diffusion coefficient with concentration dependent, the
authors were determined the water vapour
permeability, δP, in accordance to prEN ISO 12572 [6]. The wet-cup and dry-cup tests were carried out. The relative humidity inside the cup was 94±0.3% (saturated solution of KNO3) for
wet-cup and lesser than 1% (saturated solution of CaCl2) for dry-cup measurements.
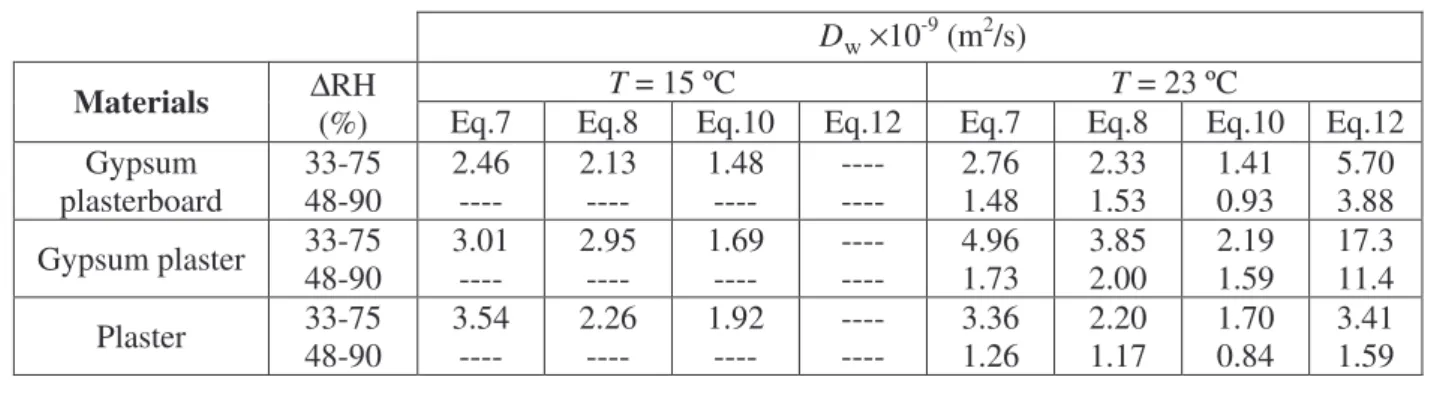
Table 1 –Experimental values of D obtained at different temperatures and humidity ranges. w
w
D ×10-9 (m2/s)
T = 15 ºC T = 23 ºC
Materials ∆RH (%) Eq.7 Eq.8 Eq.10 Eq.12 Eq.7 Eq.8 Eq.10 Eq.12 Gypsum
plasterboard 33-75 48-90 2.46---- 2.13---- 1.48---- ---- ---- 2.761.48 2.331.53 1.410.93 5.70 3.88 Gypsum plaster 33-75 48-90 3.01---- 2.95---- 1.69---- ---- ---- 4.961.73 3.852.00 2.191.59 17.3 11.4 Plaster 33-75 48-90 3.54---- 2.26---- 1.92---- ---- ---- 3.361.26 2.201.17 1.700.84 3.41 1.59 In order to establish the most appropriate
form for the δp
( )
φ function, a methodological study has been conducted using different permeability equations. The regressions are carried out using the Levenberg-Marquardt method, using SPSS 14.0 program. The permeability equation proposed by Galbraith [7]( )
1 2 3p φ A A φA
δ = + ⋅ (11)
was used with the following empirical constants,
3 2
1 ,A ,A
A . Another important variable
determined was moisture storage capacity, ξ , as
a slope of the sorption isotherm. Based in fact that δp, determined by the steady-state cup measurements, can be related to the average moisture diffusivity, under the assumption of immediate equilibrium and Fick’s law, as
ρξ
δ s
w
P
D = p (12) where Ps is the saturation vapour pressure and
ρ is the dry density of solid material.
The results obtained with the cup method are presented in Figure 2(d). The curves are based on the average values and it is possible to observe that Dw is dependent on the prevailing
RH.
The analysis of data given in Table 1 shows that the t method and logarithmic method were quite compatible, and the results there from
differed by a few or more then 15%. The
half-time method proved to be quite different from the two other methods, with lesser accuracy.
Also, the results listed in Table 1 shows that the increase in temperature resulted in an increase in D . Temperature is then regarded as w
the diffusion flow within a porous material that has its thermodynamic reasons.
The results obtained with t and logarithmic methods are in accordance with the experimental data referred by other authors, with
) (Eq.7or8 / ) 1 (Eq.1 w w D D between 1.0 and 6.6.
For example, some investigators showed that
w
D from cup measurements was much higher
than Dw from the dynamic measurements
((Dw)cup/(Dw)dynamic ≈4): 2 folds for cellular
concrete, 40 folds for cellulose insulation and between 1.5-11 folds for wood (see Time, [8]). 5 Conclusions
This work concerns the use of non-stationary measurement techniques for defining the molecular diffusivity of building materials,
using three different procedures: t -type
calculation; logarithmic; and half-time methods.
The results analyse shows that the half-time method proved to be quite different from the two
other methods, which were quite compatible.
The influence of the temperature and relative humidity range on the estimation of the diffusion coefficient cannot be neglected. The measurements showed purely unique tendency of the D growth along with temperature. w
Acknowledgment
This study was financially supported by FCT and project POCTI/ECM/57722/2004.
J.M.P.Q. Delgado wishes to thank Fundação para a Ciência e a Tecnologia for the Grant Nº SFRH/BPD/11639/2002.
Nomenclature
A Sample face area
3 2
1,A ,A
A Empirical constants of Eq. 11
C Moisture concentration
i
C Initial moisture concentration
eq
C Equilibrium moisture concentration
w
D Molecular diffusion coefficient
L Sample thickness
m Sample mass
t
m
∆ Total amount in time t
∞
∆m Total amount after infinite time
Ps Saturation vapour pressure
RH ∆ Relative humidity t Time 2 / 1
t Time to reach 50% of equilibrium water vapour content
T Temperature
x Axial-coordinate
p
δ Water vapour permeability
φ
Relative humidity,ρ
Densityξ Moisture storage capacity References
[1] J. Crank: The mathematics of diffusion (Oxford Science, New York, 1975).
[2] H.M. Künzel and K Kiessl: Bestimmung
des Wasserdampfdiffusionswiderstandes von
mineralischen Baustoffen aus
Sorptionsversuchen (Bauphysik 12, 1990). [3] H. Garbalinska: International Journal of Heat and Mass Transfer Vol. 45 (2002), pp. 1353
[4] H. Garbalinska: Heat and Mass Transfer Vol. 40 (2004), pp. 963
[5] L. Greenspan: Journal of Research of the National Bureau of Standards-A Vol. 81 (1977), pp. 89
[6] prEN ISO 12572: Hygrothermal performance of building materials and products - Determination of water vapour transmission
properties (European Committee for
Standardization, Brussels, Belgium, 2001). [7] G.H. Galbraith, R.C. McLeanb, K. Guo and D. Kelly: Indoor Built Environment Vol. 7 (1998), pp. 216
[8] B. Time: Hygroscopic Moisture Transport
in Wood (PhD thesis, Department of Building and Construction Engineering, Norwegian University of Science and Technology, 1998).