UNIVERSIDADE DE LISBOA
FACULDADE DE CIÊNCIAS
DEPARTAMENTO DE BIOLOGIA VEGETAL
Optimization of high added-value pigments production by
Gordonia alkanivorans strain 1B
Mestrado em Biologia Molecular e Genética
Ana Sofia Freitas Fernandes
Dissertação orientada por:
Doutor Luís Alves
Professora Doutora Ana Reis
2016
I
Optimization of high added-value pigments production by
Gordonia alkanivorans strain 1B
Ana Sofia Freitas Fernandes
2016
This thesis was fully performed at the Department of Bioenergy of Laboratório Nacional de
Energia e Geologia (LNEG) under the direct supervision of Dr. Luís Alves in the scope of the
Master in Molecular Biology and Genetics of the Faculty of Sciences of the University of
Lisbon.
Prof. Dr. Ana Reis was the internal designated supervisor in the scope of the Master
in Molecular Biology and Genetics of the Faculty of Sciences of the University of Lisbon
II “It's not about money... it's about sending a message.”
III
INDEX
AGRADECIMENTOS ... V ABSTRACT ... VII RESUMO ... IX LIST OF FIGURES ... XII LIST OF TABLES ... XIII ABREVIATION LIST ... XIV
1 - INTRODUCTION ... 1
1.1 - Sulfur problematic and the need for fossil fuels desulfurization ... 1
1.2 - Gordonia alkanivorans strain 1B ... 2
1.3 - Carotenoids ... 3
1.3.1– Functions and applications ... 3
1.3.2- Production ... 4
1.3.3- Conditions for carotenoids production ... 5
1.3.3.1- Gordonia genus carotenoids production ... 6
1.4 - Scope of the Thesis ... 6
2 – MATERIALS AND METHODS ... 7
2.1 - Chemicals and Reagents ... 7
2.2- Microorganism and Culture Media ... 7
2.3- Experimental Design Methodology ... 8
2.4 - Carotenoids Extraction ... 8
2.5 - Analytical Methods ... 9
2.5.1 - Optical Density and Dry Cell Weight ... 9
2.5.2- Sugar Consumption Evaluation ... 9
2.5.3- Flow Cytometry Analysis for Cell Physiological Evaluation ... 9
2.5.4- Pigments Analysis ... 10
2.6- Determination of Antioxidant Activity ... 10
2.7- Determination of Antimicrobial Activity ... 11
IV
3.1- Experimental Designs ... 11
3.1.1 – ED1 (L0) ... 12
3.1.2 – ED2 (L400) ... 15
3.1.3 – Analysis of ED Factors ... 18
3.1.4 – Comparison between ED1 and ED2 ... 19
3.2 - Influence of time ... 21
3.2.1 - Metabolic parameters ... 21
3.2.2 - Carotenoids analysis ... 22
3.2.3 - Evaluation of cell physiological state by flow cytometry ... 26
3.2.4 - Antioxidant activity ... 27 3.2.5 - Antimicrobial activity ... 28 4 – CONCLUSION ... 28 5 – FUTURE WORKS ... 30 6 - BIBLIOGRAPHY ... 30 7 – APPENDIXES ... 35
V
AGRADECIMENTOS
Queria agradecer a todos que me ajudaram e tornaram possível fazer este trabalho, direta ou indiretamente.
Ao Doutor Luís Alves e à Doutora Susana Paixão Alves por terem aceitado ser meus orientadores e por me terem ajudado nestes três anos de trabalho. Queria agradecer o vosso apoio ao longo de todo este tempo, compreensão, paciência e preocupação, principalmente em todas as vezes que fiquei doente e não pude ir trabalhar.
À Professora Doutora Ana Reis, por ter aceite ser minha coorientadora, pelos seus conselhos, disponibilidade e compreensão, um muito obrigado.
Ao Doutor José Carlos Roseiro pela ajuda no desenvolvimento do planeamento experimental. À Dra. Margarida Monteiro a ajuda na manutenção do microrganismo utilizado e no esclarecimento de todas as dúvidas relativas a meios de cultura e à Dra. Céu Penedo pela ajuda e por me ensinar a usar o rota-vapor.
Aos colegas, funcionários e investigadores do Laboratório Nacional de Energia e Geologia (LNEG). Às minhas colegas Dra. Patrícia Branco e Doutora Maria José, obrigada pela amizade, companhia e apoio durante todo este tempo. À Dra. Diana Francisco por ser tão sincera e descontraída e conseguir me contagiar com essa disposição. Ao Doutor Tiago Lopes por ser tão competitivo em todos os jogos que partilhamos e ser assim a pessoa divertida que é.
Um muito obrigado, muito especial à Engenheira Joana Ortigueira e Dra. Marta Pacheco, por todos estes anos de amizade e cumplicidade. Sem vocês eu não teria conseguido. Por todos os almoços, cafés, jantares juntas que me proporcionaram todo um conjunto de memórias felizes que guardarei por muito tempo. E por me aturarem em todos os meus momentos de rabugice. Ao Engenheiro Diogo Sebastião por me ter proporcionado muitos momentos divertidos, mas também por, nos momentos em que estava preguiçosa, apelar à minha consciência para me pôr a trabalhar.
Um agradecimento muito especial ao Dr. Tiago Silva, que foi quase um segundo orientador e que me ajudou ao longo de todo o meu trabalho, incansavelmente. Obrigada por todas as sugestões, todas as discussões e todos os momentos divertidos que partilhámos a trabalhar juntos. Foi quase um irmão, um muito obrigado do fundo do coração.
Aos meninos que ganharam um cantinho no meu coração Dr. Bruno Arez, por ser como um irmão mais velho e por todos os conselhos e apoio e ao Engenheiro Vasco Martins muito obrigada pela vossa amizade e apoio.
À minha querida amiga Dra. Catarina Ferreira, por me arrancar de casa nem que fosse por minutos e por me apoiar sempre que precisei. Obrigada por seres a pessoa distraída que és e ao mesmo tempo a pessoa mais atenciosa e carinhosa de sempre.
VI Muito obrigada ao Rui Capela, à futura Sra. Enfermeira Ana Vieira e futuro Sr. Engenheiro Miguel Pedro, por todo o apoio e por proporcionarem muitos momentos divertidos ao ponto de me deixarem em lágrimas.
Um agradecimento especial há minha família por todo o apoio nesta fase da minha vida académica. E um agradecimento especial à minha querida avó Anicas que sempre me apoiou e me obrigou a alimentar como deve de ser, ao afirmar, sempre que a visitava, que estava mais magra.
Por fim e mais importante, queria agradecer aos meus pais pelo apoio incondicional durante todo este tempo. Pela compreensão de estar a prolongar a tese por mais um ano. Ao meu pai, por ter a capacidade incrível de sempre que estava stressada me conseguir pôr a rir com as suas parvoíces. À minha mãe, por, mesmo depois de muitas adversidades, estar sempre ao meu lado. Muito obrigada aos dois por me ajudarem sempre que precisei e por nunca deixarem que me faltasse nada do que precisei.
***
Este trabalho foi financiado por fundos da FEDER, através da POFC-COMPETE e por fundos nacionais através da FCT (Fundação para a Ciência e Tecnologia) no âmbito do projeto Carbon4Desulf – FCOMP-01-0124-FEDER-013932 (Ex-PTDC/AAC-AMB/112841/2009). Um agradecimento muito especial à Doutora Susana Paixão Alves por ter coorientado o trabalho científico desenvolvido na Unidade de Bioenergia do LNEG.
VII
ABSTRACT
The actinomycetes of the genus Gordonia have been continually gaining interest, mainly due to their ability to degrade a variety of xenobiotics, environmental pollutants between others. They also have the capacity of synthesising organic compounds with commercial interest such as carotenoids. Carotenoids are high added-value compounds, due to their wide application especially as colorants, food additives and also, considering some of their characteristics (antioxidant activity, scavenging, photoprotection, between others), they can be used as bioactive products in nutraceutical. Hence, the increasing interest on these valuable bioactive molecules has led to the search of alternatives, more cost-effective and with higher yields, towards their industrial production. In fact, microbial metabolism offers a promising option for pigments production. Herein, Gordonia alkanivorans strain 1B, a known desulfurizing bacterium, is exploited as a high carotenoid-producer microorganism.
The main goal of this work was the optimization of the carotenoids production conditions with further identification of the main type of carotenoids present. In this context, two parallel experimental designs (EDs) were carried out, one in the absence of light (ED1 – L0) and the other at approximately 400 lux light (ED2 – L400), to demonstrate the importance of light factor into carotenoids production even in the same growth conditions of C-source and S-source. Therefore, following the Doehlert distribution based surface response methodology, it was evaluated in both EDs the influence of two factors: % of glucose in a mixture glucose + fructose (0-100% glu in 10 g.L-1), and sulfate concentration (7-37 mg.L-1), for two responses assessed (biomass, total carotenoids). Moreover, two different times were studied to evaluate a possible influence of time: 72 and 216 h. Based on the different response surfaces obtained in both EDs, the best combination for carotenoids production by strain 1B was: 100% glucose and a sulfate concentration higher than 22 mg.L-1 in the presence of light for 216 h. Results demonstrated that light, time period, glucose and sulfate content in the culture medium, played an important role towards the highest carotenoids production by strain 1B.
Next, the influence of time was studied in more detail, as well as, the influence of light performing an assay without light, with 400 lux and with photoperiod with a basal value of 3000 lux. In terms of growth, the culture with 400 lux had a higher growth rate than the others. The cultures with light had higher biomass (4.2 g.L-1 instead of 3.5 g.L-1). The highest value of carotenoid production described so
far by G. alkanivorans strain 1B was achieved with this assay, reaching a value of 1608.6 µg (2596 µg.gDCW-1) in the culture with 400 lux and 21 days of growth. Higher light exposure or lower than
the previous resulted in lower yields of carotenoids. An attempt to identify the type of carotenoids present was performed through further HPLC analysis of the different extracts. Only astaxanthin and lutein were identified, and these two pigments corresponded only to a percentage of 37 - 52% of the
VIII total carotenoids extracted. This set of assays showed that carotenoid production increased through time in all light conditions, and as so, this is an important factor for this production. A supplementary assay using a stable value of 3000 lux without photoperiod was performed and resulted in the highest yield obtained so far, 0.31%, by a Gordonia species.
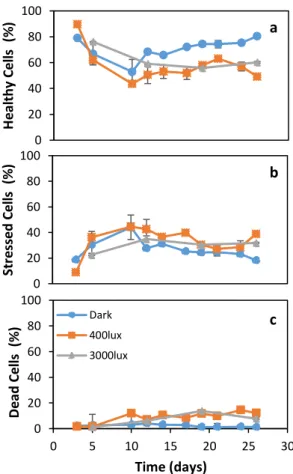
An evaluation of the cells physiology was made through flow cytometry analysis, considering that there is a set of studies describing the association between stress and carotenoid production. The results showed that the highest carotenoid producers (400 lux and 3000-7000 lux) were the ones with an overall higher population of stressed/dead cells (stressed:39-32% and dead: 8-12%), conversely, without light the healthy population was higher (81% instead of 49-60%), confirming this way the association between stress and carotenoid enhancement.
Lastly, considering the described properties of carotenoids, antioxidant and antimicrobial assays were performed. The antimicrobial activity showed no positive results. On the other hand, in the antioxidant
activity assay, the extract with higher activity (culture without light) achieved 3.4% of DPPH• (2,2-difenil-1-picril-hidrazilo) discoloration while the standard with similar concentration only had
1.8% of discoloration. Further testing should be performed using the purified pigments, since that in a crude extract other extractives may be present than pigments that can influence (positive or negatively) the overall properties of any bioactive compound present.
In conclusion, these promising results point out for the exploitation of G. alkanivorans strain 1B as a possible hyper pigment-producer microorganism that may be applied towards different industries, since carotenoids are valuable bioactive molecules for chemical, pharmaceutical, food and cosmetic sectors. Additionally, since strain 1B is known by its great potential to desulfurize fossil fuels, the simultaneous exploitation of this high added value product produced by this microorganism may benefit a future scale-up of BDS, aiming to its further application downstream of a petroleum refinery towards ultra-low sulfur fuels, turning the overall BDS process more cost-effective.
Keywords: Gordonia alkanivorans strain 1B; Experimental Design; Astaxanthin; Lutein; Carotenoids
IX
RESUMO
Com o aumento das restrições mundiais relativas à concentração de enxofre nos combustíveis fósseis, houve necessidade de estudar processos que removessem este composto. O processo implementado e que está ainda em uso é a hidrodessulfurização. No entanto, esta técnica representa elevados custos, devido às condições extremas que usa, nomeadamente, pressão e temperatura elevadas entre outros. Uma alternativa a este processo é a biodessulfurização que utiliza microrganismos como catalisadores, que usam o enxofre que removem, nas suas vias metabólicas. Este processo tem como principais vantagens relativamente à hidrodessulfurização o facto de ser mais ecológico, e de funcionar em condições amenas (temperaturas e pressão mais baixas). No entanto, os custos associados a este processo ainda continuam a ser um dos fatores limitantes à sua aplicação a nível industrial. Assim, têm vindo a ser feitas tentativas no sentido de minimizar os custos associados à biodessulfurização quer pela minimização do valor associado ao processo (meios de cultura, equipamento, fonte de carbono, entre outros), quer pela exploração de produtos resultantes da atividade dos catalisadores(1–5). De entre vários microrganismos capazes de dessulfurizar estão espécies do género Gordonia, como por exemplo, Gordonia alkanivorans estirpe 1B(6). Esta bactéria é aeróbia, gram-positiva e com uma cor rosa/alaranjada e com elevada capacidade de dessulfurização. Recentemente, Silva et al. descreveram a capacidade de produção de pigmentos, nomeadamente carotenoides, por esta estirpe(7). Os carotenoides são usados principalmente como aditivos e corantes (na piscicultura, por exemplo) ou como suplementos nutricionais. Funcionalmente, são responsáveis por proteger as células de stress oxidativo devido à sua capacidade antioxidante e, como tal, estão associados à prevenção de diversos tipos de cancro. Desempenham também outras funções, tais como estabilização da membrana em bactérias, para além de serem responsáveis pela cor de muitos organismos. São portanto compostos com elevado valor económico(8,9).
Existem vários estudos que descrevem condições para otimizar/potenciar a produção de carotenoides, sendo que muitos referem a aplicação de condições de stress sobre os microrganismos. A formulação dos meios de cultura (composição em sais), temperatura de crescimento, oxigenação, fonte de carbono, exposição à luz e a diferentes comprimentos de onda de luz são algumas das condições testadas(10–13).
Neste contexto, e dando seguimento ao estudo desenvolvido por Silva et al., este trabalho teve como principal objetivo otimizar as condições de cultura da bactéria G. alkanivorans estirpe 1B com o intuito de maximizar a produção de carotenoides(14).
Numa primeira fase, sabendo que a estirpe 1B é frutofílica(15), estudou-se qual a influência da combinação de fontes de carbono, nomeadamente da % de glucose numa mistura de glucose-frutose
X (0-100% glucose) e da concentração de sulfato (7-37 mg.L-1) na produção de carotenoides por esta bactéria. Para isso fizeram-se dois planeamentos experimentais (PEs) baseados na distribuição de Doehlert(16) para os dois fatores acima referidos, em diferentes condições de luz (400 lux de luz e sem luz). As respostas avaliadas nestes PEs foram a produção da biomassa e dos carotenoides totais, após 72 h e 216 h. Baseado nas diferentes respostas obtidas em ambos os PEs, a melhor condição para produção de carotenoides foi com 100% de glucose e concentração de sulfato ≥22 mg.L-1, na presença de luz durante ≥216 h. Estes resultados mostraram que a luz, tempo, glucose e concentração de sulfato têm grande impacto na produção de carotenoides pela estirpe 1B.
Tendo por base a importância do tempo para a maior produção de pigmentos. Avaliou-se o comportamento da estirpe 1B durante o seu crescimento ao longo do período de 26 dias para a produção de pigmentos. Deste modo, a estirpe 1B foi cultivada em frasco agitado, com 10 g.L-1 glucose e 22 mg.L-1 sulfato, sob diferentes condições de luz (L
0 - escuro, L400 – 400 lux, L3000 – 3000 lux, com fotoperíodo variando entre 3000-7000 lux). Neste ensaio, L400 obteve a maior taxa de crescimento (0.0259 h-1), seguida de L
0 (0.0235 h-1) e por fim L3000 (0.0227 h-1). Considerando a produção de biomassa, as culturas com luz obtiveram 4.2 g.L-1, enquanto que a cultura L
0 apenas atingiu 3.5 g.L-1. Como esperado, L0 obteve a produção de carotenoides mais baixa de todos os ensaios, com apenas 220 µg (447 µg.gpeso seco -1), contrastando com o valor de 1609 µg (2596 µg.gpeso seco-1) em L400 e 1455 µg (2359 µg.gpeso seco-1) em L3000. Os resultados das culturas com luz foram os mais elevados obtidos com a estirpe 1B descritos até ao momento (0.24 – 0.26%). Este rendimento, foi ainda melhor num ensaio adicional em que a cultura foi mantida a 3000 lux sem fotoperíodo, atingindo um valor de 0.31% (3100 µg. gpeso seco-1), o melhor de entre outras estirpes de Gordonia. No ensaio, sem luz a produção de carotenoides parou assim que terminou a fase exponencial do crescimento da estirpe 1B, enquanto que, no ensaio com luz, mesmo após a fonte de carbono se ter esgotado continuou a existir produção ao longo do tempo. Os diferentes extratos foram também analisados por HPLC de modo a identificar-se os principais tipos de carotenoides produzidos por G. alkanivorans estirpe 1B. Apenas astaxantina e luteína foram identificadas nos extratos, mas estes carotenoides representam apenas uma parte dos pigmentos totais produzidos (entre 37 a 52%), havendo assim ainda muitos carotenoides por identificar.
O ensaio ao longo do tempo foi seguido também por citometria de fluxo de forma a avaliar o estado fisiológico das células, visto existirem diversos estudos que apresentam uma relação direta entre stress e aumento de produção de pigmentos. A maior percentagem de células stressadas/mortas foi obtida nas culturas com maior produção de carotenoides (culturas à luz) com 39%/12% e 32%/8% respetivamente, para L400 e L3000. Por outro lado, L0 apenas teve 18%/1% de células stressadas e mortas, no entanto e consequentemente, esta cultura foi a que obteve maior percentagem de células
XI saudáveis 81% vs. 49% em L400 e 60% em L3000. Estes resultados estão assim de acordo com a literatura, no sentido em que existe uma relação entre elevado stress celular e maior produção de carotenoides. De facto, ao sujeitar as células a stress induzido por luz resultou num aumento da produção de carotenoides de 447 µg. gpeso seco-1 para 2359-2596 µg. gpeso seco-1.
Considerando as funções e possíveis aplicações dos carotenoides, o último passo passou por testar a atividade antioxidante e antimicrobiana destes extratos. Na atividade antimicrobiana não foram obtidos resultados positivos. Por outro lado, na atividade antioxidante, as amostras estudadas apresentaram resultados positivos. O melhor resultado foi obtido com o extrato da cultura sem luz, que obteve cerca de 3.4% de descoloração de DPPH•. Considerando que esta amostra tinha 478 µg.L-1 de carotenoides e comparando com o padrão de ácido ascórbico de concentração semelhante (500 µg.L-1), este último apenas teve 1.8% de descoloração, quase metade da atividade do extrato. No entanto, devem ser efetuados mais testes utilizando os pigmentos purificados, uma vez que nos extratos podem existir outros compostos que foram simultaneamente extraídos com os pigmentos e que podem influenciar (positiva ou negativamente) a atividade antioxidante observada.
Em conclusão, estes resultados apontam para o interesse em explorar a G.alkanivorans estirpe 1B como híper produtora de pigmentos que poderão ser aplicados em diversas indústrias devido ao seu valor elevado como moléculas bioativas. Torna assim real a possibilidade de aplicar estes compostos a diversas industrias dos mais variados sectores, como químico, farmacêutico, alimentar e cosmético. Não esquecendo que a estirpe 1B é conhecida pelo seu grande potencial para dessulfurizar combustíveis fósseis, a exploração simultânea deste produto de valor acrescentado poderá beneficiar, futuramente, o aumento de escala da BDS para uma aplicação nas fases finais de uma refinaria petrolífera, tornando assim o processo mais rentável.
Palavras-chave: Gordonia alkanivorans estirpe 1B; Planeamento experimental; Astaxantina; Luteína;
XII
LIST OF FIGURES
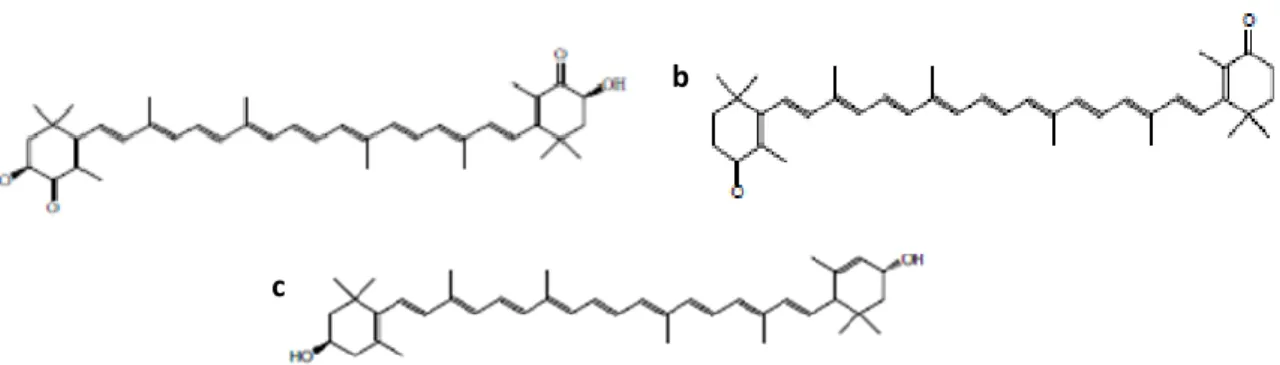
Supplementary Figure 1 - Chemical structure of (a) Astaxanthin; (b) Canthaxanthin and (c) Lutein. .. 35 Supplementary Figure 2- Response surfaces for the biomass production at 72 h (a) and 216 h (b); and
for the pigment production at 72 h (c) and 216 h (d), obtained in ED1 (L0) for the factors % glucose in a fructose-glucose mixture (0 – 100%) and sulfate concentration (7 – 37 mg.L-1)... 36
Supplementary Figure 3 - Response surfaces for the biomass production at 72 h (a) and 216 h (b); and
for the pigment production at 72h (c) and 216 h (d), obtained in ED2 (L400) for the factors % glucose in a fructose-glucose mixture (0 – 100%) and sulfate concentration (7 – 37 mg.L-1)... 38
Figure 1 - Growth profiles, in terms of biomass production (a), OD600nm (b) and glucose consumption profiles (c) for G. alkanivorans strain 1B cultivated under different light conditions (L0, L400 and L3000) for 26 days. Results were obtained in triplicate and the standard deviation shown by the errors bars. ... 21
Figure 2 – Total carotenoids (µg of carotenoids per g DCW per 150 mL) produced by G. alkanivorans
strain 1B in the assays with different light conditions (L0, L400 and L3000). (a) Amount of total carotenoids obtained through spectrophotometry analysis; (b) - Sum of astaxanthin and lutein, the carotenoids identified through HPLC analysis. Results were obtained in triplicate and the standard deviation is shown by the error bars. ... 22
Figure 3 – Amount of total carotenoids identified though HPLC analysis (µg of carotenoids per g DCW
per 150mL) in the samples obtained in the assays performed with and without light (L0, L400 and L3000).
(a) Astaxanthin content; (b) Lutein content. Results were obtained in triplicate and the standard
deviation shown by the error bars. ... 24
Figure 4 - Flow cytometry analysis through the time course of growth and pigments production of G.
alkanivorans strain 1B with 10 g.L-1 glucose and 22 mg.L-1 sulfate with different light conditions (L
0, L400 and L3000). (a) Represents the percentage of healthy cells; (b) the percentage of stressed cells; and (c) the percentage of dead cells. Results were obtained from duplicates and each analyzed 6 times. ... 26
Figure 5 – Antioxidant activity of different carotenoids extract samples and standards represented by
the percentage of discoloration of DPPH•. Extracts presented the following concentrations of total carotenoids: 478 µg.L-1 for the extract from L
0 culture; 1050 µg.L-1 for the extract from L400 culture and 969 µg.L-1 for the extract from L
3000 culture. The ascorbic acid solutions presented the following concentrations: (1) – 1000 µg.L-1 and (2) – 500 µg.L-1. ... 28
XIII
LIST OF TABLES
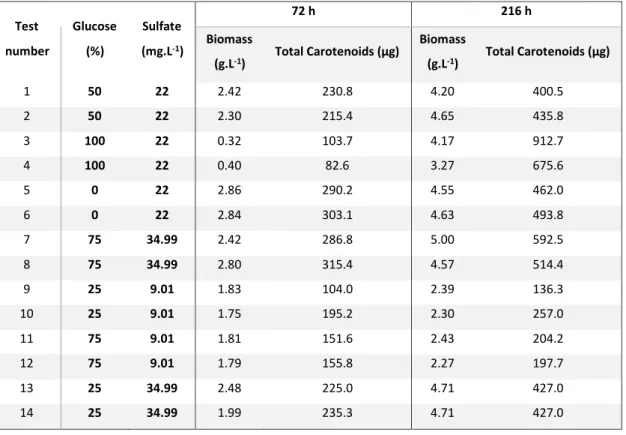
Table 1- ED1 (L0) according to a Doehlert distribution for two factors: % of glucose in a mixture glucose + fructose (0-100%) and sulfate concentration (7-37 mg.L-1), and the responses evaluated (biomass and total carotenoids). Seven conditions were tested in duplicates (14 tests), for statistical analysis. ... 35
Table 2 - ED2 (L400) according to a Doehlert distribution for two factors: % of glucose in a mixture glucose + fructose (0-100%) and sulfate concentration (7-37 mg.L-1), and the responses evaluated (biomass and total carotenoids). Seven conditions were tested in duplicates (14 tests), for statistical analysis. ... 37
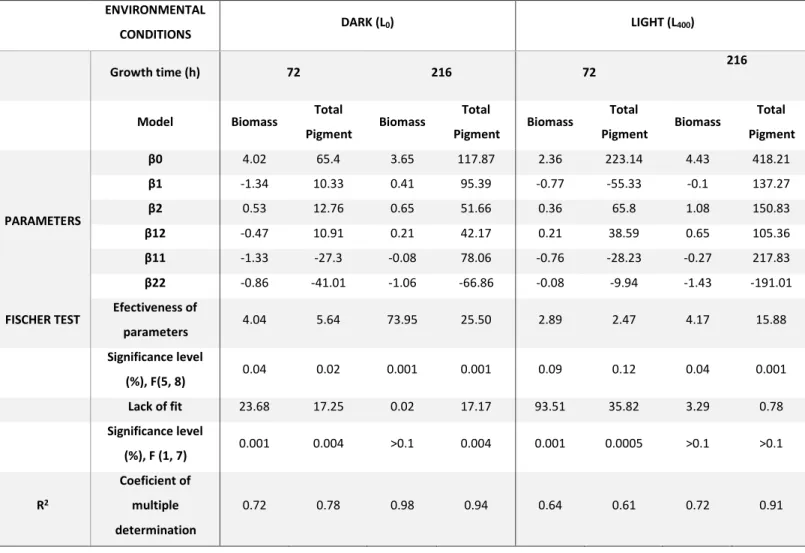
Table 3 - Parameters of the polynomial models representing the studied responses in ED1 (L0) and ED2 (L400). β0, response at the centre of the experimental domain; β1 and β2, parameters of the factors 1 and 2 (% glu and sulfate concentration) , respectively; β12, parameter of the interaction of the factors 1 and 2; β11 and β22, self-interaction parameters of the factors 1 (% glucose) and 2 (sulfate concentration, mg.L-1), respectively). ... 39
Table 4 - Metabolic parameters for the different light culture conditions of G. alkanivorans strain 1B
XIV
ABREVIATION LIST
AA – Antimicrobial Activity BDS – Biodesulfurization
CFDA – 5,6 Carboxyfluorescein diacetate C-source – Carbon source
DBT – Dibenzothiophene DMSO – Dimethylsulfoxide DCW – Dry cell weight
DPPH● – 2,2′-diphenyl-1-picrylhydrazyl
ED – Experimental Design Fru – Fructose
Glu – Glucose
HDS – Hydrodesulfurization L0 – Culture grown without light
L400 – Culture grown with 400lux light
L3000 – Culture grown with a base value of 3000lux light with photoperiod
OD600 – Optical density at 600 nm
PI – Propidium iodide SFM – Sulfur Free Medium S-source – Sulfur source
µmax – Specific maximum growth rate
v.v-1 – Volume/volume
1
1 - INTRODUCTION
1.1 - Sulfur problematic and the need for fossil fuels desulfurization
Pollution and its consequences to the environment are a focus of the public attention and the scientific community mainly to its effect in public health. Among others, atmospheric pollution is repetitively associated with causing and exacerbating diseases related to the respiratory system, and so, it represents a serious problem to public health(17).
The worldwide increase of fossil fuels consumption, mainly due to the exponential growth of industry, is a major contributor for this pollution. Fossil fuels lead to the creation of a large amount of waste products, arising from their combustion, due to their impurities. The most common products are particulates, gases as sulfur dioxide, nitrogen oxides and also some volatile organic compounds among others. Carbon, hydrogen and sulfur are the major components of crude oil and the higher its viscosity and density, the higher their sulfur content(18,19).
The combustion of high sulfur containing oils, lead to the formation of diesel particulate matter (DPM) which was classified as a carcinogenic by several regulatory and research agencies, such as the U.S. Environmental Protection Agency. DPM is related to bronchial irritation and asthma attacks in susceptible individuals. A solution to this escalating problem was crucial and so, worldwide environmental authorities imposed restrictions on the maximum amount of sulfur allowed in fossil fuels. This forced the implementation in refineries of a process whose purpose was to remove sulfur from fuels. The process implemented was the hydrodesulfurization (HDS), which it is still the industry’s solution to accomplish the stipulated sulfur limits(1). HDS brought a considerable decrease in the emission of dangerous compounds. Nevertheless, it has some disadvantages such as the fact that it requires hydrogen, extreme conditions, such as high temperatures and pressures, high residence times and sophisticated catalysts. Even though, in some cases HDS is not enough to meet the stringent environmental regulations due to the recalcitrance of heterocyclic sulfur compounds present in fossil fuels, being necessary to apply a deep HDS, which implies harsher conditions and consequently higher process costs. Thus, HDS or deep HDS, besides being highly expensive, may reduce the quality of the final product(1,2). These problems led to the search of more sustainable alternatives towards ultra-low sulfur fuels.
An alternative/complementary process to HDS is biodesulfurization (BDS), which consists on the removal of sulfur by the action of microorganisms. These microorganisms use the removed sulfur in their metabolic pathways, which makes the process eco-friendlier. Moreover, bioprocesses for fuel upgrading do not require molecular hydrogen, are performed at mild operating conditions and produce far less greenhouse gas emission than thermochemical processes(3–5). Additionally, the maintenance of the biological catalysts is also cheaper than the purchase or development of the chemical catalysts necessary to HDS. One of the limiting factors that still hinder the BDS industrial
2 scale-up is the lack of economic viability of this bioprocess(5,20). Thus, attempts to make BDS economically competitive, i.e. minimizing every cost associated with the production of the biocatalysts without influencing the desulfurizing ability of the catalyst, include the use of a cost-effective culture medium (minimal medium using cheaper compounds as alternative carbon sources), and also the exploitation of high added value by-products from the catalyst activity, such as carotenoids or biosurfactants(7,21–23). The preferred microorganisms for BDS are those that can selectively remove the sulfur from the recalcitrant compounds through the via 4S-pathway regulated by a dsz operon, in which the calorific value of the fuel is preserved. The 4S-pathway is widespread throughout several genera of microorganisms, such as Arthrobacter, Agrobacterium, Brevibacterium, Klebsiella, Mycobacterium,
Nocardia, Paenibacillus, Pseudomonas, Xanthomonas, Gordonia and Rhodococcus, with these two last
ones being the most promising(1,6,24).
1.2 - Gordonia alkanivorans strain 1B
Members of the Gordonia genus have many different metabolic pathways, which means that they have great potential for secondary metabolites formation(1,7). Some of the anabolic products of the
Gordonia species are biosurfactants (G. amarae, Gordonia sp. strain 321 and Gordonia polyisoprenivorans), Imidazol-2-yl amino acids (G. rubropertincta and G. terrae), gordonan (Gordonia
sp. strain Y-102), gordonin and other glycosylated peptidolipids (Gordonia hydrophobica) and carotenoids (G. jacobaea, G. alkanivorans). These metabolites represent valid contributors to an added value to the process of BDS(25–27).
Gordonia alkanivorans was firstly isolated from tar-contaminated soil, and it was named due to its
alkane-degrading function, useful for the biodegradation of organic contaminants and bioremediation of contaminated environments(26). Gordonia alkanivorans strain 1B is an actinomycete that was originally isolated from oil-contaminated soil and has been described as having great desulfurization capacity(6). It is an aerobic, gram-positive, catalase-positive, oxidase-negative and pink/orange-pigmented bacterium. Cells are short branched hyphae, which disintegrate to rods and coccus-like elements when visualized by phase contrast microscopy(6). This bacterium has a fructophilic behaviour and has been described as capable of growing with alternative carbon sources, which may be an advantage considering their potential towards a decrease in the overall costs of the biocatalysts production in a scale-up scenario(5,15,28,29). Moreover, recently, Silva et al., described the ability of G.
alkanivorans strain 1B to produce high added value compounds, namely carotenoids(7). This discovery
represents a new focus of research, moreover it can contribute to make, in the future, an economically viable scale-up of the BDS process using strain 1B as catalysts aiming its further integration downstream of a petroleum refinery.
3
1.3 - Carotenoids
Carotenoids are bioactive liposoluble compounds mainly synthesized by photosynthetic organisms and some non-photosynthetic organisms like bacteria, molds and yeasts. They are responsible for the color of plants, algae, some animals and microorganisms and can be yellow, orange or red pigments(30). In nature carotenoids are normally C40 tetraterpenoids, formed by eight C5 isoprenoid units joined head to tail and have a tail-to-tail linkage in the center, which results in a symmetrical structure. They have a central chain that alternates sequentially between double and single bonds, and can have a ring at one or both ends of the molecule, or be acyclic. They are all obtained from the isoprenoid pathway(7,31). Carotenoids are divided into: a) carotenes, if their chain is mainly composed by carbon and hydrogen (β-carotene, torulene, α-carotene and lycopene) and b) xantophylls, if they have a more complex structure with different functional groups. In xantophylls, depending on the functional group there are different types of carotenoid. The possible functional groups are: hydroxyl groups (e.g. lutein and zeaxanthin), keto/oxo groups (e.g. echinenone, astaxanthin and canthaxanthin), epoxide groups (e.g. violaxanthin, antheraxanthin and neoxanthin) or methoxy groups (e.g. spirilloxanthin). Presently, there are over 700 carotenoids identified(8,32–35).
1.3.1– Functions and applications
Carotenoids are essential components of the photosynthetic apparatus and can be subdivided into primary carotenoids that act as auxiliary pigments in light harvesting during photosynthesis and thus are essential for survival, and secondary carotenoids that protect the photosynthetic machinery from stress like light excess by scavenging reactive oxygen species due to their efficient anti-oxidant activity(9–11,26,32,34).
In bacteria, carotenoids have an important role in species-specific coloration, photoprotection, reactive oxygen species scavenging, light harvesting and membrane stabilization. They can also be precursors to hormones and vitamins(7).
Carotenoids in humans protect the retina from light exposure namely from near-UV exposure and have a beneficial effect due to its antioxidant activity. They have a cytotoxic effect against cancer cells, and some are active compounds for example dihydroactinidiolide in the pheromones of insects(33,36,37). Amongst the more than 750 existing carotenoids, only about 40 are present in a human diet and of these only 20 have been identified in the human blood and tissues. About 90% of the carotenoids in the human diet and body are β-carotene, α-carotene, lycopene, lutein and cryptoxanthin(38). Some carotenoids are classified as pro-vitamin A carotenoids due to the fact that they can be converted into retinal by humans and animals because they have an un-substituted ionone ring like it happens in β-carotene, α-β-carotene, γ-carotene and β-cryptoxanthin. As an example, lutein and zeaxanthin accumulate in the macula of the eye, and protect the retina filtering high-energy blue light. Lycopene is a potent anti-oxidant and so it has been described as reducing the risk of coronary heart disease and
4 certain cancers. Astaxanthin has been described as having anti-inflammatory properties, ability to inhibit the oxidation of low-density lipoprotein and to produce animal pigmentation. Is regarded as a potential novel treatment for oxidative stress and inflammation in cardiovascular diseases(8,11,26,32,38– 44).
The main applications of carotenoids are in the food industry as food colorants, as additives or even dietary supplements. They are used, for example, in the colouring of fish, squid and eggs. Some are used as fragrances and can also be used in the cosmetic industry and in nutraceutical. Currently a large set of clinical trials and associated patents are being performed in order to make use of this bio compounds in the pharmaceutical industry(8,9).
1.3.2- Production
The global market of carotenoids was of $1.2 billion in 2010 and $1.5 billion in 2014(9). It’s estimated to be around $1.8 billion in 2019 with a compound annual growth rate of 3.9%(32,45).
There are more than 750 isolated from natural sources and some may be obtained chemically like astaxanthin. The process of obtaining carotenoids is strictly regulated because of the resulting by-products with undesirable effects if consumed, and so their production by different natural sources has been gaining a lot of interest. Algae, yeasts and bacteria produce carotenoids, but only a few of these carotenoids, such as beta-carotene and astaxanthin are actually produced commercially by microorganisms, because of the high production costs associated with this process(9,30,32). The major advantages of using microorganisms as sources for carotenoids are their short life cycle, compatibility to season and climate, production of different pigments with different colors and shades, and they’re easier to scale-up. Furthermore, bacterial pigments nontoxic nature and easy separation from cell biomass are other interesting advantages. Some examples of pigment producing bacteria are
Flavobacterium sp. (zeaxanthin), Agrobacterium auranticum (astaxanthin), Micrococcus sp. (various
carotenoids), Pseudomonas aeruginosa (pyocyanin), Serratia marcescens (prodigiosin),
Chromobacterium sp. (violacein) and Rheinheimera sp. (glaukothalin)(46). One microorganism also
described as a potential source for canthaxanthin was Brevibacterium KY-4313 and even with its production improved it still wasn’t sufficient to meet the industrial demands(47).
Presently there are a considerable amount of commercial products based on lutein that are extracted from Tagetes erecta flower solely. Production from microorganisms is currently nonexistent. In the case of asthaxanthin there are already some products that are from microorganisms such as Phaffia
rhodozyma (Xanthophyllomyces dendrorhous) and Haematacoccus pluvialis(8).
Unfortunately, only 2% of the global pigment production are from biological sources. Nowadays β-carotene, y-β-carotene, torulene and torularhodin are mainly obtained from yeasts from the genus
Rhodotorula sp., Rhodosporidium sp. and Sporobolomyces sp., and astaxanthin from strains of Xanthophylomeyces sp. β-carotene can also be produced by filamentous fungi such as Gibberela sp.,
5
Mucor sp., Blakeslea sp. and Pleycomeyces sp. In the case of bacteria their main pigment is
canthaxanthin, and the genus associated with this production are Pantoea sp., Corynebacterium sp.,
Microcococcus sp., Brevibacterium sp., Bradyrhizobium spp., Gordonia sp. and Dietzia sp. Some
microalgae also associated with commercial production of pigments are from the group Chlorophycae (Chlorella sp., Dunaliella sp., Haematococcus sp.)(33).
Although pigments can be produced synthetically, it has been demonstrated that the final pigment is relatively different from the natural version. Capelli et al. demonstrated that the natural astaxanthin is more powerful in terms of antioxidant activity than other commonly used antioxidants such as the synthetic form of astaxanthin. Another difference between these two molecules is that the natural astaxanthin contains supporting carotenoids and so it is more complex than the synthetic one, which may influence greatly its functions(48).
There are 8 type of carotenoids that are synthetically produced on an industrial scale, namely the C40-carotenoids: lycopene, β,β-carotene, (3R,3’R)-zeaxanthin, canthaxanthin and astaxanthin, and three apocarotenoids: β-apo-8’-carotenal, ethyl β-apo-8’-carotenoate and citranaxanthin. They are mainly used as animal feed additives except lycopene, β-carotene and zeaxanthin, which are used as nutritional supplements(49).
1.3.3- Conditions for carotenoids production
Although pigments can be produced by microorganisms, the yield is low and still not able to compete economically with the synthetic production. Thus, there is a need to improve the performance of microrganisms and, consequently, increase the pigment yield(46).
There are several environmental and nutritional factors that have been described as influencing carotenoids production(32). It has been described that, when subjected to several stress conditions (nitrogen and phosphate limitations, salt stress and high light intensity) a variety of unicellular green algae accumulate large amounts of carotenoids. For example, in Dunaliella species stress induces a huge accumulation of β-carotene and in Haematococcus pluvialis is astaxanthin(10).
Calegari-Santos et al. studied halophilic archaea and showed that the carotenoid production is salt dependent and the concentrations applied vary among the species according to their specific requirements. Other studies showed that a combination of salt and increased light resulted in high astaxanthin accumulation, and a strong induction of carotenoid biosynthesis genes in the green algae
Haematococcus pluvialis. They have also demonstrated that the specific astaxanthin pathway and the
general carotenoid biosynthesis are subjected to transcriptional control by light. Different light intensities seemed to be perceived via the redox state of components of the photosynthetic electron transport(10,41,50).
Oxygen supply is another factor that may influence the production of carotenoids. Liu et al. studied the relationship between oxygen transfer and carotenoid production in the yeast Phaffia rhodozyma
6 in shake-flask cultures. It was reported that there was a direct correlation between carotenoid yield and the oxygen transfer rate, namely an enhancement of carotenoid synthesis with an increase in the respiration activity of P. rhodozyma(12).
1.3.3.1- Gordonia genus carotenoids production
The first reported Gordonia that biosynthesized carotenoids was G. jacobaea MV-1. Amongst others,
G. jacobaea MV-26 has been described as having a canthaxanthin production influenced by the culture
conditions(13). Gordonia alkanivorans SKF120101 has also been described as a light-induced carotenoid producer, and one of the possible produced pigments is dehydro-β-carotene(26). In a more recent study, G. alkanivorans strain 1B carotenoid production was described as being influenced by light exposure and also by the carbon and sulfur source used. In the latter work, independently of the carbon source, when the bacterium was exposed to light it had a higher carotenoid yield. Another interesting result was that when glucose was used as carbon source the carotenoids yield was higher than with fructose despite this bacterium being described as having fructophilic behaviour. This productivity was even higher if sulfur was used as sulfur source in opposite to DBT (Dibenzothiophene). Among the total carotenoids produced, canthaxanthin, lutein and astaxanthin were identified, being canthaxanthin the major carotenoid produced(7).
Astaxanthin (3,3’-dihidroxy-β,β’-carotene-4,4’-dione) (Supplementary Figure 1a) is a highly-oxidized carotenoid responsible for the colours of some birds like flamingos, crustaceans and certain fish. It contains two keto groups on each ring structure, which is associated with its anti-oxidant activity(12,43,47,48,50,51).
Canthaxanthin (4,4’-diketo-β-carotene) (Supplementary Figure 1b) is a ketocarotenoid(47,52,53). It is one of the carotenoids that does not have provitamin A activity, but it has anti-carcinogenic, immune-enhancing and antioxidant activity. It is described that canthaxanthin plays a role in immune-enhancing the gap-junction cell to cell communication through upregulation of connexin, which is a gap-gap-junction protein(43).
Lutein (Supplementary Figure 1c) is the most abundant carotenoid in all green vegetables and it is, with zeaxanthin, the major component of the macular pigments of the retina where they have protective roles. Lutein shares the carbon skeleton and bonding framework of α-carotene(8,43,54).
1.4 - Scope of the Thesis
Based on prior results obtained by Silva et al., this study focused in better understand and exploiting the ability of G. alkanivorans strain 1B, a fructophilic desulfurizing bacterium, for carotenoids production.
In this context, the main goals of this work were:
Optimization of the total carotenoids production conditions and identification of the different types of carotenoids present;
7 Cell physiology evaluation within different culture conditions through flow cytometry
and correlation to carotenoids production ability;
Anti-oxidant and anti-microbial activities of the extracted carotenoids.
2 – MATERIALS AND METHODS
2.1 - Chemicals and Reagents
Dibenzothiophene (DBT, 99%) was obtained from Acros Organics (Geel, Belgium) and Sodium sulfate anhydrous (>99 %) from Merck (New Jersey, USA). 5(6)-carboxyfluorescein diacetate (CFDA) and propidium iodide (PI) were acquired from Invitrogen (Massachusetts, USA). Astaxanthin (98%) was from Sigma-Aldrich, canthaxanthin (99%) from Roche and lutein (10%) from FloraGLO, Kemin. DMSO (99.9%), acetone (99.9%), ethyl acetate (99.8%) and methanol (99.9%) were obtained from CARLO ERBA Reagents (Val de Reuil, France). Ascorbic acid was from Sigma-Aldrich. The remaining reagents were of the highest grade commercially available. Stock solutions of glucose (glu) and fructose (fru) were prepared at 50% (w.v-1), sterilized at 121oC, 1 atm and stored for further use as carbon source (C-source) in culture media. In the same way, a stock solution of Na2SO4 20 g.L-1 was also prepared and autoclaved (121oC, 1 atm, 15 min) to be further used as sulfur source (S-source).
2.2- Microorganism and Culture Media
The microorganism used in this study was the bacterium Gordonia alkanivorans strain 1B, isolated in our laboratory((6)). The basal salts medium used for cultivation, maintenance and further for all of the growth/carotenoids production assays was a sulfur-free mineral (SFM) medium containing: NH4Cl (1.22 g), KH2PO4 (2.55 g), Na2HPO4.2H2O (2.55 g), MgCl2.6H2O (0.17 g) and 0.5 mL of a sulfur‐free trace elements solution (TES) per litre of ultrapure water((22)). The final pH was adjusted to 7.5 prior to sterilization by autoclave (121°C, 1 atm, 15 min).
Prior to carotenoids production assays, filter sterile stock solution of carbon source (C-source) (fructose and/or glucose) was added to the culture medium, in aseptic conditions, to an initial concentration of 10 g.L-1 of total sugar(s). Similarly, the stock solution of S-source (Na
2SO4) was also added to obtain the desired final concentrations of 9.04 mg.L-1, 22 mg.L-1 and 34.99 mg.L-1, depending on the assay.
The bacterial cultures were performed in 500 mL Erlenmeyer shake-flasks containing 150 mL culture medium, incubated in an orbital shaker (150 rpm) within an acclimatization chamber (Fitoclima 14000E Walk-In, Aralab, Rio de Mouro, Portugal), at 30oC, in the presence/absence of light (0-400 lux). For all the assays, it was used as inoculum 2% (v.v-1) of a G. alkanivorans strain 1B culture prior grown in SFM medium supplemented with a mixture of 5 g.L-1 fructose and glucose (ratio 1:1) as C-source and 150 µM DBT as sulfur source (S-source), at 30°C for about 10 days.
8 Different assays were performed: i) two sets of experimental design (EDs) tests to establish the optimal conditions for the carotenoids production by G. alkanivorans strain 1B (C-source vs. sulfate concentration at dark/light); ii) assays for the evaluation of the Influence of growth time to the carotenoids production (assays at light: 400 lux and 3000 lux + photoperiod; and without light: 0 lux); iii) an assay with a stable value of 3000 lux for 19 days. All the assays were carried out at least in duplicate.
Biomass samples were collected during the course of the growth or at the end of the growth for the EDs. For the assay of evaluation of time a flask with culture was collected per time analysed. Aliquots of these samples were immediately analysed for: cell growth/biomass determination; sugar(s) consumption evaluation; and cell physiological state assessment through flow cytometry. The rest of each sample was centrifuged (8600 g at 4-5°C, 20 min in a refrigerated Sigma 2-16K centrifuge) and the respective cells were stored at -20°C until further pigment extraction and analysis.
2.3- Experimental Design Methodology
A surface response methodology, based on the Doehlert distribution for two factors(16), was used into two parallel experimental designs (EDs) towards optimal carotenoids production by G. alkanivorans strain 1B: one at approximately 400 lux light (TES-1330 digital light meter; TES Electrical Electronic Corp., Taiwan, R.O.C) and the other in the absence of light. These two EDs were performed to demonstrate the importance of the light factor in carotenoids production even in the same growth conditions of C-source and sulfur-source. In both EDs, the explanatory variables or factors studied and the respective experimental domains tested were: % of glucose in a mixture glucose + fructose of 10 g.L-1 of total sugars (X1: 0-100% glu in the mix) and sulfate concentration (X2: 7-37 mg.L-1 of sulfate). In each ED set of tests, fourteen experiments (7 conditions in duplicate) were carried out. The responses studied (Yi) in both EDs were: biomass and total pigments production by strain 1B, at 72 h and 216 h. The model used to express the responses was a second order polynomial model:
Yi=β0+β1X1+β2X2+β12X12+β11X12+β22X22 (Eq. 1)
where: Yi - response from experiment i; β - parameters of the polynomial model; and X - experimental factor level(21,24).
2.4 - Carotenoids Extraction
The centrifuged biomass samples from the different assays was defrosted at room temperature and completely isolated from light exposure. Then it was distributed as uniformly as possible on a Petri dish using a loop, and further dried at 55oC for a period of 15 to 60 min. Portions of about 25 mg of the dried biomass (cells with 60% humidity) were weighted into 1.5 mL Eppendorf microcentrifuge tubes for the extraction and another portion of 25 mg for dry cell weight (DCW) calculations.
To extract the carotenoids, 1 mL of Dimethyl Sulfoxide (DMSO) was added to each biomass in the microcentrifuge tubes and incubated on an orbital incubator at 50oC for 45 to 60 min. The tubes were
9 centrifuged at 14300 g for 5 min (Biofuge 15 centrifuge, Heraeus Sepatech, Germany) and the supernatant stored. The process was repeated with 0.5 mL of DMSO until the supernatant recovered from the biomass became colourless. The next step consisted in the extraction of the total pigment from the DMSO. Thus, the overall recovered supernatant was mixed with acetone, a NaCl solution at 20% v.v-1 and ethyl acetate in a proportion of 1:1:6 respectively for each 4 mL of extracted supernatant. The mixture was gently shaken, left to rest (1 h) for phase separation, and the coloured layer (ethyl acetate phase = top layer) was retrieved and placed at -20oC overnight to promote effective phase separation. Finally, the top layer, containing the carotenoids, was collected and filtered through 0.22 µm Nylon - syringe filter and the final volume was measured. The samples were stored at -20oC until further carotenoids analysis both by spectroscopy and high performance liquid chromatography (HPLC). Throughout the different steps of the extraction process, the samples were covered with aluminium foil to prevent carotenoids degradation due to light exposure.
2.5 - Analytical Methods
2.5.1 - Optical Density and Dry Cell Weight
Cell growth was monitored by the measurement of optical density of the culture at 600 nm (OD600) (Thermo Electron Corporation Spetrofotometer, model Genesys 20, Madison, USA) and by the determination of dry cell weight (DCW). DCW was determined by centrifuging 1.5 mL of the bacterial culture broth and then drying the pellet at 100oC overnight.
2.5.2- Sugar Consumption Evaluation
The concentration of the carbon source, fructose and/or glucose, was determined using HPLC instrumentation (LaChrom Merck/Hitachi, Germany), equipped with a differential refractive index detector. In this HPLC, a Waters SugarPak 1 column (6.5 x 300 mm, Bio-Rad Laboratories, CA, USA) was used, operating at 75oC with Ca-EDTA at 50 mg.L-1 as mobile phase with a flow rate of 0.5 mL.min-1. The obtained data was analysed with Chromeleon software ver. 6.40 SP6 build 783 (1994-2003, Dionex).
2.5.3- Flow Cytometry Analysis for Cell Physiological Evaluation
The cells physiological state was evaluated by flow cytometry analysis. Data acquisition was performed in a FACSCalibur Flow Cytometer (BD Biosciencies, San Jose, CA, USA) equipped with an argon laser emitting at 488 nm. The data obtained was analysed using FCS Express 5 Flow Research Edition software (De Novo Software, 2016). Cells were stained with both aliquots of 10 mM CFDA (5,6 Carboxyfluorescein diacetate) in acetone solution (green fluorescence, FL1) and of 1.5 mM PI (propidium iodide) in distilled water solution (red fluorescence, FL3), accordingly to Silva et al. and Teixeira et al.(55,56). Prior to the cytometry analysis the cells were centrifuged at 8500 g for 10 min (Biofuge 15, Heraeus Sepatech, Germany), resuspended in Tris-HCl Buffer (50 mM, pH 7.4) and sonicated for 10 seconds. The concentration of the cells suspension was adjusted to, approximately,
10 3000 events per second by flow cytometric analysis. Of the adjusted cell solution, 995 µL were incubated with 5 µL of CFDA solution for 30 min at 37oC protected from light exposure. After that, the cells were centrifuged at 8500 g for 10 min (Biofuge 15, Heraeus Sepatech, Germany), resuspended in 999 µL Tris-HCl Buffer and maintained in ice. To complete the double staining, 1 µL of PI solution was added and the flow cytometric analysis was immediately performed. Each test sample was collected in duplicate and the readings were performed six times total for each duplicate. To discriminate the cells from background noise and debris, instruments settings were selected for the forward and side scatter signals. Samples with only Tris-HCl buffer and no cells were analysed to assess the continuous presence of background noise and consequently confirming that this was not due to unstained cells. Cells harvested during the exponential phase of a culture with fructose as carbon source (5 g.L-1) and 200 µM of DBT were used as the healthy cells control. For the dead cells control, healthy cells were incubated in ethanol at 70% (v.v-1) for 1 min(55).
2.5.4- Pigments Analysis
The characterization of the pigments produced by G. alkanivorans strain 1B grown in the different culture conditions was performed by two different methodologies: spectroscopy analysis and HPLC. Firstly, to assess the amount of total carotenoids extracted from each biomass sample, UV–Visible spectrum (Shimadzu spectrophotometer UV‐2401PC) was run, between 380 and 700 nm, and the concentration of total carotenoids was estimated based in the Lambert‐Beer equation according to Nobre et al., but using the value of 2091.4 L.10g-1.cm-1 for the specific optical extinction coefficient at λ = 477 nm (wavelength of the maximum absorbance of canthaxanthin in ethyl acetate)(7,57).
Further specific carotenoid identification and quantification was performed using HPLC (Agilent 1200 Series system, Agilent Technologies, Tokyo) equipped with a μ-Bondapack C18 (250/4.6 mm) column and a UV/VIS detector also from Agilent (λ = 477 nm), using methanol (with 0.2% water): acetonitrile (75:25) as eluent, the pigments were eluted for 90 min at a flow rate of 0.5 mL.min-1. The identification of carotenoids in each extract from different biomass samples was carried out by comparing the retention time patterns with those obtained for individual standards, namely of asthaxanthin, canthaxanthin, β-carotene and lutein, using LC3D ChemStation software (Rev.A.10.02 [1757], 1990-2003, Agilent Technologies, USA). The pigment results were presented as percentage (%=g carotenoid/100g DCW), or in total µg (µg carotenoid per g DCW per 150 mL).
2.6- Determination of Antioxidant Activity
To evaluate the antioxidant activity of the carotenoids produced by G. alkanivorans strain 1B, the 2,2-diphenyl-1-picrylhydrazyl (DPPH•) radical scavenging activity assay was performed, adapted from D’Angelo et al.(58). Thus, for the DPPH• scavenging assays, a stock solution of DPPH• at 300 µM in methanol was prepared and then diluted to 100 µM. For each carotenoids extract in ethyl acetate, an aliquot of 0.2 mL of the test sample was added to 1.8 mL of the DPPH* 100 µM solution and absorbance
11 was immediately measured with a Kinetic analysis of the UV–Visible spectra (Shimadzu‐UV‐2401PC) at 517 nm for 10 min against a control (with ethyl acetate).
The radical scavenging/antioxidant acitivity is determined as the DPPH• decolorization percentage (% decolorization), calculated as the following equation(58):
DPPH• decolorization (%) = (1 −𝐴𝑏𝑠𝑜𝑟𝑏𝑎𝑛𝑐𝑒sample
Absorbancecontrol)×100 (Eq. 2)
where Absorbancesample and Absorbancecontrol are, respectively, the absorbances in the sample and in the control, at 517 nm during the 10 min analysis.
Moreover, the scavenging activity of the carotenoids extract samples was compared with a set of ascorbic acid solutions with different concentrations (adjusted to the total carotenoids concentration present in each tested sample).
2.7- Determination of Antimicrobial Activity
The antimicrobial activity (AA) of extracts of the carotenoids produced by strain 1B, in different culture conditions, was determined for two different microorganisms: Pseudomonas putida and Escherichia
coli (LNEG Culture Collection of Microorganisms). Lysogeny broth (LB) or tryptone soya broth (TSB) are
general-purpose culture media that may be used in the cultivation of a wide variety of fastidious and non-fastidious microorganisms towards the antimicrobial susceptibility testing. In this context,
Pseudomonas putida was maintained on Lysogeny broth agar (LBA) and transferred to LB prior the
antimicrobial activity assays at 30°C. Escherichia coli was maintained in tryptone soya agar (TSA, Oxoid) and grown in tryptone soya broth (TSB, Oxoid) during the assays, at 37°C.
For AA tests, aliquots of 0.1 mL of bacterial culture just grown in fresh liquid medium were transferred into Petri dishes ( = 90 mm), containing the respective solid medium, and uniformly distributed with sterile spheres. After the microorganism is embedded, sterile filter paper discs ( = 5 mm) were submersed into the samples to be tested, placed in the respective Petri dish and air dried for about 5 min (in order to evaporate the ethyl acetate for less toxicity). Control assays with ethyl acetate were carried out to assess the toxicity of the organic solvent with the pigments. The Petri dishes were incubated at 30 and 37oC, respectively for P. pudida and E. coli, during 48-72 h. Antimicrobial activity was evaluated considering the inhibition halo formation developed around the disc, according with the Clinical Laboratory Standards Institute (CLSI) Guidelines(59). The assays were carried out in duplicate plates.
3- RESULTS AND DISCUSSION
3.1- Experimental Designs
Silva et al., studying the carotenoids production potential of Gordonia alkanivorans strain 1B, pointed out that the best condition for pigments production was culture growth with glucose and sodium
12 sulfate as carbon (C) and sulfur (S) source, respectively, in the presence of light (3000 lux), despite of the known fructophilic behaviour of strain 1B(7,15). This work was a follow-up of this study in order to try to attain the optimal conditions for carotenoids production by strain 1B. In this context, two parallel experimental designs (EDs), one in the absence of light (ED1 – L0) and the other at approximately 400 lux light (ED2 – L400), were carried out to demonstrate the importance of light factor in carotenoids production even in the same growth conditions of C-source and S-source. So, in both EDs based on the surface response methodology accordingly to the Doehlert distribution(16) it was evaluated the influence of two factors: % of glucose in a mixture of glucose + fructose (10 g.L-1 total sugars), ranging from 0-100% glu, and sulfate concentration, ranging from 7-37 mg.L-1.
In each ED, fourteen tests were carried out corresponding to seven conditions tested in duplicate. The responses evaluated were the biomass (g.L-1) and the total pigment production (g), both after 72 h and 216 h. Total pigment values were calculated based on the spectrophotometric analysis of each carotenoids extract sample.
3.1.1 – ED1 (L0)
Table 1 (APPENDIXES) shows the set of tests performed within the ED1, towards optimal conditions
for carotenoids production by strain 1B in the absence of light (L0), and the responses evaluated (biomass and total pigment production, both after 72 h and 216 h).
Analysing the data for 72 h in terms of biomass concentration, tests 1 to 6 showed the effect of varying glucose concentration for a constant sulfate concentration at the centre of the experimental domain (22 mg.L-1). By increasing glucose from 0 to 5 g.L-1 (50%), the biomass concentration was decreased by 13.7% (from 4.7 to 4.0 g.L-1), and, when the concentration was increased to 10 g.L-1 (100% of total sugars), the biomass was reduced to 15.5% of the original value (0.72 g.L-1). Moreover, in tests 7, 8, 13 and 14, maintaining sulfate concentration at 34.99 mg.L-1, and increasing the glucose/total carbon ratio from 25% to 75% resulted in a decrease of 13% of biomass (from 3.76 to 3.25 g.L-1). Conversely, for lower concentrations of sulfate (9.01 mg.L-1 in tests 9, 10, 11 and 12) the increase of glucose from 25% to 75% resulted in no relevant difference. Maintaining glucose at 25% and increasing sulfate from 9.01 to 34.99 mg.L-1 (tests 9, 10, 13 and 14) resulted in a 54.5% biomass increase (from 2.43 to 3.76 g.L-1). A similar tendency was observed on tests 7, 8, 11 and 12, in which glucose was maintained at 75% of total sugars and sulfate increased from 9.01 to 34.99 mg.L-1, resulting in an 18.6% biomass increase (from 2.74 to 3.25 g.L-1). These results highlighted the fructophilic nature of the strain 1B, as it was already described by Alves et al.(15). The proportion of glucose had a high influence for biomass production. With higher concentration of glucose, the bacteria presented lower growth rates, obtaining reduced biomass values. However, for lower values of sulfate, under 22 mg.L-1, glucose concentration became less important, indicating that sulfate might be at a limiting concentration.
13 Taking into account pigment production, at 72 h, tests 1 to 6 demonstrated that increasing glucose from 0 to 5 g.L-1 resulted in an increase of 81% (from 36.1 to 65.4 µg). However, a further increment
to 10 g.L-1 led to a reduction to the original pigment levels. When sulfate concentration was 9.01 mg.L-1 (tests 9, 10, 11 and 12), increasing glucose from 25% to 75% increased pigment
accumulation by 217% (from 8.1 to 25.5 µg). When the same variation of glucose proportion was performed in a medium with 34.9 mg.L-1 of sulfate, the pigment accumulation was improved by 176% (from 20.7 to 57.1 µg). When glucose was at a 25% proportion and sulfate was increased from 9.01 to 34.99 mg.L-1, there was an increase of 157% (8.1 to 20.7 µg). In similar manner, when the growth was performed with glucose at a 75% ratio, the same increase in sulfate concentration resulted in an increase of 124% (25.5 to 57.1 µg) of pigment accumulation. These results show that both factors are equally important for pigment production at 72 h, also indicating that there is an equilibrium in the importance of both the sugars used for the growth. While glucose stimulates pigment formation, it results in slower biomass formation, so an intermediate value between fructose and glucose should be ideal.
Analysing the data obtained in the same conditions, after 216 h, the effect of varying the proportion of glucose (0 to 100% in the carbon mixture) while maintaining sulfate concentration at constant value (the centre of the experimental domain, 22 mg.L-1) was observed. Tests 1 to 6 showed an increase of biomass concentration with the increase of glucose in the mix. When glucose was raised from 0 to 5 g.L-1 and then to 10 g.L-1, biomass increased 15.7% (from 3.15 to 3.65 g.L-1) and 26.3% (from 3.15 to 3.98 g.L-1),respectively. This behaviour was observed whenever glucose was increased, with greater differences for higher sulfate concentrations. An increase from 25% to 75% glucose at a sulfate concentration of 9.01 mg.L-1 (tests 9, 10, 11 and 12) resulted in an increase 9.53% (2.16 to 2.38 g.L-1),
whereas, for sulfate at 34.99 mg.L-1 (tests 7, 8, 13 and 14) biomass increased 18.6% (3.11 to 3.69 g.L-1). The most significant differences were observed when varying the sulfate concentration. For
a fixed value of 25% glucose, changing sulfate from 9.01 to 34.99 mg.L-1, there was an increase of 44% of the biomass concentration (2.16 to 3.11 g.L-1). While the same increase with 75% glucose results in a 55.4% increase in biomass (2.38 to 3.69 g.L-1). In both cases, increasing the factor studied results in an increase of the response. However, increases in sulfate resulted in greater increases in biomass. Moreover, the correlation between the increase of glucose and the increase of biomass may contrast with the fructophilic nature of this bacterium(15). This observation is due to the fact that in the assays with greater concentrations of fructose the strain 1B attains its maximum biomass value before 72 h and, thus, the value of biomass concentration noticeable at 216 h (3.15 g.L-1) is already in decline. In fact, in a culture medium with higher glucose concentration, the cells presented lower growth rates, achieving the maximum biomass concentration at a later time, thus explaining the observed results.