Received October 28, 2009 and accepted May 14, 2010. Corresponding author: ray-ana@ig.com.br
Prediction of carcass tissue composition of F1 crossbred goats finished on
native pasture
1Rayana de Medeiros Silva2, José Morais Pereira Filho2,3, Aderbal Marcos de Azevêdo
Silva2,3, Marcílio Fontes Cezar2, Anderson Luiz Nascimento da Silva2, Ariosvaldo Nunes de Medeiros3,4
1Pesquisa financiada pelo CNPq.
2Programa de Pós-graduação em Zootecnia, Universidade Federal de Campina Grande, Patos, PB, Brazil. 3Bolsista de produtividade do CNPq.
4Programa de Pós-graduação em Zootecnia, Universidade Federal da Paraíba, Areia, PB, Brasil.
ABSTRACT - The objective of this study was to estimate tissue composition of the carcass from physical composition of commercial cuts of F1 crossbred goats (Boer with females of non-defined racial standard) finished on native pasture with four levels of supplementation with concentrate (0.0; 0.5; 1.0 and 1.5% of BW in dry matter). It was used 24 non-castrated animals at initial body weight of 15.52 kg and at 120 days of age. The carcass was sectioned in the half, and from the left-half carcass, the following cuts were detached: leg, loin, ribs, shoulder and neck, which were dissected in muscle, bone and fat. Carcass weight and yield were predicted from the weight and yield of tissues in the commercial cuts by regression analysis. All the cuts can be used to predict muscle and fat weight in the carcass. For the muscle, the relationship was linear and positive in the cuts leg, ribs, shoulder and neck, and cubic in the loin; for all the cuts, fat kept a linear relationship with the carcass. Muscle and fat yield of all the commercial cuts showed a positive linear relationship with carcass yield, except for rib fat, for which a cubic relationship was found. Considering all the results obtained and using the relationship with the highest determination coefficient, the ribs were the cut that provided the best estimate of the carcass muscle and fat yields of F1 crossbred goats (Boer with females of non-defined racial standard) finished on native pasture.
Key Words: bone, dissection, fat, muscle yield, physical composition
Predição da composição tecidual da carcaça de caprinos mestiços F1
terminados em pastagem nativa
RESUMO - Objetivou-se estimar a composição tecidual da carcaça a partir da composição física dos cortes comerciais de caprinos mestiços F1 (Boer com fêmeas de padrão racial não definido) terminados em pastagem nativa com quatro níveis de suplementação com concentrado (0,0; 0,5; 1,0 e 1,5% do PC em matéria seca). Utilizaram-se 24 animais não-castrados com peso corporal inicial de 15,52 kg e 120 dias de idade. A carcaça foi seccionada ao meio, e da meia-carcaça esquerda foram separados os cortes: perna, lombo, costilhar, paleta e pescoço, os quais foram dissecados em músculo, osso e gordura. O peso e rendimento da carcaça foram preditos a partir do peso e o rendimento dos tecidos nos cortes comerciais, por meio de análise de regressão. Todos os cortes podem ser utilizados para predizer os pesos de músculo e de gordura na carcaça. Para músculo, a relação foi linear e positiva nos cortes perna, costilhar, paleta e pescoço e cúbica no lombo; para todos os cortes, a gordura manteve relação linear com a carcaça. O rendimento de músculo e de gordura dos cortes comerciais apresentou relação linear positiva com o da carcaça, exceto para gordura do costilhar, para o qual a relação foi cúbica. Considerando todos os resultados e utilizando a relação com o maior coeficiente de determinação, o costilhar foi o corte que possibilitou melhor estimativa do rendimento de músculo e de gordura da carcaça de caprinos mestiços F1 (Boer com fêmeas de padrão racial não definido)
terminados em pastagem nativa.
Palavras-chave: composição física, dissecação, gordura, osso, rendimento de músculo
www.sbz.org.br
Introduction
Tissue composition is the major factor in determining carcass quality due to its effects on the commercial value of
tissue components (muscle, bone and fat) resulting, according to Osório & Osório (2005), in an expensive and lengthy procedure. More practical, faster and less expensive methods are used to estimate the carcass composition, particularly from the muscle and fat, such as biometric measurements, body mass index, body condition scoring, loin area, among others (Cezar & Sousa, 2007).
Silva & Pires (2000) stress the importance of carcass measurements because they allow comparisons among breeds, carcass weight and age at slaughter, and feeding systems. Besides, its correlations to other measurements including carcass tissues, allow predictions that may avoid the use of expensive processes of carcass dissection. However, despite the difficulties faced in carcass dissection, this is still the most appropriate procedure to determine carcass tissue components.
Moreover, muscle, bone and fat measurements can be taken in part-dissected carcasses, not in the entire carcass, reducing cost and waste, allowing the commercialization of the other meat cuts. This is emphasized by Pinheiro et al. (2007), who used only high priced meat cuts (leg, loin and shoulder) in studies with cross-bred ovines (Ile de France × Ideal). Silva et al. (2010) stress the importance of research providing more information on the tissue composition of carcass cuts of goats finished in native pasture. However, different meat cuts are used in tissue composition prediction in different regions and countries, which may present some difficulties when it comes to the selection of the carcass segment for tissue prediction.
Therefore, the objective of the present study is to predict the tissue composition of the carcass based on the physical composition of commercial cuts of F1 (Boer with females of non defined racial standard) animals finished on native pasture with four levels of supplementation.
Material and Methods
The experiment was carried out on “Nupeárido” farm of the Universidade Federal de Campina Grande, Patos Campus, Paraiba, Brazil. The study began in May 2007 and finished in August 2007, with a grazing period of 98 days. The climate in the region is classified as hot and dry, being characterized by two well-defined seasons, a rainy season from January to May, and a dry season from June to December, with an average annual rainfalls of 500 mm, mean temperature of 28.5ºC, relative humidity of 61%, and altitude of 300 meters. The vegetation of the experimental area is characterized by the presence of native and exotic lignified species that together account for around 10 to 15% of the soil coverage. The main species that form the herbaceous stratum include
milhãs (Brachiariaplantaginea and Panicum sp.),
capim-buffel (Cenchrus ciliares L), capim rabo-de-raposa
(Setaria sp.) and capim-panasco (Aristida setifolia H.B.K.);
dicotiledôneas, mata-pasto (Senna obtusifolia),
malva-branca (Sida cordifolia L), erva-de-ovelha (Stylozanthes
sp.), azulão (Centratherum sp.), guizo-de-cascavel
(Crotalaria micans Link). The lignified species include
craibeira (Tabebuia caraíba Bur), jurema-preta (Mimosa tenuiflora Wild), algaroba (Prosopis juliflora (Sw) DC),
juazeiro (Zizyphus joazeiro Mart:Rhamnaceae), and also
fruit species such as cajarana (Spondias sp.) andcajueiro
(Anacardium occidentale).
Twenty-four non-castrated, cross-bred F1 (Boer with females of non defined racial standard) goats at 120 days of age and at initial body weight (BW) of ± 15.52 kg were used in the experiment. The animals were fed on a continuous grazing system from 8:00 a.m. to 4:00 p.m., and they were then taken to their stalls for supplementation with increasing levels of concentrate (0.0; 0.5; 1.0 and 1.5% of BW in dry matter) in individual cages equipped with troughs and drinking vessels.
The supplement diet was composed of ground corn (53.21%), wheat meal (24.43%), cotton pie (13.61%), soybean meal (3.76%), soybean oil (1.75%), calcitic limestone (1.5%) and mineral core for goats (1.74%), and it was balanced according to recommendations of AFRC (1998) so the highest supplementation level provided a daily weight gain of 200 g per animal.
Following the finishing period, the animals were submitted to 24 and 16 hours of fasting (restriction of solid and liquid food, respectively) and then they were weighed to obtain the slaughter body weight. The average age of the animals was 218 days and they were slaughtered at body weight of 25.12, 26.62, 28.56, and 29.19 kg for the respective supplementation levels as follows: 0.0, 0.5, 1.0 and 1.5% of BW in dry matter. Slaughter was performed by stunning and cutting of the carotid arteries and the jugular veins, followed by flaying and removal of viscera.
The carcass was obtained after skinning, detachment of head, viscera and anterior and posterior paws at the level of carpometacarpal and tarsometatarsal joints, respectively. The carcasses were maintained in a cold chamber for 24 hours at 3-5ºC and they were then sectioned in two half-carcasses.
characterized as the predictor of bone tissue in the carcass.
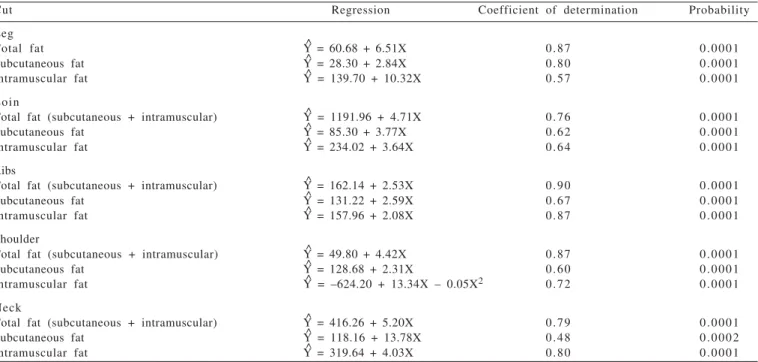
The total amount of fat in the ribs (Table 3) has provided the best estimate for the total weight of carcass fat. Argüello et al. (2001), who obtained the best coefficients of determination (r2) to estimate the weight of subcutaneous
and intramuscular fat contents in the leg cut (0.88), unlike the results obtained for crossbred F1 goats (Boer with females of non-defined racial standard), for which the best adjustment for subcutaneous and intramuscular fat contents was obtained, respectively, by using these tissues in the leg (0.80) and in the ribs (0.87).
Increase by one percent point in the yields of muscular tissue in the leg, loin, ribs, shoulder and neck led to an increase of 0.65; 0.34; 0.60; 0.76 and 0.37%, respectively, in the carcass muscle yield (Table 4). The coefficient of determination (r2) obtained by using muscle yield in the
cuts indicates the ribs as the best predictor of muscle yield in the carcass (r2 = 0.83). This is probably explained by the increased weight gain of the animals. Cezar & Sousa (2007) stated that the increased age and weight at slaughter resulted in the proportional increase of muscle deposition in the region of the trunk, which was consistent with the findings by Morand-Fehr (1981) and Warmington & Kirton (1990), in which growth occurs in a centripetal fashion, that is, by means of progressive waves of growth from the extremities to the thorax.
Increase by one percent point in the bone composition of the leg, ribs, shoulder and neck corresponded to increases of 0.48; 0.40; 0.68 and 0.22%, respectively, in the carcass (Table 5). The amount of bone in the shoulder provided the At the end of the dissection, the half-carcass was
restored and the amount of muscle, bone and fat of the half-carcass was used to obtain tissue yield.
For weight prediction, the weight of the tissues of the cuts was used to estimate the weight of the cuts in the carcass; likewise, for yield prediction, the percentage of muscle, bone and fat in the cuts was used to predict tissue yield in the carcass. To predict weight and the tissue composition of the carcass, data were subjected to regression analysis. All the analyses were performed using the SAS program (2004) at a significance level of 5%.
Results and Discussion
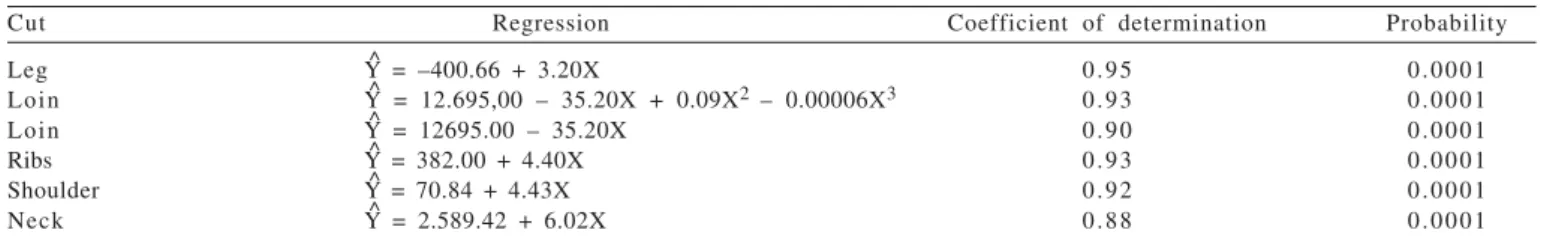
All the cuts can be used for the prediction of muscle weight in the carcass, being regression analysis linear and positive (P<0.05) for the leg, ribs, shoulder and neck or it is cubic when loin tissues are used (Table 1).
The amount of muscle in the leg has provided the best estimate for this tissue in the carcass because of its higher coefficient of determination (r2 = 0.95) compared to the
results obtained for the other cuts. This behavior corroborates the findings reported by Arguëllo et al. (2001) in goats of the Canário group slaughtered between 6 and 15 kg of body weight (BW). Although the best adjustment for loin occurred in the cubic model (r2 = 0.93), a r2 = 0.90 was found
for the linear effect.
There was a positive linear relationship (P<0.05) between the weight of the five studied cuts and the weight of the tissue in the carcass (Table 2). The highest coefficient of determination was found for the ribs (0.84), which was
Cut Regression Coefficient of determination Probability
Leg Y^ = –400.66 + 3.20X 0.95 0.0001
Loin Y^ = 12.695,00 – 35.20X + 0.09X2 – 0.00006X3 0.93 0.0001
Loin Y^ = 12695.00 – 35.20X 0.90 0.0001
Ribs Y^ = 382.00 + 4.40X 0.93 0.0001
Shoulder Y^ = 70.84 + 4.43X 0.92 0.0001
Neck Y^ = 2.589.42 + 6.02X 0.88 0.0001
Y^ = dependent variable (muscle tissue in the carcass); X = independent variable (weight of muscle tissue in the cuts).
Table 1 - Prediction of muscle weight in the carcass from muscle tissue of commercial cuts of F1 cross-bred goats (Boer with females of non defined racial standard)
Cut Regression Coefficient of determination Probability
Leg Y^ = 207.14 + 2.86X 0.71 0.0001
Loin Y^ = 1440.30 + 3.81X 0.56 0.0001
Loin Y^ = 661.17 + 2.80X 0.84 0.0001
Ribs Y^ = –231.86 + 5.16X 0.79 0.0001
Shoulder Y^ = 1333.90 + 3.90X 0.58 0.0001
Y^ = dependent variable (bone tissue in the carcass); X = independent variable (weight of bone tissue in the cuts).
best coefficient of determination (r2 = 0.61). Bone yield in the
loin did not influence the amount of this tissue in the carcass. The total fat yield in the ribs, using the cubic model, expressed the highest coefficient of determination (r2 = 0.85),
indicating that this cut is the best predictor of the fat content in the carcass (Table 6). When estimating the subcutaneous fat yield in the carcass, only the neck cut was not found as significant, but the leg of goats was found to be the best predictor of the subcutaneous fat content in the carcass.
The adipose tissue is the most variable component of the carcass, regarding both its amount and distribution in the carcass (Rosa et al., 2005), with late, though continuous development during the entire life of the animal. Carvalho et al. (2003) highlighted factors such as sex, race, species, feeding conditions and breeding system, whereas Macedo et al. (2000) reported termination period and weight at slaughter as determinant factors in the amount and distribution of body fat, which was also observed by
Cut Regression Coefficient of determination Probability
Leg
Total fat Y^ = 60.68 + 6.51X 0.87 0.0001
Subcutaneous fat Y^ = 28.30 + 2.84X 0.80 0.0001
Intramuscular fat Y^ = 139.70 + 10.32X 0.57 0.0001
Loin
Total fat (subcutaneous + intramuscular) Y^ = 1191.96 + 4.71X 0.76 0.0001
Subcutaneous fat Y^ = 85.30 + 3.77X 0.62 0.0001
Intramuscular fat Y^ = 234.02 + 3.64X 0.64 0.0001
Ribs
Total fat (subcutaneous + intramuscular) Y^ = 162.14 + 2.53X 0.90 0.0001
Subcutaneous fat Y^ = 131.22 + 2.59X 0.67 0.0001
Intramuscular fat Y^ = 157.96 + 2.08X 0.87 0.0001
Shoulder
Total fat (subcutaneous + intramuscular) Y^ = 49.80 + 4.42X 0.87 0.0001
Subcutaneous fat Y^ = 128.68 + 2.31X 0.60 0.0001
Intramuscular fat Y^ = –624.20 + 13.34X – 0.05X2 0.72 0.0001
Neck
Total fat (subcutaneous + intramuscular) Y^ = 416.26 + 5.20X 0.79 0.0001
Subcutaneous fat Y^ = 118.16 + 13.78X 0.48 0.0002
Intramuscular fat Y^ = 319.64 + 4.03X 0.80 0.0001
Y^ = dependent variable (adipose tissue in the carcass); X = independent variable (weight of adipose tissue in the cuts).
Table 3 - Prediction of fat weight in the carcass from adipose tissue of the commercial cuts of F1crossbred goats (Boer with females of non defined racial standard)
Cut Regression Coefficient of determination Probability
Leg Y^ = 19.22 + 0.65X 0.45 0.0003
Loin Y^ = 42.79 + 0.34X 0.38 0.0011
Ribs Y^ = 29.75 + 0.60X 0.83 0.0001
Shoulder Y^ = 14.77 + 0.76X 0.65 0.0001
Neck Y^ = 42.25 + 0.37X 0.35 0.0022
Y^ = dependent variable (muscular tissue in the carcass); X = independent variable (weight of muscular tissue in the cuts).
Table 4 - Prediction of carcass muscle yield from the muscle yield of commercial cuts of F1crossbred goats (Boer with females of non defined racial standard)
Cut Regression Coefficient of determination Probability
Leg Y^ = 11.93 + 0.48X 0.44 0.0004
Loin Y^ = 23.91 0.02 0.4249
Ribs Y^ = 13.40 + 0.40X 0.58 0.0001
Shoulder Y^ = 7.94 + 0.68X 0.61 0.0001
Neck Y^ = 18.08 + 0.22X 0.30 0.0050
Y^ = dependent variable (bone tissue in the carcass); X = independent variable (weight of bone tissue in the cuts).
Pinheiro et al. (2007) in ovines Ile de France × Ideal) and Teixeira et al. (1995) in goats of the Serrana race. It is important to stress that during dissection, the adipose tissue is the most difficult to be removed, particularly in young animals (Sanz Sampelayo, 1992) or when the carcasses are from animals with low body weight (Yáñez et al., 2007). In their study of carcass characteristics and their correlations with tissue composition in ovines (Texel × Ideal) slaughtered immediately after weaning, with 28 and 30 kg body weight, Silva & Pires (2000) found that the ribs presented the best coefficients of determination for the percentage of muscle (0.72), bone (0.93) and fat (0.79) in the carcass.
A correlation was found between the yield of the tissues of cuts with the carcass tissues, being positive for the yield of muscle tissue and negative for the adipose tissues, without correlation among the bone tissue of all cuts. Concerning the yields of subcutaneous fat of the ribs and neck and the yield of intramuscular fat in the loin, no significant correlations were observed (Table 7). The positive correlation of the muscle tissue yield with the carcass muscle yield (Table 7) was most representative in the ribs (0.916), followed by the shoulder (0.810), leg (0.674), loin (0.624) and neck (0.594). As for the negative correlation of the muscle yield of the cut with the fat yield in the carcass was most representative for the ribs (–0.379), loin (–0.610) and shoulder (–0.570), and less representative
for the leg (–0.379) and neck (–0.375). Considering fat yield, all cuts showed a positive correlation with the yield of the adipose tissue in the carcass, and once again the best result was obtained with the ribs (0.902) and the lowest representativeness was observed for the loin (0.725). The results obtained with crossbred F1 goats (Boer with females of non defined racial standard) for the correlation of the yield of the rib muscle with the yield of the carcass muscle (0.916) corroborates the results obtained by Silva & Pires (2000), who assessed tissue composition prediction of carcass of lambs and found that the ribs was the cut that best represented the carcass (r2 = 0.85).
Ribs were found to be the region that provided the best estimates for yields and correlations of muscle, for total fat and for intramuscular fat in the carcass, and this can be explained by the late maturity of this cut, which was already observed by Yáñez et al. (2006) in Saanen goats slaughtered at 35 kg of body weight and by Pereira Filho et al. (2008) in F1 Boer × Saanen goats slaughtered between 5 and 25 kg, which confirms the direct relationship between weights at slaughter and carcass weight (Yamamoto et al., 2004). Moreover, the animals were slaughtered when they had nearly reached physiological maturity (218 days of age) and finished on Caatinga pasture.
In muscle tissue weight prediction, the weight and the correlation of subcutaneous fat in the leg showed a high r2,
which was expected because the animals had excellent
Cut Regression Coefficient of determination Probability
Leg
Total fat Y^ = 2.93 + 1.52X 0.71 0.0001
Subcutaneous fat Y^ = 0.84 + 0.68X 0.63 0.0001
Intramuscular fat Y^ = 3.85 + 1.87X 0.30 0.0051
Loin
Total fat Y^ = 1.72 + 0.57X 0.52 0.0001
Subcutaneous fat Y^ = 1.39 + 0.34X 0.51 0.0001
Intramuscular fat Y^ = –5.95 + 4.27X – 0.44X2 + 0.015X3 0.49 0.0030
Ribs
Total fat Y^ = 15.92 – 2.73X + 0.25X2 – 0.006X3 0.85 0.0001
Subcutaneous fat Y^ = 1.65 + 0.47X 0.46 0.0003
Intramuscular fat Y^ = 2.42 + 0.42X 0.85 0.0001
Shoulder
Total fat Y^ = 1.80 + 0.83X 0.73 0.0001
Subcutaneous fat Y^ = 1.73 + 0.36X 0.44 0.0004
Intramuscular fat Y^ = 1.99 + 0.77X 0.47 0.0002
Neck
Total fat Y^ = 4.31 + 0.53X 0.67 0.0001
Subcutaneous fat Y^ = 2.85 0.14 0.0693
Intramuscular fat Y^ = 3.50 + 0.39X 0.62 0.0001
Y^ = dependent variable (adipose tissue in the carcass); X = independent variable (weight of adipose tissue in the cuts).
carcass conformation for meat production, especially in the posterior region. Similar results were obtained by Malan (2000) for Boer goats that, according to Oman et al. (1999), have transmitted the productive characteristics of this race to the crossbred animals. Regarding subcutaneous fat, when the animals grow and reach physiological maturity, greater amounts of fat are externally deposited on the skin (Cezar & Sousa, 2007) and, in goats, particularly animals for meat, this adipose tissue is less thick or scarce (Monte et al., 2007).
It is worthy to consider that the results of yield prediction and correlation of bone tissue of the shoulder with the carcass can be caused by the following aspects: early development of bone tissue (Osório et al., 2001) and the cut (Furusho-Garcia et al., 2006), less variation in bone tissue in the carcass and also because of the earlier development of front limb bones compared to the posterior limb bones (Cezar & Sousa, 2007).
Cut yield Carcass yield
Muscle Probability Fat Probability Subcutaneous Probability Internal Probability Bone Probability
fat fat
Muscle
Leg 0.674 0.0003 -0.379 0.0678NS -0.420 0.0414 -0.307 0.144NS -0.415 0.0434
Loin 0.624 0.0011 -0.610 0.0016 -0.471 0.0200 -0.590 0.0025 -0.015 0.9613NS
Ribs 0.916 0.0001 -0.740 0.0001 -0.503 0.0123 -0.746 0.0001 -0.240 0.2583NS
Shoulder 0.810 0.0001 -0.570 0.0037 -0.527 0.0082 -0.508 0.0111 -0.334 0.1101NS
Neck 0.594 0.0022 -0.375 0.0709NS -0.230 0.2810NS -0.390 0.0600NS -0.307 0.1441NS
Fat
Leg -0.595 0.0021 0.844 0.0001 0.760 0.0001 0.764 0.0001 -0.369 0.0761NS
Loin -0.617 0.0013 0.725 0.0001 0.627 0.0010 0.670 0.0003 -0.166 0.4377NS
Ribs -0.659 0.0005 0.902 0.0001 0.572 0.0035 0.929 0.0001 -0.362 0.0825NS
Shoulder -0.684 0.0002 0.860 0.0001 0.869 0.0001 0.734 0.0001 -0.264 0.2124NS
Neck -0.621 0.0012 0.824 0.0001 0.616 0.0014 0.804 0.0001 -0.302 0.1510NS
Subcutaneous fat
Leg -0.571 0.0035 0.835 0.0001 0.798 0.0001 0.735 0.0001 -0.390 0.0597NS
Loin -0.433 0.0346 0.369 0.0763NS 0.718 0 .0001 0.153 0.4752NS 0.085 0.6909NS
Ribs -0.285 0.1770NS 0.443 0.0301 0.680 0.0003 0.270 0.2026NS -0.233 0.2732NS
Shoulder -0.481 0.0172 0.574 0.0034 0.663 0.0004 0.452 0.0026 -0.140 0.5122NS
Neck 0.006 0.9779NS 0.315 0.1333NS 0.377 0.0693NS 0.240 0.2568NS -0.463 0.0227
Intramuscular fat
Leg -0.430 0.0360 0.567 0.0039 0.427 0.0375 0.552 0.0051 -0.205 0.3354NS
Loin -0.385 0.0631NS 0.537 0.0067 0.223 0.2944NS 0.608 0.0016 -0.226 0.2883NS
Ribs -0.627 0.0010 0.843 0.0001 0.412 0.0453 0.924 0.0001 -0.320 0.1267NS
Shoulder -0.583 0.0028 0.763 0.0001 0.690 0.0002 0.690 0.0002 -0.270 0.2080NS
Neck -0.637 0.0008 0.800 0.0001 0.579NS 0.0030 0.791 0.0001 -0.246 0.2470NS
Bone
Leg -0.374 0.0715NS -0.090 0.6764NS 0.003 0.9893NS -0.120 0.5758NS 0.664 0.0004
Loin -0.249 0.2407NS 0.127 0.5530NS 0.037 0.8651NS 0.153 0.04754 0.170 0.4249NS
Ribs -0.157 0.4644NS -0.376 0.0701NS -0.110 0.3498NS -0.404 0.0500 0.766 0.0001
Shoulder -0.184 0.3894NS -0.361 0.0824NS -0.430 0.0360 -0.279 0.1874NS 0.785 0.0001
Neck 0.001 0.9635NS -0.393 0.0573NS -0.340 0.1030NS -0.362 0.0817NS 0.554 0.0050
NS = non-significant.
Table 7 - Coefficients of correlation between the yields of carcass tissues and tissues of cuts of crossbred F1 goats (Boer with females of non defined racial standard) finished on native pasture
Conclusions
Prediction of muscle weight in the carcass can be performed by the equation used to estimate the weight of this tissue in the leg, loin, ribs and shoulder cuts. For the weight and yield of subcutaneous fat in the carcass, the equation used to estimate the weight of this tissue in the leg is recommended. Considering the values obtained for the coefficient of determination, ribs are the cut that provide the best estimate for the yield of total muscle and fat in the carcass of crossbred F1 goats (Boer with females of non defined racial standard) finished on native pasture with four levels of supplementation.
References
AGRICULTURAL FOOD AND RESEARCH COUNCIL – AFRC.
ARGUËLLO, A.; CAPOTE, J.; GINE´S, R. et al. Pediction of kid carcass composition by use of joint dissection. Livestock Science, v.67, p.293-296, 2001.
CARVALHO, P.A.; SANCHEZ, L.M.B.; PIRES, C.C. et al. Predição da composição física e química da carcaça a partir da composição das diferentes regiões corporais de bezerros machos de origem leiteira até os 110 dias de vida. Revista Brasileira de Zootecnia, v.32, n.6, p.1500-1507, 2003.
CEZAR, M.F.; SOUSA, W.H. Carcaças caprinas e ovinas: obtenção, avaliação e classificação. Uberaba: Agropecuária Tropical, 2007. 231p.
FURUSHO-GARCIA, I.F.; PEREZ, J.R.O.; BONAGURIO, S. et al. Estudo alométrico dos cortes de cordeiros Santa Inês puros e cruzas. Revista Brasileira de Zootecnia, v.35, n.4, p.1416-1422, 2006.
MACEDO, F.A.F.; SIQUEIRA, E.R.; MARTINS, E.N. et al. Qualidade de carcaça de cordeiros Corriedale, Bergamácia x Corriedale e Hampshire Dow x Corriedale terminados em pastagem e confinamento. Revista Brasileira de Zootecnia,
v.29, n.5, p.1520-1527, 2000.
MALAN, S.W. The improved Boer goat. Small Ruminant Research, v.36, p.65-170, 2000.
MONTE, A.L.S.; SELAIVE-VILLARROEL, A.B.; PÉREZ, J.R.O. et al. Rendimento de cortes comerciais e composição tecidual da carcaça de cabritos mestiços. Revista Brasileira de Zootecnia, v.36, n.6, p.2127-2133, 2007.
MORAND-FEHR, P. Growth. In: GALL, C. (Ed.) Goat production. London: Academic Press, 1981. p.253-283.
OMAN, J.S.; WALDRON, D.F.; GRIFFIN, D.B. et al. Effect of breed-type and feeding regimen on goat carcass traits. Journal Animal Science, v.77, p.3215-3218, 1999.
OSÓRIO, J.C.S.; OSÓRIO, M.T.M. Produção de carne ovina: técnicas de avaliação in vivo e na carcaça. Pelotas: Universidade Federal de Pelotas, 2005. 82p.
OSÓRIO, M.T.M.; OSÓRIO, J.C.S.; JARDIM, R.D. et al. Desenvolvimento de cordeiros da raça Corriedale criados em distintos sistemas. Revista Brasileira de Agrociência, v.7, n.1, p.46-49, 2001.
PEREIRA FILHO, J.M.; RESENDE, K.T.; TEIXEIRA, I.A.M.A. et al. Características da carcaça e alometria dos tecidos de cabritos F1 Boer x Saanen. Revista Brasileira de Zootecnia, v.37, n.5, p.905-912, 2008.
PINHEIRO, R.S.B.; SOBRINHO, A.G.S.; YAMAMOTO, S.M. et al. Composição tecidual dos cortes da carcaça de ovinos jovens e adultos. PesquisaAgropecuária Brasileira, v.42, n.4, p.565-571, 2007.
ROSA, G.T.; PIRES, C.C.; SILVA, J.H.S. et al. Crescimento alométrico de osso, músculo e gordura em cortes da carcaça de cordeiros Texel segundo os métodos de alimentação e peso de abate.
Ciência Rural, v.35, n.4, p.870-876, 2005.
SANZ SAMPELAYO, M.R. Factores nutritivos que determinan la calidad de las canales caprinas. Análisis de su clasificación. In: JORNADAS SOBRE TECNOLOGÍA DE VALORACIÓN DE CANALES Y CARNESY DEFENSA DE LA CALIDAD DE LOS PRODUCTOS GANADEROS - ZAFRA 92, 1992, Spain. Proceedings... Spain, 1992.
SILVA, L.F.; PIRES, C.C. Avaliações quantitativas e predição das proporções de osso, músculo e gordura da carcaça em ovinos.
Revista Brasileira de Zootecnia, v.29, n.4, p.1253-1260, 2000. SILVA, R.M.; PEREIRA FILHO, J.M.; SILVA, A.L.N. et al. The effect of supplementation on the tissue composition of the commercial cuts of cross-bred F1 (Boer x SPRD) finished in native pasture. Revista Brasileira de Zootecnia, v.39, n.6, p.1353-1358, 2010.
STATISTICAL ANALYSIS SYSTEMS - SAS. 11.ed. Verona, Italy: Roberto Giacobazzi, SASInstitute, 2004. 393p.
TEIXEIRA, A.; AZEVEDO, J.; DELFA, R. et al. Growth and development of Serrana kids from Montesinho Natural Park (NE of Portugal). Small Ruminant Research, v.16, p.263-269, 1995. WARMINGTON, B.G.; KIRTON, A.H. Genetic and non-genetic influences on growth and carcass traits of goats. S m a l l R u m i n a n t R e s e a rc h, v.3, p.147-165, 1990.
YAMOMOTO, S.M.; MACEDO, F.A.F.; MEXIA, A.A. et al. Rendimentos dos cortes e não-componentes das carcaças de cordeiros terminados com dietas contendo diferentes fontes de óleo vegetal. Ciência Rural, v.34, n.6, p.1909-1913, 2004. YÁÑEZ, E.A.; RESENDE, K.T.; FERREIRA, A.C.D. et al. R e s t r i ç ã o a l i m e n t a r e m c a p r i n o s : r e n d i m e n t o , c o r t e s comerciais e composição da carcaça. R e v i s t a B r a s i l e i r a de Zootecnia, v.35, n.5, p.2093-2100, 2006.