Ricardo Alexandre Ventura das Chagas
Mestre em Viticultura e Enologia
Protein haze formation in white wines:
from mechanism to resolution
Dissertação para obtenção do Grau de Doutor em Química Sustentável
Orientador: Professor Ricardo Boavida Ferreira, professor catedrático, ISA - ULisboa Co-orientador: Professora Luísa Maria Ferreira, professora auxiliar, FCT - UNL
Protein haze formation in white wine: from mechanism to resolution.
Copyright © Ricardo Alexandre Ventura das Chagas, Faculdade de Ciência e Tecnologia, Universidade NOVA de Lisboa.
A Faculdade de Ciências e Tecnologia e a Universidade Nova de Lisboa têm o direito, perpétuo e sem limites geográficos, de arquivar e publicar esta dissertação através de exemplares impressos reproduzidos em papel ou de forma digital, ou por qualquer outro meio conhecido ou que venha a ser inventado, e de a divulgar através de repositórios científicos e de admitir a sua cópia e distribuição com objetivos educacionais ou de investigação, não comerciais, desde que seja dado crédito ao autor e editor.
i
Acknowledgements
Durante os últimos quatro anos tive a oportunidade de realizar um grande objectivo pessoal, tirar o Doutoramento. Tive a sorte de estar rodeado por pessoas que me apoiaram muito, me motivaram, me fizeram querer aprender mais e principalmente crescer. Foram quatro anos que mudaram a minha vida; conheci muitas pessoas de ramos completamente diferentes, trabalhei em três universidades, aprendi um grande conjunto de técnicas e consegui consolidar bastantes conhecimentos.
Sou engenheiro alimentar de base, mas de momento, sinto-me parte engenheiro, parte químico, parte enólogo, parte bioquímico. Atribuo a “culpa” disto não só a mim, à minha maneira de pensar e de abraçar os problemas, mas também às pessoas que me acompanharam nesta aventura e que tanto contribuíram para ser o que sou. Apesar de ter a tese escrita em inglês, os agradecimentos serão feitos em português (aos portugueses) para que não se perca informação com eventuais traduções.
Em primeiro lugar, um agradecimento especial às duas pessoas que me acompanharam desde o início neste trabalho, os meus orientadores. Ao Professor Ricardo Boavida Ferreira pelo apoio, disponibilidade, pelas longas conversas sobre proteínas, vinho, entre outros variados temas. Deu-me oportunidade de continuar um trabalho que vinha a ser desenvolvido no nosso laboratório há já vários anos e também a possibilidade de mudar o rumo desse mesmo trabalho. Um agradecimento muito especial à Professora Luísa Ferreira por todo o apoio, amizade e paciência ao longo destes anos. Receber alguém de uma área totalmente diferente, com outra linguagem e forma de trabalhar, já é de si difícil. Ajudou-me, acompanhou-me, abriu-me os horizontes e empurrou-me para fora de pé em inúmeras situações. Isso foi algo que mudou por completo a minha maneira de estar e de trabalhar. Muito obrigado por tudo.
À Professora Ana Lourenço, por todo o carinho, disponibilidade e vontade de ajudar em tudo o que fosse preciso. Muito obrigado.
Ao Professor César Laia, que começou a trabalhar comigo para me ajudar num ensaio de DLS e acabou a trabalhar comigo praticamente até ao final do trabalho. Aprendi muito com ele, mesmo que por vezes estivéssemos na mesma conversa a falar duas linguagens diferentes. Muito obrigado pelo apoio e amizade.
À Bacalhoa Vinhos por ceder as amostras de vinho que usei durante o meu Mestrado e início do Doutoramento. Ao José Caninhas e ao Filipe Cardoso da Quinta do Piloto por cederem as uvas para a produção dos vinhos usados na última parte da minha tese. Ao David Ferreira pela amizade e por todas as “discussões enológicas” à volta do tema.
ii
À Doutora Paula Pinto pela oportunidade de trabalhar no RAIZ e ao José Carlos por toda a ajuda na produção das folhas.
À Professora Paula Branco, Professora Manuela Pereira, Professora Sara Monteiro, Professor Manuel Malfeito Ferreira, Professora Catarina Prista, Professora Jorge Ricardo da Silva, Professora Isabel Coelhoso, muito obrigado pela ajuda, motivação e amizade.
Aos meus colegas de enologia que estão a fazer os vinhos que alegram muitos almoços, jantares e fins de tarde por todo o mundo.
Dado que o meu tempo foi partilhado entre o Laboratório 202 e 205 do DQ (FCT) e o Laboratório de Fisiologia Vegetal (ISA), muitas pessoas influenciaram o meu trabalho e vida pessoal. À Catarina Fonseca, Luís Batista (que me ajudou muito no início do meu trabalho, ainda antes de começar o meu mestrado), Regina Freitas, Isabel Silva, Ana Cristina, Diana, Carla, Sara Santos, Ana Lima, João Fernandes, Maria João, João Graça, Senhor António e todo o resto da equipa. Obrigado pela ajuda e principalmente pela amizade. Do lado dos “químicos”, obrigado ao Diogo, Fausto, Carlos, Sequeira, Catarina, Luís, Sara, Daniela, Edgar, Marina, Cátia, Rita Otrelo e a todos os outros (que foram muitos) que me acompanharam. Ao pessoal do laboratório de análises, Nuno, Carla (obrigado pelas análises “para ontem”), Luz, Elisabete (obrigado pelas noitadas a olhar para o CD), Ana Teresa e Cecília.
Um obrigado muito especial a duas pessoas que me ajudaram com muitas dúvidas de química, muitas dúvidas existenciais, mas principalmente pela amizade e companhia ao longo desta aventura. Luísa Carvalho e Patrícia Máximo.
Um obrigado gigante a um grupo de amigos que me acompanham no meu dia a dia, aos quais agradeço não só a amizade, os bons concelhos (e maus), paciência (!) mas também a capacidade que têm e tiveram de me ajudar a relativizar vários problemas. Ao Alex, Bento, João, Rita e Carla. Muito, muito obrigado por tudo.
To Professor Thomas Heinze for his availability to welcome me in his laboratory and for the chance to work with him. It was an awesome experience not only because I had the opportunity to learn with some of the experts in the area but also the experience of living in a new country. To Martin and Andreas for all the help and friendship during my stay in the group. Thank you! To Marcus, Konrad, Lars, Robert and Peter for the help in the lab and for the friendship during my stay in the group.
Quero agradecer aos responsáveis por estar aqui hoje, aos meus pais. Por acreditarem em mim, por estarem sempre do meu lado e por todo o amor que me dão diariamente. Quaisquer palavras não chegam para agradecer o vosso apoio e tudo o que fizeram por mim.
iii Por fim, à pessoa que me atura todos os dias, que me apoia em tudo, que me motiva, me impulsiona a seguir os meus sonhos e me ama, à Maura. Sem ti, tudo isto tinha sido muito mais difícil. Obrigado por acreditares em mim, por seres um exemplo e por me apoiares sempre nas minhas maluqueiras. Amo-te.
v
Funding
This work was supported by the Associate Laboratory for Green Chemistry LAQV which is financed by national funds from FCT/MEC (UID/QUI/50006/2013) and co-financed by the ERDF under the PT2020 Partnership Agreement (POCI-01-0145-FEDER - 007265). This work was also supported by Fundação para a Ciência e a Tecnologia (FCT) under the PhD grant SFRH/BD/84749/2012 and by the National NMR Facility supported by Fundação para a Ciência e a Tecnologia (RECI/BBB-BQB/0230/2012).
vii
I have not failed 700 times. I have not failed once. I have succeeded in proving that those 700 ways will not work.
Thomas Edison
Wine is grape-juice. Every drop of liquid filling so many bottles has been drawn out of the ground by the root of a vine. All these different drinks have at one time been sap in a stick. It is the first of many strange and some – despite modern research – mysterious circumstances which go to make wine not only the most delicious, but the most fascinating drink in the world.
ix
Abstract
Wine clarity is an important oenological feature affected by the presence of undissolved matter in the wine. One of the reasons for a wine to turn turbid relies on the insolubilization and aggregation of residual proteins that remain in wine after the fermentation process by a phenomenon commonly known as protein haze. This phenomenon usually occurs after exposure to heat stress during inappropriate shipping and storage conditions
Despite the extensive research performed during the last decades, the multifactorial mechanism responsible for white wine protein haze formation is not fully characterized. After testing different metabolites and model wine solutions containing different protein fractions, a new model is proposed based on the experimental identification of sulfur dioxide as the non-proteinaceous factor that induces white wine protein haze formation upon heating. Unlike other reducing agents, addition of sulfur dioxide to must/wine upon heating cleaves intraprotein disulfide bonds, hinders thiol-disulfide exchange during protein interactions and leads to formation of novel interprotein disulfide bonds. The formation of these new bonds together with hydrophobic interactions between unstable proteins are ultimately responsible for wine protein aggregation following a nucleation-growth kinetic model. The model was tested in wine model solution and validated under real wine conditions.
To avoid protein haze formation in white wine, winemakers remove these unstable proteins from solution with bentonite, a negatively charged clay than adsorbs positive proteins from wine by ion exchange. Though effective, the addition of this product presents many drawbacks like negative impact on the organoleptic characteristics of wine or high lees formation leading on wine loss and waste formation. With the aim of producing a bentonite alternative, we synthesized and characterized a new crosslinked polymer that can remove wine proteins in an in-line manner using it as a processing aid (filter) or as an additive (powder). The produced polymer was tested using model proteins and some preliminary tests validated that this material can be used to remove proteins from wine at laboratory scale.
Keywords
xi
Resumo
A limpidez é uma característica enológica de grande importância para a aceitação de um vinho por parte do consumidor a qual é particularmente afectada pela presença de matéria em suspensão. Uma das razões para um vinho ficar turvo está relacionada com a agregação e precipitação de proteínas que permanecem no vinho após a fermentação. Este fenómeno é designado por turvação proteica e é causado após exposição do vinho a temperaturas elevadas durante o seu transporte ou armazenamento.
Apesar da extensa pesquisa realizada durante as últimas décadas, o mecanismo multifactorial responsável pela formação de turvação proteica em vinho branco não está totalmente caracterizado. Após testar diferentes metabolitos e soluções modelo contendo diferentes fracções de proteína, é proposto um novo modelo com base na identificação experimental do dióxido de enxofre como factor indutor de turvação proteica após exposição ao calor. Ao contrário de outros agentes redutores, a adição de dióxido de enxofre ao mosto/vinho (e posterior aquecimento) provoca a redução de ligações dissulfureto intra-proteína, dificulta a troca tiol-dissulfureto durante interacções proteicas e leva à formação de novas ligações dissulfureto inter-proteína na fase de arrefecimento. A formação destas novas ligações, juntamente com interacções hidrofóbicas entre as proteínas instáveis são, em última instância, responsáveis pela agregação das proteínas no vinho. Este novo modelo de turvação envolvendo SO2 foi testado em solução
modelo e validado em condições reais com vinho.
Para evitar a formação de turvação proteica em vinhos brancos, é prática comum, os enólogos removerem do meio as proteínas potencialmente instáveis recorrendo à adição de bentonite, uma argila com carga negativa ao pH do vinho que adsorve proteínas de carga positiva por permuta iónica. Embora seja bastante eficaz, a adição desta argila apresenta muitas desvantagens como o impacto negativo nas características organolépticas do vinho, a perda de vinho e a produção de resíduos devido à formação de borras após a sua adição. Com o objectivo de desenvolver uma alternativa à bentonite, sintetizámos um novo polímero reticulado que tem a capacidade de adsorver as proteínas do vinho ao ser usado como um auxiliar de processamento (como filtro ou pó). Este novo polímero foi testado com proteínas modelo e, testes preliminares usando vinho da casta Moscatel, validaram a sua capacidade para remover proteínas de vinho à escala laboratorial.
Palavras-chave
xiii
Contents
LIST OF FIGURES ... XVII LIST OF TABLES ... XXIII
1. MOTIVATION ... 1
1.1 BACKGROUND ... 1
1.2 QUESTIONS AND GOALS ... 3
2. INTRODUCTION ... 5
2.1 PROTEIN INSTABILITY ... 5
2.2 PURIFICATION AND CHARACTERIZATION OF HAZE-FORMING PROTEINS IN WINES ... 7
2.3 OTHER NON-PROTEINACEOUS FACTORS THAT MODULATE PROTEIN HAZE FORMATION IN WINES ... 9
2.4 REVIEW ON THE MECHANISM OF PROTEIN HAZE FORMATION ... 13
2.5 WINE PROTEIN STABILIZATION ... 14
3. PROTEIN HAZE FORMATION MECHANISM IN WHITE WINES. ... 19
3.1 ISOLATION AND IDENTIFICATION OF THE COMPOUNDS PRESENT IN WHITE WINE PROTEIN AGGREGATES AFTER ALKALINE HYDROLYSIS. ... 21
3.1.1 Background ... 23
3.1.2 Objective ... 24
3.1.3 Results and discussion ... 24
3.1.3.1 Protein haze sediment ... 24
3.1.3.2 Qualitative analysis of the compounds present in the white wine sediment ... 24
3.1.3.3 Isolation and identification of the compounds present in the ethyl acetate soluble fraction of the alkaline hydrolysed white wine sediment. ... 25
3.1.3.4 Quantification of caffeic acid in the untreated wine ... 27
3.1.3.5 Does the presence of caffeic acid (1) in the heat-induced wine sediment warrant its identification as a modulating factor in protein haze formation? ... 28
3.1.4 Conclusion ... 31
3.2 MOTIVATION TO CHANGE THE WINE MODEL SOLUTION ... 33
3.3 THE CHALLENGING SO2-MEDIATED CHEMICAL BUILD-UP OF PROTEIN AGGREGATES IN WINES. ... 37
3.3.1 Background ... 39
3.3.2 Objective ... 40
3.3.3 Results and discussion ... 40
3.3.3.1 Interaction of SO2 with wine total proteins ... 40
3.3.3.2 Interaction of SO2 with protein fractions differing in hydrophobicity ... 42
3.3.3.3 Effect of protein reduction on wine total protein aggregation ... 47
xiv
3.3.3.5 Structural studies on iTLP aggregates ... 63
3.3.3.6 Effect of SO2 addition on protein haze formation under real wine conditions... 70
3.3.3.7 Updated mechanism for wine protein haze formation ... 74
3.3.4 Conclusions ... 75
4. FINDING A BENTONITE ALTERNATIVE – DEVELOPMENT OF A NEW POLYMER TO REMOVE UNSTABLE PROTEINS FROM WHITE WINES ... 79
4.1 SYNTHESIS AND STRUCTURAL CHARACTERIZATION OF DICARBOXYMETHYLCELLULOSE ... 81
4.1.1 Introduction ... 83
4.1.1.1 Synthesis of cellulose derivatives ... 85
4.1.1.2 Cellulose ethers ... 86
4.1.1.3 Applications in Food Products ... 88
4.1.1.4 Cellulose derivatives as ion exchangers ... 89
4.1.1.5 Cellulose based ion exchangers in the wine industry ... 90
4.1.2 Objective ... 92
4.1.3 Results and discussion ... 92
4.1.3.1 Synthesis of dicarboxymethyl cellulose ... 92
4.1.3.2 Structure elucidation of DCMC ... 97
4.1.3.3 Acetylation of DCMC ... 104
4.1.3.4 Infrared analysis of DCMC ... 107
4.1.3.5 X-ray analysis of DCMC and Avicel ... 108
4.1.3.6 DCMC degree of substitution (DS) ... 110
4.1.3.7 DCMC degree of polymerization (DP) and intrinsic viscosity ... 114
4.1.3.7.1 Size exclusion chromatography (SEC) ... 114
4.1.3.7.2 Viscosity measurements ... 115
4.1.4 Conclusions ... 117
4.2 PRODUCTION OF A WATER-INSOLUBLE FORM OF DCMC FOR THE ADSORPTION AND REMOVAL OF POSITIVE PROTEINS FROM A SOLUTION ... 119
4.2.1 Introduction ... 121
4.2.2 Objective ... 122
4.2.3 Results and discussion ... 122
4.2.3.1 First approach in the synthesis and production of DCMC films ... 122
4.2.3.1.1 Polymer preparation ... 122
4.2.3.1.2 Crosslinked sodium DCMC films preparation ... 124
4.2.3.1.3 Protein adsorption on the crosslinked NaDCMC films ... 124
4.2.3.2 Second approach in the synthesis and production of DCMC films ... 126
4.2.3.2.1 Polymer preparation ... 126
4.2.3.2.2 Films preparation ... 127
4.2.3.2.3 Cytochrome c (cytc) adsorption on the crosslinked NaDCMC ... 130
4.2.3.2.4 Isolated wine protein adsorption on crosslinked NaDCMC ... 133
xv
4.2.3.2.6 Synthesis cost analysis ... 136
4.2.4 Conclusion ... 137
4.3 PRODUCTION OF A CELLULOSE MEMBRANE FILTER CONTAINING DCMC POLYMER FOR IN-LINE FILTRATION AND REMOVAL OF SOLUBLE PROTEINS. ... 139
4.3.1 Objective ... 141
4.3.2 Results and discussion ... 141
4.3.2.1 Polymer synthesis ... 141
4.3.2.2 Production of cellulose sheets with added DCMC ... 145
4.3.2.3 Evaluation of the ion exchange capacity of the filter sheets containing DCMC ... 146
4.3.2.4 Removal of soluble proteins from wine with cellulose/DCMC membrane ... 150
4.3.3 Conclusions ... 151
5. GENERAL CONCLUSIONS ... 153
6. EXPERIMENTAL ... 157
6.1 REAGENTS AND STANDARDS ... 157
6.2 EQUIPMENT ... 157
6.3 BIOLOGICAL MATERIALS ... 158
6.4 DYNAMIC LIGHT SCATTERING (DLS) ... 159
6.5 SULFUR DIOXIDE QUANTIFICATION ... 159
6.6 PROTEIN INSTABILITY TEST ... 159
6.7 PROTEIN HAZE SEDIMENT ISOLATION ... 160
6.8 ALKALINE HYDROLYSIS OF WINE PROTEIN SEDIMENTS ... 160
6.9 RP-HPLC-DAD INSTRUMENTATION ... 160
6.10 SEPARATION OF ISOLATED WINE PROTEINS BY HYDROPHOBIC INTERACTION CHROMATOGRAPHY (HIC) ... 161
6.11 SIZE EXCLUSION CHROMATOGRAPHY (SEC) ... 161
6.12 SYNTHETIC ROUTE FOR CAFTARIC ACID (6) ... 162
6.13 ANALYSIS OF THE PROTEIN SECONDARY STRUCTURE BY CIRCULAR DICHROISM (CD) ... 163
6.14 FLUORESCENCE SPECTROSCOPY ... 163
6.15 STATISTICAL ANALYSIS ... 163
6.16 DTNB ASSAY ... 163
6.16.1 DTBN assay of protein without heat stress ... 164
6.16.2 DTNB assay of heat stressed protein ... 164
6.17 SYNTHESIS OF 2-BROMOMALONIC ACID (BMA) AND SODIUM 2-BROMOMALONATE (11) ... 166
6.18 SYNTHESIS OF DICARBOXYMETHYLCELLULOSE IN ISOPROPANOL/AQUEOUS NAOH ... 166
6.19 ACETYLATION OF DCMC ... 168
6.20 FORMYLATION OF DCMC ... 169
6.21 SODIUM CONTENT DETERMINATION BY ICP-AES... 169
xvi
6.23 SIZE EXCLUSION CHROMATOGRAPHY (SEC) OF DCMC ... 170
6.24 ANION EXCHANGE CHROMATOGRAPHY (AE-HPLC) ... 170
6.25 X-RAY DIFFRACTION (XRD) ... 170
6.26 DCMC FILM PREPARATION ... 170
6.27 DCMC FILM CROSSLINKING ... 171
7. REFERENCES ... 172
xvii
List of figures
Figure 1- Schematic representation of what wrong storage or shipping, by exposure of wine to high temperatures, may induce to wine unstable protein. Left) white wine prior to heat; Right) the same wine after heat stress. ... 1
Figure 2 - Temperature profile of a wine shipment from California to Illinois during summer. Measured 4
. Unprotected – Temperature floctuations registered on top of the pallets above the thermal blanket. Protected – Temperature fluctuations registered below the insulation (thermal blanket). ... 6
Figure 3 - Detail of the differences in loop regions of Domain I between protein I/4L5H chain A (purple) and protein F2/4JRU (in blue) 24
. ... 9
Figure 4 - Revised unfolding and aggregation mechanism of heat-unstable proteins in wine 5
. ... 13
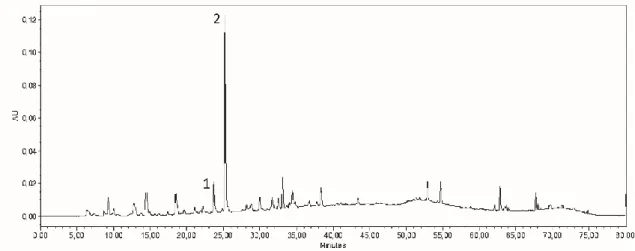
Figure 5 - Chromatogram of the ethyl acetate soluble fraction obtained by liquid-liquid extraction of the hydrolyzed wine protein precipitate monitored at 320 nm. The collected peaks are identified as 1 and 2. 25
Figure 6 - 1
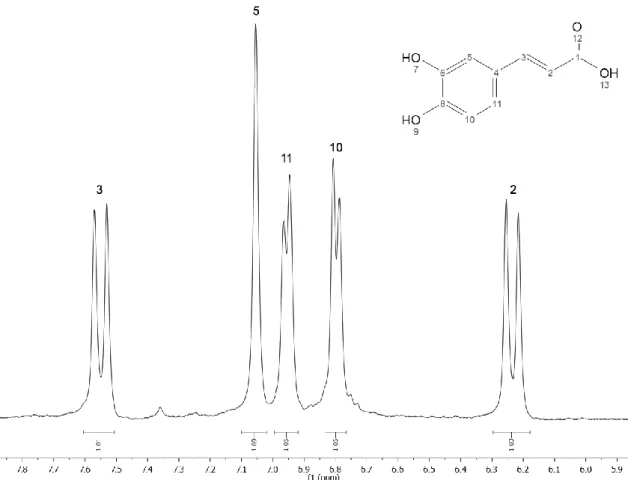
H NMR spectrum in CD3OD of caffeic acid isolated from fraction #2. ... 26
Figure 7 - Synthetic route adopted for the synthesis of caftaric acid (6). ... 28
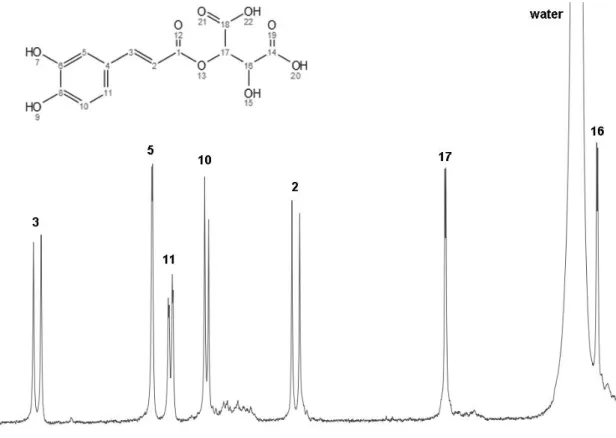
Figure 8 - 1
H NMR spectrum in CD3OD of caftaric acid (6) after isolation by RP-HPLC. ... 29
Figure 9 - The interaction of SO2 with hydrogen peroxide and quinones following catechol oxidation, so
preventing oxidation of ethanol by the Fenton reaction 144
. ... 34
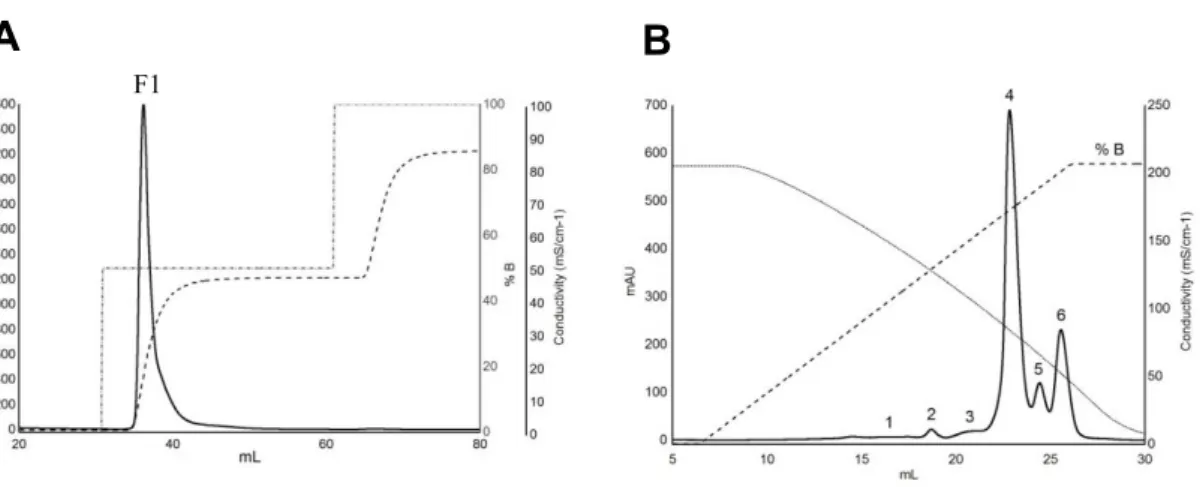
Figure 10 - (A) Cation exchange chromatogram of Moscatel of Alexandria wine sample on a Resource S (5 mL) column (6 mL/min flow rate). Loading and washing steps were omitted for clarity. Approximately 1 L of wine was loaded onto the column (ca. 100 mg protein). The total wine protein fractions were pooled (T1 fraction) based on the elution profile monitored at 280 nm. (B) Effect of increasing total SO2
concentration (added as NaHSO3) in the wine model solution on the haze produced after the heat stability
test. The wine model solution consisted of 100 mg/L total wine protein (T1 fraction), 12% (v/v) ethanol, 5 g/L tartaric acid, pH 3.2. ... 41
Figure 11 - (A) HIC chromatogram of the total wine protein previously isolated by cation exchange chromatography (Figure8). Abbreviated names were assigned to HIC individual protein fractions and correspond to the numbered peaks eluted from the HIC column preceded by an ‘H’. HIC was performed on a Phenyl Superose HR 5/5 column. Lyophilized protein was dissolved in 25 mM K2HPO4 containing 1.25
mM (NH4)2SO4, pH 7.0, prior to loading. (B) Protein content (mg) and the proportion it represents relative
to total protein in the chromatogram (%) for each fraction (H1–H7) obtained after HIC (A). ... 42
Figure 12 - (A) Haze development after heat stability test of the isolated HIC fractions (adjusted to 100 mg/L protein) in two model wine solutions. Control: no added SO2. SO2: model wine solution containing
120 mg/L total SO2 (added as NaHSO3). H3–H6 indicate protein fractions obtained by HIC separation as
shown in Figure 11A. Means not sharing the same letter are significantly different (OneWay-ANOVA, Fisher LSD, P < 0.05). (B) Visualization of the haze produced after heat stability test of HIC fractions H3–
xviii
H6 in model wine solutions with and without added SO2. Cuvettes represented in the picture correspond to
the ones used in the experiment described in (A). ... 44
Figure 13 - A) Cation exchange chromatogram of Moscatel of Alexandria (2014) wine sample on a Resource S (6 mL) column (6 mL/min flow rate). Loading and washing steps were omitted for clarity. Approximately 0.5 L of wine was loaded onto the column. The total wine protein fractions were pooled (F1 fraction) based on the elution profile monitored at 280 nm. B) HIC chromatogram of the total wine protein previously isolated by cation exchange chromatography (Figure 13A). Abbreviated names were assigned to HIC individual protein fractions and correspond to the numbered peaks eluted from the HIC column preceded by an ‘H’. HIC was performed on a Phenyl Superose HR 5/5 column. Lyophilized protein was dissolved in 30 mM sodium citrate containing 1.25 M ammonium sulfate, pH 3.0, prior to loading. ... 45
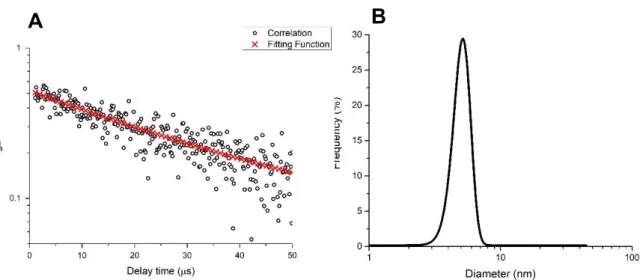
Figure 14 – A) Autocorrelation curve acquired by DLS nanoanalysis of the protein fraction H4 (native state) in wine model solution at 25 °C. B) Size distribution frequency acquired by DLS nanoanalysis (represented as the protein diameter in nm) of the iTLP (native state) in wine model solution before heat stress. ... 47
Figure 15 - Effect of TCEP or NaHSO3 on the haze produced after heat stability test in a wine model
solution. Final concentrations are indicated in the X-axis labels. The model solution consisted of 100 mg/L total wine protein (F1 fraction, Figure 13A), 12% (v/v) ethanol, 5 g/L tartaric acid and pH 3.2. ... 49
Figure 16 - Dependence of particle diameter on time and temperature for the aggregation of iTLP (at 500 mg L-1
) in model wine solution containing SO2 (at 600 mg L -1
). The count rate is represented by (o) and the measured diameter by (x). The time required to decrease the temperature from 70 to 15 °C (i.e. 8 min) is represented by the vertical dashed lines. ... 52
Figure 17 - A) Dependence of hydrodynamic diameter on time for aggregation of protein iTLP (solid line). Also represented are the peaks of the size distributions of B) including: (■) first, (□) second, (●) third aggregated forms. Horizontal lines correspond to the average particle size of these forms. B) Distribution of particle size registered at different times of iTLP at 15 °C after heat stress. ... 53
Figure 18 - Dependence of light scattering intensity on time for aggregation of iTLP with Boltzmann curve fitting. ... 55
Figure 19 – Absorption spectra of iTLP during CD analysis. A) iTLP in model wine solution (absence of SO2). B) iTLP in model wine solution in the presence of SO2. Temperatures of 20 °C (prior to heat stress),
70 °C (after 120 min at 70 °C) and 15 °C (after 60 min at 15 °C following heat stress at 70 °C) are highlighted in blue, orange and green respectively. The remaining spectra gathered during the trial are represented as solid grey lines. ... 57
Figure 20 – A) CD spectra of iTLP (at 500 mg L-1
) in model wine solution (absence of SO2). B) CD spectra
of iTLP in model wine solution in the presence of SO2 (at 600 mg L-1). Spectra corresponding to
temperatures of 20 °C, 70 °C and 15 °C are represented in blue, orange and green, respectively. The different spectra gathered during the time window of the trial are represented as solid grey lines. ... 58
xix Figure 21 – Changes in molar ellipticity of iTLP at 222 nm. The temperature gradient consisted of 10 o
C increments in the temperature range between 20 and 70 °C. Within parenthesis is represented the time at which the protein was at that temperature. ... 60
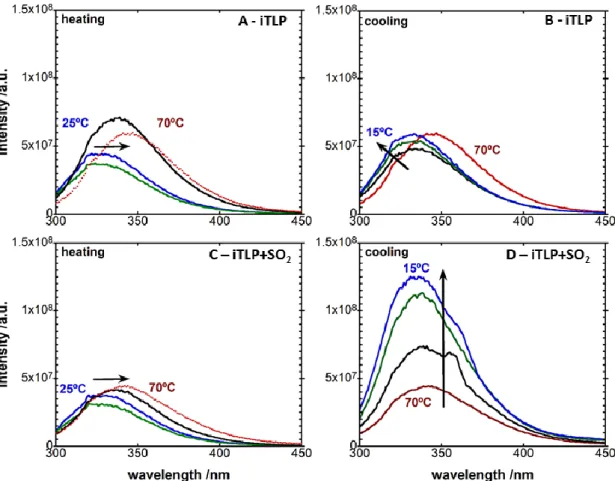
Figure 22 - Tryptophan emission intensity of A) and B) iTLP (100 mg L-1
in model wine solution in the absence of SO2) and C) and D) iTLP (100 mg L-1 in model wine solution) in the presence of SO2 (120 mg/L
total SO2). A) and C), heating: blue 25 °C, green 40 °C, black 60 °C and red 70 °C; B) and D), cooling
(following heat stress represented in A) and C): red 70 °C, black 50 °C, green 25 °C and blue 15 °C). Black arrows represent the shift of the curves with time and temperature. ... 62
Figure 23 - A) Autocorrelation curve acquired by DLS nanoanalysis of the iTLP in wine model solution after heat stress. B) Size distribution frequency acquired by DLS nanoanalysis (represented as the protein diameter in nm) of the iTLP after heat stress dissolved in buffer A. ... 64
Figure 24 - Size-exclusion chromatogram of non-reduced (A) and reduced (B) iTLP dissolved in MWS (─), iTLP after heat stability test (absence of SO2) (─), pellet (─) and supernatant (─) of iTLP after heat stability
test (presence of SO2) in buffer A. First peak at 7.9 min corresponds to blue dextran used as internal standard
(IS). ... 65
Figure 25 - A) Experimental data and corresponding fitting of the chromatographic profile of the heat stressed iTLP in the presence of SO2 (baseline corrected). Multi-peak Gaussian analysis of the
chromatogram is represented by the different Fit Peaks represented in the figure: iTLP after heat stability test (presence of SO2) (─), fit peak 1 (─), fit peak 2 (─), fit peak 3 (─) and cumulative fit peak (─). B) The
table describes the different protein species and discriminates their relative amounts based on the peaks integrals. ... 67
Figure 26 - Size-exclusion chromatogram of non-reduced iTLP dissolved in WMS (100 mg/L) (─), iTLP after heat stability test without SO2 addition (─), pellet of iTLP after heat stability test with SO2 (120 mg/L)
dissolved in buffer A (─), pellet of iTLP after heat stability test with SO2 (200 mg/L) dissolved in buffer A
(─) and pellet of iTLP after heat stability test with SO2 (600 mg/L) dissolved in buffer A (─). ... 69
Figure 27 - Reaction of iTLP with DTNB reagent in buffer E containing 200 mM Tris-HCl, 8 M urea, pH 8.0. Control corresponds to the assay performed in the absence of protein. Mean values not sharing the same letter are significantly different (OneWay-ANOVA, Tukey HSD, P < 0.05). ... 70
Figure 28 - A) Total and free SO2 content of the sample wine (W), of the <3 kDa fraction (<3 kDa) and of
the <3 kDa fraction after lyophilisation (<3 kDa AL). B) Haze development after heat stability test of sample wine (W; 80 mg/L protein), of the <3 kDa fraction added of total wine protein (<3 kDa; 80 mg/L protein), of the <3 kDa fraction after lyophilization added of total wine protein (<3 kDa AL; 80 mg/L protein), and of the <3 kDa fraction added of 120 mg/L total SO2 without protein addition (<3 kDa + SO2).
... 71
Figure 29 - Proposal of new mechanism for wine protein haze formation. ... 74
Figure 30 - Structural hierarchy of the cellulose fiber components from plant fiber to the glucose molecule
177
xx
Figure 31 - Global use of wood for cellulose derivatives production in 2003 179
. ... 85
Figure 32 - Examples of commercial cellulose ethers (adapted) 176
. ... 87
Figure 33 – Conversion of neutral cellulose into a polyelectrolyte by pH change: schematic representation of the ionization of the hydroxyls of cellulose in strong alkali medium (extremely high pH) 186
. ... 88
Figure 34 – Representation of diethylaminoethyl cellulose (7), carboxymethyl cellulose (8), quaternary aminoethyl cellulose (9) and sulphopropyl cellulose (10). In the figure cellulose is represented by an anhydroglucose unit. ... 89
Figure 35 - Schematic representation of the reaction between the sodium bromomalonate (11) and the anhydroglucose unit of cellulose. In the figure, we can see a representation of a DS = 1 molecule substituted in the primary alcohol in C6. ... 93
Figure 36 - 1
H NMR spectrum of sample DCMC3 in D2O (water soluble fraction of the product). ... 94
Figure 37 - 13
C NMR spectrum of sample DCMC3 in D2O (water soluble fraction of the product). ... 95
Figure 38 – Reaction by-products and starting materials possibly present in the crude of the cellulose derivatization. ... 95
Figure 39 - Stacked 1
H NMR spectra of sample DCMC2 to DCMC5 in D2O (water soluble fraction of the
product). ... 98
Figure 40 - Stacked 13
C NMR spectra of sample DCMC2 to DCMC5 in D2O (water soluble fraction of the
products). ... 99
Figure 41 - COSY spectra of sample DCMC4 in D2O. ... 100
Figure 42 - HSQC spectra of sample DCMC4 in D2O. Horizontal axis corresponds to the 1H spectra, vertical
axis corresponds to 13
C... 101
Figure 43 – Summary of the signals assignment of dicarboxymethylcellulose. A) schematic representation of the anhydroglucose unit and the substituent B) 1
H NMR spectra of DCMC4 C) 13
C NMR spectra of DCMC4. ... 102
Figure 44 - HMBC spectra of sample DCMC4 in D2O. ... 103
Figure 45 - 1
H NMR spectra of acetylated DCMC4 in DMSO. ... 105
Figure 46 - 13
C NMR spectra of acetylated DCMC4 in DMSO. ... 106
Figure 47 - 1
H NMR spectra of malonyl cellulose sample DCMC4 after hydrolytic chain degradation by D2SO4 during 5 hours at 90 °C. O represents the oxygen atom at position i (i=2,3 and 6), H-1 the proton at
the anomeric carbon atom, α and β the configuration of glucose, s is used for substituted and u for unsubstituted positions. ... 107
Figure 48 - A) Infrared spectra of the different synthesized samples B) expansion of the 2000 – 400 nm region in samples DCMC4 and underivatized cellulose (Avicel MN 400). ... 108
xxi Figure 50 - Representative chromatograms of samples DCMC2 to DCMC5 hydrolytically depolymerized. ... 113
Figure 51 - Molecular weight distributions of samples DCMC2 to DCMC5 analyzed by size exclusion chromatography. ... 114
Figure 52 - A) Concentration dependence of reduced viscosity of samples DCMC2 to DCMC5 at 20 °C (samples were dissolved in 6% NaOH) B) Intrinsic viscosity of samples DCMC2 to DCMC5. ... 116
Figure 53 - Regioselective oxidation of C6 primary hydroxyls of cellulose to C6 carboxylate groups by TEMPO/NaBr/NaClO oxidation in water at pH 10–11 248
. ... 121
Figure 54 - DCMC6 film (150 mg of polymer) before crosslinking reaction. ... 124
Figure 55 - A) Experimental adsorption isotherm for cytochrome c on a DCMC6 film in 25 mM citrate buffer, pH 3.2. B) Linear fitting of the experimental values presented in A based on the Langmuir isotherm model. ... 125
Figure 56 – Visualization of the increasing quantity of DCMC6 (from left to right) on the protein adsorption capacity. This image was gathered after 24 hours of contact between the polymer and the solution at 25 °C. ... 125
Figure 57 -Polymer (DCMC11) after dialysis and freeze drying. ... 127
Figure 58 - Film of DCMC12 after drying and detaching from the Teflon casting. ... 128
Figure 59 - Representation of the heat crosslinking reaction of DCMC. ... 129
Figure 60 - A) Experimental adsorption isotherm for cytc (1mg/mL) on a NaDCMC11 powder in 25 mM citrate buffer, pH 3.2, for 30 minutes. In red is represented the nonlinear fitting using the Langmuir model equation B) Linear fitting of the experimental values presented in A based in the Langmuir model (R2 = 0.998)... 132
Figure 61 - Polymer DCMC11 crosslinked (powder form) added to a solution of Cytc(at 1 mg/mL). This image was taken after 1 minute contact between the polymer and protein solution. Vials were centrifuged prior to the photo to emphasize the difference between pellet and supernatant. ... 133
Figure 62 - A) Experimental adsorption isotherm for isolated wine protein (IWP) at 1 mg/mL, for 30 minutes, on NaDCMC6 in model wine solution (5 g/L tartaric acid, 12% ethanol, pH 3.2). B) Linear fitting of the experimental values presented in A based on the Langmuir model (R2
= 0.982). ... 133
Figure 63 - Diagram showing mechanism of the Krapcho reaction. ... 137
Figure 64 - Apparatus used to generate HCl gas. The dry cellulose samples were exposed to HCl gas for 30 minutes to guarantee their protonation. ... 143
Figure 65 - FTIR-ATR spectra of Kraft pulp (-), dialyzed DCMC 13 (-), crosslinked protonated DCMC 13 (-) and crosslinked deprotonated (sodium salt) DCMC 13 (-). ... 145
Figure 66 - Paper sheet with DCMC added at a concentration of 18% (w/w). The spots scattered along the sheet correspond to the added DCMC. ... 146
xxii
Figure 67 - Filtration apparatus used to test the DCMC sheets. ... 146
Figure 68 - Representation of the DCMC membranes after filtration of Cytc solution and washing with deionized water... 148
xxiii
List of tables
Table 1 - Retention times (tR), spectral bands (λmax in bold) and detection wavelength (λdetection) of the
compounds selected in Figure 1. ... 25
Table 2 - Concentration of caffeic acid (1) in the untreated wine under analysis, isolated by SPE followed by RP-HPLC-DAD. The calibration curve was prepared using 99% pure caffeic acid. ... 27
Table 3 - Changes in turbidity of wine and wine model solutions after heat stability test measured at 540 nm. IWP + <3 kDa: <3 kDa wine fraction supplemented with 190 mg/L of isolated wine protein; IWP + WMS: isolated wine protein (190 mg/L) in wine model solution; 1: caffeic acid (1.1 or 5 mg/L) added to IWP in wine model solution; 6: caftaric acid (1.1 or 5 mg/L) added to IWP in wine model solution. The pH of all samples was adjusted to 3.2. Different letters represent distinct homogeneous subsets for p = 0.05 (ANOVA, Tukey HSD). ... 30
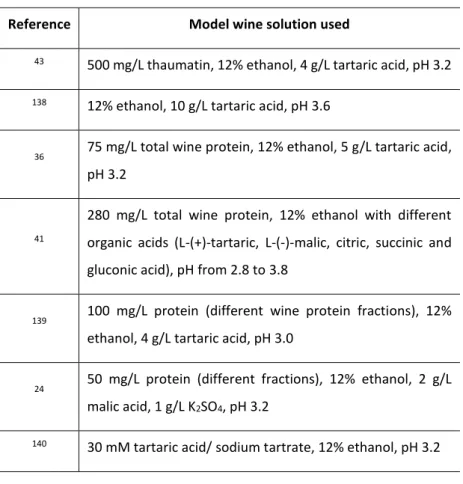
Table 4 - Different model wine solutions described in the literature used to study wine protein interactions/aggregation. ... 33
Table 5 - Summary table of the LC-MS/MS of the H4 protein fraction isolated by HIC. ... 46
Table 6 - Secondary structure analysis of iTLP (with and without added SO2) by the deconvolution of CD
spectra with the algorithms SELCON3, CONTIN and CDSSTR. The values presented in this table correspond to the averages of the results acquired by the different algorithms per each point represented as percentage. The dataset used in these analyses were the SP175 available in the Dichroweb portal. The individual values per each algorithm are available in Appendix A. ... 58
Table 7 - Molecular weight of the different molecular species present in the protein peaks depicted in Figure 24, calculated after their fractionation by non-reducing size exclusion chromatography. ... 66
Table 8 - Summary analysis of two varietal wines, each one produced with and without added SO2. Means
not sharing the same letter are significantly different (OneWay-ANOVA, Tukey HSD, P < 0.05). ... 73
Table 9 - Summary of reaction conditions for DCMC1 to DCMC5. ... 93
Table 10 – Water soluble percentages and elemental analysis results for samples DCMC1 to DCMC5. .. 97
Table 11 - Integrals of the different protons in samples DCMC2 to DCMC5. As reference, the area between 4.05 and 3.1 was adjusted to 6 protons. ... 98
Table 12 - Literature where acetylation of CMC was performed and corresponding protocol. ... 104
Table 13 – Sodium quantification by ICP-AES of deprotonated samples DCMC 2 to 5 (sodium salt form). The samples were hydrolyzed in nitric acid prior to ICP-AES analysis to protonate the samples. ... 111
Table 14 - Areas and area percentage of the different substituted AGU units in samples DCMC2 to DCMC5 ... 113
Table 15 - Degree of polymerization of the different samples after treatment of the SEC results. The DS used to calculate the DP was calculated based on ICP-AES results. ... 115
xxiv
Table 16 - Conditions used for the derivatization of cellulose with different quantities of sodium 2-bromomalonate (11). ... 123
Table 17 -Degree of substitution calculated from the sodium content measured by ICP-AES and water solubility of the different samples. ... 123
Table 18 - Conditions used for the synthesis of DCMC11. ... 126
Table 19 - Sodium quantification using ICP-AES and calculated degree of substitution (DS) of samples DCMC11 and DCMC11 crosslinked. ... 130
Table 20 - DCMC production cost analysis (1.02 g of polymer DCMC11). The prices described in the table are based on commercially available reagents except for 2-bromomalonic acid. ... 136
Table 21 - Natural composition of pine and birch wood and corresponding kraft pulps derived from them (adapted from 263
) ... 141
Table 22 - Conditions used for the derivatization of cellulose with sodium 2-bromomalonate (11). ... 142
Table 23 - A summary of the weight loss (starting from 2 g of each sample) during the purification and crosslinking steps of DCMC polymers 12 to 15. ... 143
Table 24 - Sodium quantification using ICP-AES and calculated degree of substitution (DS) of samples DCMC 12 to 15. ... 144
Table 25 – Protein adsorption capacity calculations for polymers DCMC 12CL, 13CL and 15CL. Each membrane was tested in duplicate. ... 149
Table 26 – Protein adsorption capacity calculation of polymer DCMC15CL (incorporated in cellulose sheets) after filtering 10 mL of Moscatel of Alexandria wine. In this trial, two sheets of 2.6 cm of diameter were used. Both starting and final protein concentration were measured directly in the wine prior and after filtration by the Bradford method. ... 150
Table 27 - Detailed description of the DTNB method used for the quantification of the free thiol groups in the different protein species. ... 165
xxv
Abbreviations and Symbols
AGU anhydroglucose unit
AU absorbance units
BMA bromomalonic acid
BSA bovine serum albumin
c protein concentration in the buffer (mg/mL)
CD circular dichroism
CD3OD deuterated chloroform
CMC carboxymethylcellulose
CPLL combinatorial peptide ligand libraries
Cys cysteine
cytc cytochrome c
D2O deuterium oxide
DCMC dicarboxymethyl cellulose
DEAE diethylaminoethyl cellulose
DEPT distortionless enhancement by polarization transfer
DLS dynamic light scattering
DMSO dimethyl sulfoxide
DP degree of polymerization
DS degree of substitution
DSC differential scanning calorimetry
DTNB 5,5′-dithiobis(2-nitrobenzoic acid)
DTT dithiotreitol
EC ethylcellulose
xxvi
FPLC fast protein liquid chromatography
HEC hydroxyethylcellulose
HIC hydrophobic interaction chromatography
hL hectolitres
HMBC heteronuclear multiple bond correlation
HPC hydroxypropylcellulose
HPLC high pressure liquid chromatography
HSQC heteronuclear single quantum coherence
ICP-AES
inductively coupled plasma - atomic emission spectrometry
IgG Immunoglobulin G
iTLP isolated thaumatin-like protein
IWP isolated wine protein
kDa kilodaltons
MC methylcellulose
MCC microcrystalline cellulose
MPEE mannoproteins extracted by enzymes
MWS model wine solution
NMR nuclear magnetic resonance
OIV International Organization of Vine and Wine
PC phosphate cellulose
PGMA-g-Cell-SO3H
poly(glycidylmethacrylate)-grafted-cellulose sulfonate functional groups
Phe phenylalanine
xxvii
PR-proteins pathogen related
PVPP poly(vinylpolipirrolidone)
Qmax polymer maximum adsorption capacity (mg/g)
RDV rotary vacuum drying system
RP-HPLC-DAD
reversed phase high performance liquid chromatography with diode array detector
SCX strong cation exchange
SDS-PAGE sodium dodecyl sulfate polyacrylamide gel electrophoresis
SEC size-exclusion chromatography
SPE solid phase extraction
TBAF tetra-n-butylammonium fluoride
TBDMS-Cl tert-butyldimethylsilyl chloride
TCA trichloroacetic acid
TCEP tris(2-carboxyethyl) phosphine
TEMPO 2,2,6,6-tetramethylpiperidine-1-oxyl
TFA trifluoroacetic acid
TLP thaumatin-like proteins
Tm melting temperature value
tR retention time
Trp tryptophan
Tyr tyrosine
1. Motivation
1.1 Background
Wine clarity is one of the characteristics most easily affected by inappropriate shipping and storage conditions (Figure 1). One of the reasons for a white wine to turn turbid during storage resides on the insolubilization and aggregation of residual proteins that remain in wine after the fermentation process, a phenomenon commonly known as protein haze. Formation of these unattractive precipitates in bottled wine is a common defect of commercial wines, making them unacceptable for sale. For this reason, ensuring wine stability prior to bottling is an essential step of the winemaking process and presents a significant challenge for winemakers.
Figure 1- Schematic representation of what wrong storage or shipping, by exposure of wine to high temperatures, may induce to wine unstable protein. Left) white wine prior to heat; Right) the same wine after heat stress.
While being just an aesthetic issue, protein haze formation in wines has been described and studied for more than 30 years with incidence not only on the characterization of unstable wine proteins but also on the mechanism(s) by which protein haze formation in white wine occurs. Based on the literature, several variables that contribute to wine protein instability are known: protein concentration, pH, temperature and other wine components that modulate the susceptibility of the proteins to aggregate. To understand which “other wine components” modulate wine protein haze formation, an extensive collection of compounds has already been tested including esters, phenolic compounds, organic acids and salts, among others. However, up to the present work, besides proteins, there is no precise answer about what other compounds trigger white wine protein haze formation.
2
To tackle the problem of white wine protein haze formation, winemakers remove the soluble proteins from unstable wines avoiding its precipitation once bottled. This is routinely done by cation exchange, i.e. fining the wine with bentonite. Bentonite is a negatively charged clay that is very effective in removing proteins from wines, though it has negative impact not only on cost, but also on the wine aroma and mouthfeels and in production of undesirable by-products (higher lees production, sediments difficult to treat in water treatment stations). Because winemakers do not know the identity of the compounds (besides proteins) which trigger this process, many wines are unnecessarily fined with bentonite since commercially available stability tests often give results based only in the wine protein content.
Increased growing-season temperatures are an actual problem in wine producing countries. Wines from these regions will present higher protein content which consequently will need higher doses of bentonite to become stable. Thereby, there is the need to develop new technologies, alternative to bentonite, that allow winemakers to stabilize white wines without such impact not only on the wine but also on the environment.
3
1.2 Questions and goals
Concerning the problems raised above, some questions become scientifically significant:
• Besides proteins, which wine compounds (from the grape, yeast or artificially
added) trigger protein aggregation upon heat stress?
• How do these compounds interact with wine proteins upon heat stress?
• Are we able to remove these compounds from the wine, thus avoiding the use of
bentonite to remove the proteins?
• If we cannot remove the compounds that interact with wine proteins, can we
remove the proteins using a lower impact alternative method?
To address these questions, the following research strategy was applied:
• Study the wine protein aggregation mechanism.
• Isolate and identify which compounds are present in the protein haze sediment.
• Test if these isolated compounds, together with other reactive compounds present
in wine, induce the aggregation of wine proteins in a model wine solution.
• If aggregation occurs, study how do these compounds induce protein aggregation.
• Development of a bentonite alternative.
• Development of a new design polymer, from a renewable source, which binds
wine proteins and removes them from solution.
5
2. Introduction
In 2015 there were 7.5 x 10¹⁰
m2
hectares of cultivated grape vines where Spain, China, France, Italy and Turkey represent 50% of the world planted vineyard 1
. Altogether, grapes were considered by FAO the fruit crop with the highest area harvested in 2014 2
. Around 48% of the produced grapes are wine grapes, which rendered an estimated wine production of 2.59 x 10⁸
hL in 2016. The contribution of the wine sector to the world economy in 2013 reached a value of US$277.5 billion, with a large proportion of the wine exported 3
. Thus, a substantial volume of wine is subject to potentially damaging conditions during transportation and storage, such as inappropriate temperature or humidity, that can cause deleterious modifications of the organoleptic features of the wine 4,5
.
Wine clarity, especially that of white wines, is important to most consumers and is also one of the characteristics that is most easily affected by inappropriate shipping and storage conditions. This aspect will not only be a key element in the visual satisfaction of the consumer but also will enhance the impression of quality on the palate. For this reason, securing wine stability prior to bottling is an essential step of the winemaking process and presents a significant challenge for winemakers 5,6
. A stable white wine is one that is clear and free from precipitates at the time of bottling, through transport and storage, to the time of consumption.The presence of precipitates or the appearance of haze after storage are some of the most commonly defects in wines. These can be caused by several factors including residual sediments from the vinification process, microbial growth, oxidation, tartrate precipitation, colouring matter (in the case of rosé and red wines), metallic casse (including ferric and copper casses) or heat unstable proteins 6
.
2.1 Protein instability
Protein aggregation is a common phenomenon and a major obstacle to handling proteins in vitro
7
. Most proteins are physically and chemically unstable. Factors that influence the stability of a protein were divided into two categories 8
: (1) intrinsic factors, derived from the inherent physicochemical properties of the protein, and (2) the extrinsic factors, derived from the environment of the protein such as pH, temperature, ionic strength and excipients. These factors can impact on disulfide (S-S) bonds. Location of S-S bond reshuffling has been proposed to have a high impact on protein aggregation. Intramolecular disulfide bonds may alter protein conformation, whereas intermolecular bonds change particle molecular weight 9
. Protein aggregation poses concerns when the proteins are for use as pharmaceutical products, as aggregates can stimulate the immune system, but also in agriculture and food industry. One of the food industries affected by this type of problem is the wine industry. Heat unstable proteins will
6
precipitate in commercial wines mainly due to the exposure of wine to elevated temperatures during storage or transport.
Proteins play a significant role in the colloidal stability and clarity of white wines 10
. The isolation and characterization of white wine proteins in grape juice, wine and protein precipitate is thoroughly described in the literature 11–15
. Some of these proteins are known has haze-forming proteins. These proteins can self-aggregate under elevated temperatures into light-dispersing particles causing the so-called protein haze or protein casse 16
. 4
presented relevant data about the fluctuation of temperatures a wine can be exposed during transportation by truck and railroad (Figure 2).
Figure 2 - Temperature profile of a wine shipment from California to Illinois during summer. Measured 4
. Unprotected – Temperature floctuations registered on top of the pallets above the thermal blanket. Protected – Temperature fluctuations registered below the insulation (thermal blanket).
The authors placed test packages inside shipping containers on top of the pallets above the thermal blanket (unprotected) and in the nose or tail of the container in pallets below the insulation (protected). The temperature changes within 1 day in the unprotected wine went up to 21 °C,
which can have a negative impact in the wine. The authors emphasised that the extreme temperature fluctuations were observed only in the top packages and therefore not in the commercial wines that were shipped. However, wines that are shipped without any additional protection (such as blankets as described in this study) will be prone to extreme heat exposure, as well as major bottle variation even within cases from one single shipment. These heat fluctuations followed by refrigeration can trigger protein haze formation in unstable commercial wines. Formation of these unattractive precipitates in bottled wine is a common defect of commercial wines, making them unacceptable for sale 17
7 research about this problem (between 2005 and 2013) showed that the published works focused almost equally among the elucidation of protein haze-forming mechanisms (36.6%), the methods for protein purification, quantification, identification and predicting wine haze potential (26.8%), and finding alternative strategies for wine stabilization (36.6%) 5
.
2.2 Purification and characterization of haze-forming proteins in wines
The most abundant classes of haze-forming proteins that occur both in must and white wine are thaumatin-like proteins (TLP) and chitinases. These proteins are pathogen-related proteins (PR-proteins) that are normally found in white wines together with other minor occurring PR-proteins (e.g. osmotins, invertases, β-1,3-glucanases, lipid transfer proteins) 18,19
. These are the major proteins synthesized during all maturation stages of the grape following veraison and act as a defence mechanism for the plant against pathogen agents, though they can reach high concentrations regardless of the pathogen exposure 20–22
. The expression and accumulation of these protein families are mainly determined by the environmental and pathological conditions at which the grapes are exposed during the maturation period 23
. TLP and chitinases are compact and small proteins (< 35 kDa), have globular structure, are positively charged at the normal wine pH, are resistant to proteolytic attack and are tolerant to low pH in both grape juice and wine 19,24
. Protein content of wines is usually lower than protein content present in musts. This difference is related to the proteolytic activity manifested during the vinification process (which degrades the vast majority of the housekeeping proteins) and to precipitation due to polyphenols and to unfavorable wine conditions, such as low pH and alcohol content 10
. However, the major proteins remaining in wines are PR proteins thanks to their stability at low pH and high resistance to proteolysis 25
. During the vinification process, vacuolar acids and hydrolytic enzymes are released to the must precipitating and/or degrading many proteins present in grapes, thus favouring the predominance of PR proteins 13
. The combination of all these factors ensures that only the resistant proteins, in this case PR proteins, resist the vinification process, making them the principal precursors for protein haze formation in white wines 13,26
.
Purification, quantification and characterization of wine total soluble proteins are actual investigation areas. Initially, denaturing electrophoresis was used to separate the proteins by their molecular weight. Four distinct bands were initially observed indicating four different protein groups, varying in concentration according to the environmental conditions prevailing and different varieties studied 27,28
. Newer techniques enabled a better characterization of proteins, like ion-exchange chromatography using FPLC 16,29,30
; chromatofocusing 31
; size exclusion chromatography 32
; affinity chromatography 30,32,33
; RP-HPLC 34,35
; and isoelectric focusing 12
8
Purification, separation and characterization of proteins present in musts and wines is complex, due to their low concentrations and their interactions with non-protein wine compounds like phenolics. More recently, it was possible to achieve an even higher resolution on the purification and characterization of wine proteins using cation exchange chromatography (SCX) followed by hydrophobic interaction chromatography (HIC) and combinatorial peptide ligand libraries (CPLL) 14,36–38
. Isolating the different classes of haze-forming proteins allowed to not only to sequence them but also to study their individual aggregation behaviour.
In wines, different classes of haze-forming proteins display different thermal stabilities, as demonstrated by differential scanning calorimetry (DSC). Chitinases showed to be generally less stable than TLPs and can denature within minutes at temperatures >40 °C, compared to weeks for TLPs under the same conditions. Though chitinases showed the lowest melting temperature value (Tm), ranking them as the least stable of the grape proteins, thaumatin-like proteins were the next
most likely candidate for haze formation showing, a Tm value marginally higher than that of
chitinase. The most notorious difference between both protein groups was that TLPs could reverse the heat-induced unfold process, thus indicating that these specific proteins do not readily form irreversible aggregates under the tested conditions. Oppositely, chitinases did not refold after heating, resulting in denaturation of the proteins and consequently their precipitation under the tested conditions 39
. Another study, using dynamic light scattering (DLS), also indicated that TLPs do not contribute to the formation of visible aggregates in wine model system, though when analysing wine submitted to a heat stress (70 o
C), both chitinases and TLPs were heat precipitated
40
. These findings emphasize the necessity to confirm the types of phenomena under real conditions since model systems may not mimic what happens in real wine conditions.
Recently, 24
determined the crystal structure and some physico-chemical parameters of three grape TLP isoforms using crystallography. The three isoforms had a high degree of structural similarity but showed not only different unfolding temperatures but also differences in the conformation of a single loop. From the superposition of the different isoforms, it was noticeable differences in two regions of the proteins. The biggest difference was characterized by a longer loop in the Domain I of protein F2/4JRU, attributed to the presence of five extra amino acids residues in its sequence.
9 Figure 3 - Detail of the differences in loop regions of Domain I between protein I/4L5H chain A (purple) and protein F2/4JRU (in blue) 24
.
Other observed differences were related to the unfolding behaviour upon heating of the three isoforms. Protein F2/4JRU showed a significantly lower unfolding temperature (56 °C) than the
two remaining isoforms (with a melting temperature of 62 °C). The aggregation upon heat (in
model wine solution) was also evaluated for the three proteins and revealed that aggregation was taking place only for protein F2/4JRU. This result was particularly relevant for the characterization of the haze forming properties of this protein, although these trials was performed using a wine model solution containing 1 g/L of K2SO4 which does not mimic real wine conditions.
The three isoforms also presented different electrophoretic mobility depending on the presence or absence of a reducing agent. Comparing to the other two, protein F2/4JRU showed to be more compact and migrated to a lower level in the non-reducing SDS-PAGE analysis. This change shows that the small differences in the loops between the other isoforms can be significant enough to result in a change of the mobility and compactness of protein F2/4JRU. The authors hypothesised that the presence of the disulphide bridge in that different loop is probably the key for the unfolding/refolding behaviour of that area which could lead to the destabilization of the protein and subsequent aggregation, hence resulting in haze formation in wines.
2.3 Other non-proteinaceous factors that modulate protein haze formation in wines
Although PR proteins are the major compounds of the precipitate when haze occurs, it has been generally accepted that one or more non-proteinaceous compounds are required to trigger this process, whereas several nonprotein compounds and conditions seem to modulate/influence either positively or negatively the wine protein haze mechanism. These observations are strongly
10
supported by the results obtained by several authors 27,28
who demonstrated that the total protein content, by itself, failed to correlate with wine heat instability. Protein haze formation in wines is described as a multi-factorial process in which some modulating elements have already been recognized (protein content, pH, ionic strength, organic acids commonly encountered in wines and sulfate), whereas others remain to be identified such as the essential non-proteinaceous component(s) generally termed X-factor 41–43
. Two of these factors are pre-requisites for protein haze formation under the conditions prevailing in wines: the proteins themselves and the X-factor. The remaining elements act as positive or negative modulators in protein insolubilization and aggregation.
In an attempt to decipher which compounds interact with wine proteins to form haze, 43
proposed that sulfate could be the missing non-proteinaceous essential factor for protein haze formation. The modulating effect of sulfate was attributed to the possible promotion of hydrophobic interaction-driven aggregation through kosmotropic affect as well as the suppression of electrostatic repulsion between proteins by the increment of the ionic strength of the medium 40
. It is important to note that in this study, the effective sulfate concentration required to induce wine protein haze formation is in the range of 1 to 4 g/L, thus exceeding the legal sulfate limit for most wines. Even though wines with added sulfate produced higher haze, other factors like the reduction of the medium, tested by the addition of dithiothreitol (DTT), improved the aptitude of wine TLPs to form haze in the presence of wine tannins 36
.
Of all non-proteinaceous factors that may be involved in wine protein haze, phenolic compounds have been the most extensively studied and substantial evidence exists to propose that their interactions with proteins are significant 44
. Koch 45
was among the first investigators to determine that isolated grape proteins were associated with tannins. It was shown that protein haze formation in beer and apple juice could decreased using poly(vinylpolypyrrolidone) (PVPP, a fining agent used to remove polyphenols) to remove haze-active polyphenols 46
. PVPP was added to white wines 43
and it was observed that the removal of phenolic compounds from the wine turned it more stable when submitted to heat stability test, confirming previous tests performed by other authors
47,48
. In fact, wines fined with PVPP presented lower haze formation after heat stability test, when compared to unfined wines 43
. High doses of isolated white wine tannins were tested with isolated must proteins, showing that protein-polyphenol interaction can cause haze formation 47
. The same authors also found that the monomeric phenolic fraction did not interfere in the haze formation. Despite these results, the tannin content used in the tests does not reflect the normal content of tannins present in white wines. Other authors showed that haze formation in wines seems to be related to hydrophobic interactions occurring between proteins and tannins 36
. These interactions should occur on hydrophobic tannin-binding sites, whose exposition on the proteins can depend
11 on both protein heating and reduction. They also hypothesized that, during the time after bottling, the decrease of the wine redox potential together with temperature fluctuations during storage, could cause the exposition of hydrophobic binding sites on wine proteins available for tannin complexation, resulting in haze formation during storage of white wines, an hypothesis confirmed by structural studies on TPLs 24
.
Polysaccharides were also studied for their action on inducing and inhibiting protein haze formation in wines. Fifteen different polysaccharides of different origins, were tested and they either did not affect or increased haze during heat test 32
. Other authors showed that a wine fraction containing polysaccharides as major compounds increased the protein instability in wine at a range of temperatures between 40 and 50 °C 49. A multifactorial study revealed a particular kind
of polysaccharide, pectin, to be important in haze formation 50
. Pectin represents from 0.02 to 0.6% of the fresh grape weight but, due to the recurrent use of commercial enzymes, many these polymers are hydrolysed during the vinification process. These enzymes, with grape origin or those added by the winemaker, are mainly pectinases, polygalacturonases, cellulases and hemicellulases, which main action is on the colloidal structure of the juice, facilitating natural settling. Despite its importance in the haze of musts, pectin also is active as a protective colloid, inhibiting the growth of nuclei and crystallization of potassium bitartrate 6
.
Yeast-derived mannoproteins are considered non-haze-forming proteins that inhibit protein haze formation. Mannoproteins were described as a haze protective factor due to their ability to reduce the particle size of the suspended haze 30
. This was corroborated by other authors who showed that wines produced with three transgenic wine yeast strains, deleted for genes involved in cell-wall biogenesis causing them to release increased amounts of mannoproteins, required 20 to 40% less bentonite to assure protein stabilization than those made with their wild-type counterparts 51
. Other non-haze-forming proteins present in wines are grape invertases and grape cell wall glycoproteins and arabinogalactan-proteins 52,53
. The presence of these proteins can increase wine protein stability and influence the foaming properties of sparkling wines 54–56
. Other authors presented that some polysaccharides can increase protein instability under moderately high temperatures (from 40 to 50 °C) 49. These disparities can be linked to differences in
protein/polysaccharide ratios or to the type of protein used in the analysis 57
.
The role of metal ions in protein haze formation is poorly understood, particularly in what concerns copper and iron. The concentration of copper in wine decreased after heat treatment and protein haze removal, suggesting that copper is part of the protein precipitate or interacted somehow with the proteins 58
. In view of the involvement of a protein support in the colloid flocculation occurring in copper casse in white wines, bentonite may be used to treat this problem.
12
Apparently, ferric casse has no proteins involved so bentonite is ineffective to treat this problem
6
.
The effect of pH on protein haze formation is incompletely studied and the existing published work focuses mainly in other beverages like beer. The effect of pH on the formation of protein-polyphenol complexes in wine was described, but the use of white wines non-characteristic proteins and polyphenols (i.e. gelatin and catechin respectively), turned out questionable the significance of these results to the wine industry 59
. Using wine samples instead of wine model solutions, other authors showed that white wine became increasingly heat stable as the pH rose from 2.5 to 7.5 49
. However, it indicated the existence of at least two different mechanisms responsible for the heat-induced precipitation of the white wine proteins: one occurring at higher wine pH values, that appears to result mainly from the isoelectric precipitation of the wine proteins, and the other, at lower wine pH values (but possibly operating also at other pH values), that depends on the presence of a non-proteinaceous factor, known as the X-factor 41
. Protein type also showed to be a factor when studying pH impact on aggregation. Variations in wine pH ranging from 2.5 to 4.0 were sufficient to disrupt the native state of some isolated chitinases at room temperature, resulting in the exposure of hydrophobic binding sites of these proteins. Oppositely, TLPs were stable under the same conditions 60
.
Organic acids constitute another factor with great interest in what concerns protein instability not only due to their effect on pH but also in total acidity and ionic strength. Five different organic acids were tested (L-(+)-tartaric, L-(-)-malic, citric, succinic and gluconic acids) and their effect on wine protein haze potential analysed 41
. The results indicate that these acids induce a stabilizing effect upon the haze potential of wine proteins at all pH values tested from 2.8 to 3.8. The same work raised the hypothesis that organic acids, carrying a net negative electric charge at wine pH, interact electrostatically with the wine proteins, positively charged at the wine pH, from pH 2.8 through to pH 3.8, preventing the interaction of the X-factor with the wine protein. Tartaric acid is also capable of interacting with the X-factor, either in the presence or absence of protein, partially removing it from solution together with tartrate crystals precipitation, thus inducing a partial stabilizing effect of the wine.
The alcohol content of white wines can present a significant variability. This is an important factor since, due to climate change, the alcohol levels in wines from regions like Alsace, Australia or Napa are increasing 61
. The interaction between alcohol content and protein haze formation, tested by the addition of extra alcohol to white wine samples (0.5, 1.0 and 2.0% v/v), showed no relevant influence 49
. These results corroborate previously published data 62
which showed, in the case of beer, that alcohol concentration had little influence in haze formation at the normal pH of the beverage.