2015
UNIVERSIDADE DE LISBOA FACULDADE DE CIÊNCIAS DEPARTAMENTO DE BIOLOGIA ANIMAL
Testing a mesendoderm protocol in Smad5 and Smad1/5 depleted
embryonic stem cells for primordial germ cell induction
Mestrado em Biologia Evolutiva e do Desenvolvimento
Sara Mariana Eugénio Ferraz Mendes
Dissertação orientada por:
Professora Dra. Susana Marina Chuva de Sousa Lopes e Professora Dra. Maria Gabriela
Rodrigues
Contents
i. Acknowledgements ... I ii. Abbreviations ... II iii. Abstract ... III iv. Resumo ... IV
I. Introduction ... 1
1. Embryonic Stem Cells in mouse ... 2
2. BMP signalling: BMP4 and Smads 1/5 ... 3
3. Primordial germ cells (PGCS)... 4
4. Primordial Germ Cells from Embryonic Stem Cells ... 7
II. Project Objective ... 9
I. Material and Methods ... 10
1. Cell Culture ... 10
1.1 Cell lines ... 10
1.1.1 Non-transgenic cell line E14 ... 10
1.1.2 Smad5-/- Blimp:RFP ... 10
1.1.3 Smad5fl/fl Smad1fl/fl and Smad5-/- Smad1-/- ... 10
1.2 Mouse Embryonic Stem Cell (mESC) line Derivation ... 10
1.2.1 Genotyping ... 12
1.2.2 Agarose gel Electrophoresis ... 13
1.3 Splitting ... 13
1.4 Cryopreservation ... 13
1.5 Thawing ... 13
1.6 Differentiation Media experimental design ... 14
2. Alkaline Phosphatase staining ... 15
3. Analysis of gene expression ... 16
3.1 RNA isolation and cDNA synthesis ... 16
3.2 Quantitative reverse-transcriptase PCR (QPCR) ... 16
4. Immunostaining ... 17
5. Imaging ... 18
6. Statistical Analysis ... 18
II. Results ... 19
2. ME markers are upregulated in E14 after 6 days ME-differentiation... 20
3. PGC markers are upregulated in E14 after ME differentiation ... 20
4. Derivation of Smad5 KO Blimp1:rfp mESCs lines ... 22
5. Derivation of Smad5 and Smad 1 KO mESCs lines ... 23
5.1 ME markers are upregulated in Smad1fl/fl Smad5fl/fl WT mESCs ... 23
5.2 ME markers are upregulated in Smad1-/- Smad5-/- KO mESCs ... 23
III. Discussion ... 27
1. ME-differentiation protocol vs Hayashi-protocol ... 27
2. Induction of PGCLCs using the ME-differentiation protocol ... 27
3. Role of (BMP) Smad1/5 signalling during PGC development ... 29
IV. Final Remarks ... 31
V. Supplemental Information ... 32
I
i. Acknowledgements
First, I would like to thank Prof. Gabriela Rodrigues for allowing the connection with Dr. Susana Chuva de Sousa Lopes, for being so patient and understanding throughout the development of my final master student phase. To Professor Christine Mummery and Dr. Susana Chuva de Sousa Lopes for giving me the opportunity to perform my master internship at the department of anatomy and embryology of the Leiden University Medical Center, I am grateful. I am also thankful for the Erasmus scholarship, which facilitated this experience. Also for the international office from my home college, that was always understanding and helpful with all the paperwork and along the whole process in general, I am grateful.
Thank you to all the members of Susanas’ group, both for showing me what a real scientist is all about and for having taken the time to teach me and support me with laboratory practices. In particular I would like to recognise Ana Bernardo for the helpful discussions of project ideas. A very special thank you goes to Maria Fernandes, for teaching me, for the patience, for the moral support, for showing me nice places to go and eat in the Netherlands, for reviewing my thesis, for more things than I could not possibly fit here, and also for the best home-made Francesinha I ever tasted!
Thank you to my friends of all times, that accompanied me through my little adventure in breezy Dutch lands, and diligently heard about my daily life stories, making me feel whole far from home. To the ones that helped boost my motivation and love for science, I thank you.
To my family that supported me, not only financially, but also with piece of mind, remaining calm at all times and allowing me to understand things and carve my own path by myself.
To all the friends and acquaintances I made along this journey with whom I shared a talk or even just a fleeting moment, I am grateful to you for the memories, and for, in a very particular way, opening up my mind to other points of view, to other cultures and to the realisation of an amazingly infinite set of possibilities awaiting to be taken.
II
ii. Abbreviations
AP Alkaline phosphatase
ASCs Adult stem cells
bFGF Basic fibroblast growth factor
BME 2-Mercaptoethanol
BMP Bone morphogenetic protein
BP Base pairs
BSA Bovine serum albumin
CHIR CHIR99021
E Embryonic day
EGF Epidermal Growth Factor
EpiLCs Epiblast-like cells
EpiSC Epiblast stem cells
ESCs Embryonic stem cells
ExE Extra-embryonic ectoderm
FACS Fluorescence activated cell sorting
FCS Fetal calf serum
hESCs Human embryonic stem cells
ICM Inner cell mass
IPSCs Induced pluripotent stem cells
IVF In vitro fertilization
LIF Leukaemia inhibitory factor
ME Mesendoderm
MEF Mouse embryonic fibroblast
mESCs Mouse embryonic stem cells
NEAA Non-essential amino acids
PBS Phosphate-buffered saline
PCR Polymerase chain reaction
PD PD0325901
PFA Paraformaldehyde
PGCLCs Primordial germ cell-like cells
PGCs Primordial germ cells
qPCR quantitative polymerase chain reaction
RFP Red fluorescent protein
SCF Stem Cell Factor
T Brachyury-T
TGF-β Transforming growth factor beta
VE Visceral endoderm
III
iii. Abstract
Mouse; PGCs (Primordial Germ Cells); Mesendoderm; Smad1/5; CHIR99021
The developmental pathway of Primordial Germ Cells (PGCs) is not only complex but it is also critical for the reproduction and continuity of species. Deepening our understanding of the mechanisms that underlie PGCs acquired identity along with maintenance of totipotency (until the event of fertilization) paradox would give us useful insight for further translational research. PGCs in mice are known to arise from the epiblast due to specific time/place signalling. Molecules that are already identified as being involved in PGC competence and specification include Fragilis, Blimp1, Prdm14 and Stella. Additionally, there is an increase in alkaline phosphatase enzyme activity. BMP4 and its downstream targets Smad1 and Smad5 are some of the factors thought to initiate the PGC signalling pathway.
Several efforts to maintain these cells proliferating in vitro have been made. Current in
vitro practices include culture in either serum and fibroblast-feeder layer or the 2i-medium (2i =
2 inhibitors) that includes the inhibitor cytokines CHIR99021 (CHIR) and PD0325901 (PD) and Leukemia Inhibitory Factor (LIF) to maintain cell pluripotency.
Hayashi et al1 has been able to induce PGC-like cells (PGCLCs). Using mouse embryonic stem cells (mESCs) cultured 2i it relies on a time-specific induction by first inducing Epiblast-like cells (EpiLCs) and only afterwards inducing PGCLCs. Molecules like Activin A, basic fibroblast growth factor (bFGF) were used for inducing EpiLCs while bone morphogenetic protein 4 (BMP4) with BMP8b, Stem Cell Factor (SCF), LIF and Epidermal Growth Factor (EGF) was used for inducing PGCLCs.
However, the cytokine CHIR99021, when used alone, has been shown to induce other cells types, for example mesendoderm. Since PGCs need inducing signals from the mesendoderm, it should be possible to generate PGCs from EpiLCs being induced to differentiate to mesendoderm.
In this study, mesoderm and endoderm markers Brachyury-T and Sox17, respectively, were analyzed along with Oct4 and Nanog pluripotency markers, and Blimp1 and Stella, as PGC markers. Wildtype and Smad5 deficient mESC were analysed, followed by an attempt to generate of Smad5 KO Blimp1:rfp for detection in living cells of PGCLCs induction. Unfortunately, we were unable to generate Smad5 KO containing the reporter transgene. Therefore we analysed other genetic mutant mESC line, the double Smad1 Smad5 KO mESCs to determine the efficiency of PGCLC in a protocol for mesendoderm formation.
From our results it remains unclear whether induction of mesendoderm in EpiLCs resulted in more efficient PGC induction. Nevertheless, the induction of Blimp1 is shown to be independent of BMP signalling activation by Smad1/5, since it was observed in the double Smad1 Smad5 deficient mESC.
IV
iv. Resumo
CGPs (Células Germinais Primordiais); Mesendoderme, Smad1/5; CHIR9902
As Células Germinais Primordiais (CGPs) são responsáveis pela continuidade das espécies. A formação de CGPs é dependente de uma rede complexa de sinalização molecular coordenada no espaço e no tempo durante o desenvolvimento embrionário. A especificação destas células consiste em manter as células pluripotentes durante o desenvolvimento do animal, até que este atinja a maturidade e seja capaz de se reproduzir. A instrução destas células vai no sentido oposto da diferenciação tradicional no sentido em que, neste caso, as células estão a ser instruídas a permanecer pluripotentes.
Em ratinho, as células do epiblasto junto da base da alantóide começam a expressar Fragilis e dessa forma a ganhar competência para formar CGPs. Aquelas que contam com maiores níveis da proteína Fragilis vão começar a expressar Blimp1, Prdm14 e Stella, sequencialmente. Também existe um aumento da activade da enzima fosfatase alcalina em CGPs quando se inicia a expressão de Stella.
Pensa-se que a sinalização por BMP4, segregado pela ectoderme extra-embrionária, e BMP2, da endoderme visceral, (e os seus alvos a jusante) seja a responsável pela indução da expressão diferencial de Fragilis no epiblasto. Os tecidos de onde são segregados estes BMPs ladeiam a área da base da alantóide, criando um nicho de factores favorável à especificação de CGPs. De seguida algumas destas células começam a expressar Blimp1 e Prdm14, mais tarde começando a expressar Stella, adquirindo a identidade de CGP.
O desempenho de funções essenciais do BMP4 na diferenciação de CGPs foi demonstrado pelas deficiências dos portadores de mutações nos genes de Smad 1 e Smad5. Nos indivíduos sem Smad1 funcional, verifica-se a ausência de CGPs enquanto nos indivíduos com o Smad5 mutado ocorre uma diminuição do número total de CGPs juntamente com o aparecimento de CGPs ectópicas.
Desde a descoberta de CGPs em mamíferos que foram sendo feitos esforços no sentido de tentar manter estas células em cultura no laboratório, tendo mais tarde o interesse passado para a sua geração in vitro a partir de Células Estaminais Embrionárias (CEEs). O conhecimento dos mecanismos que operam nestas células permitiria eventualmente, a partir de uma célula pluripotente (CEEs), originar todos os tipos de tecido. Tal como acontece in vivo, em que as células adquirem a identidade de CGPs até ser dado um sinal em contrário, que neste caso seria a fertilização e consequentemente a formação do zigoto, a partir do qual estas células são capazes de dar origem a todos os tipos de células. Para além da vertente mais imediatamente aplicável na área da reprodução medicamente assistida (formação de gâmetas in vitro), estes conhecimentos contribuem para a investigação na área de diferenciação de outros tecidos in
vitro a partir de CEEs.
Actualmente, a maioria das culturas in vitro são feitas sem fibroblastos e sem soro. Estes factores contribuem com variáveis desconhecidas para o comportamento das células, fazendo com que as várias células estejam em estados de transcrição diferentes, originando uma cultura heterogénea (meta-estável) que também reagirá de forma heterogénea à indução da diferenciação.
V
O meio N2B27 não contém soro, sendo conhecido como meio de base para diferenciação neuronal. Quando este contém CHIR99021 (CHIR), PD0325901 (PD) e LIF, o meio é chamado “2i” (2 inibidores), e é capaz de manter CEEs no seu estado pluripotente de uma forma mais homogénea.
PD actua pelo bloqueio da sinalização FGF através da inibição de MEK. CHIR é uma molécula da via de sinalização Wnt/beta-catenina que actua através da inibição de GSK3, esta última sendo responsável pela degradação da catenina. Com a estabilização da beta-catenina pelo uso de CHIR, esta pode migrar para o núcleo e servir de factor de transcrição. Por si só, o CHIR suprime a diferenciação neuronal, induzindo outros tipo de diferenciação não-neuronal. Ocorre também por resultado da adição de CHIR, o aumento de Nanog, diminuição de Nodal e aumento de BMP4 e os seus efectores a jusante Smad1 e 5.
Recentemente, o grupo de Hayashi e colegas 1 utilizando CEEs cultivadas com 2i foi bem sucedido em gerar CGPs. O protocolo usado baseia-se no facto de in vivo ser possível distinguir duas etapas de diferenciação. Primeiro, ocorre a diferenciação em células do epiblasto e numa segunda fase, a combinação específica de vários factores, fará com que algumas dessas células se comprometam para CGPs. No protocolo a indução começa com a adição das moléculas Activina A e bFGF para, nesta primeira fase, gerar células tipo-epiblasto e apenas posteriormente é adicionado BMP4 juntamente com BMP8b, SCF, LIF e EGF para gerar células tipo-CGPs.
No entanto, apenas com a adição de CHIR é possível diferenciar células em mesendoderme, e verifica-se nestas células um aumento de BMP4 e Smad1/5 que deveria auxiliar a geração de CGPs sem ser necessário factores indutores adicionais.
Para testar se é possível obter CGPs com a ajuda de factores secretados por células que estão a diferenciar em células mesendodermais, foi utilizada a linha CEE E14. Adicionalmente, para investigar se o Smad1 e o Smad5 estão envolvidos na diferenciação de mesendoderme e/ou de CGPs, foram utilizadas linhas CEE mutantes. Tentámos obter uma linha transgénica Smad5 nula com o gene rfp como reporter e ademais foram também derivadas células duplas mutantes com sites loxP a flanquear o gene Smad1 e Smad5 (Smad1fl/fl Smad5fl/fl). Foram testadas a linha mãe (WT), contendo apenas os locais loxP, e 3 outras linhas, expostas à actividade da recombinase Cre, tendo o Smad1 e Smad5 não funcional (knocked out).
O projecto scientífico apresentado aqui consiste na diferenciação destas CEEs em 3 meios distintos durante 6 dias. Foram utilizados os meios: “N2B27” que direcciona as células para a linhagem neuronal; N2B27 com a adição de CHIR99021, “CHIR”, com vista a induzir a mesendoderme e consequentemente produzir factores que levam EpiLCs a produzir CGPs, e por fim foi utilizado o meio “MEF” em que se espera diferenciação espontânea para múltiplas linhagens celulares devido à utilização de soro.
Numa análise inicial foi utilizada a coloração para a enzima fosfatase alcalina (FA), uma das primeiras e principais técnicas de detecção de CGPs (e EECs), para análise das características morfológicas das diferentes densidades de sementeira em cultura monocamada. Em menor densidade as células adquirem uma aparência epitelial mantendo alguns nichos onde é possível ver coloração positiva para a enzima. Em densidade de sementeira superior, todas as células se apresentam negativas para a presença da enzima (demosntrando apenas coloração de fundo). Por existir maior número de células, isto poderá ser atribuido à inibição da diferenciação pelo contacto extensivo entre EECs.
Após a escolha da densidade mais baixa de sementeira foi efectuada imunohistoquímica para os marcadores de mesendoderme Brachyury-T (mesoderme) e Sox17 (endoderme) para
VI
verificar a formação de mesendoderme nas linhas controlo (E14 e linha WT) em contraste com as linhas floxed Smad1-/- Smad5-/-. É também analisado o factor de pluripotência Nanog (que passa a ser infrarregulado assim que as células estão competentes para diferenciação, voltando a ser expresso em CGPs), que poderá fornecer informação relativamente à pluripotência das células e competência para diferenciação.
Os resultados relativos à produção de mesendoderme nas CEEs E14, mostram que a diferenciação para mesendoderme foi eficaz após os 6 dias de diferenciação. Verificou-se a presença dos marcadores de mesoderme (Brachyury-T) e endoderme (Sox17) especificamente na condição CHIR, enquanto o marcador de pluripotência/CGPs (Nanog) é produzido em todas as condições (N2B27 para ectoderme, N2B27+CHIR para mesendoderme e MEF para diferenciação espontânea). Especificamente na condição CHIR, parece formar um aglomerado apertado. Verifica-se também nas CEEs E14 que há um aumento de Stella, o que indica a diferenciação de CGPs. Para além do aumento de Stella, o PCR quantitativo para os genes da rede de pluripotência (Oct4 e Nanog), e o outro gene especifico de CGPs (Blimp1), mostra algumas diferenças relevantes em que a expressão é mais elevada no protocolo “CHIR” após 6 dias de diferenciação.
No protocolo “CHIR” (para mesendoderme) aplicado às CEEs mutantes Smad1-/- Smad5 -/-derivadas, verifica-se também a expressão de marcadores de mesoderme (Brachyury-T) e endoderme (Sox17) assim como Nanog (marcador de pluripotência/CGPs). O Nanog apresenta-se em maior quantidade, num aglomerado apertado, na linha WT enquanto que nas linhas K.O. (excepto a linha 1.35) se apresenta relativamente em menor quantidade e mais disperso. Conclui-se que o tratamento com CHIR99021 também é capaz de induzir a expressão de mesendoderme e Nanog (potenciais CGPs) em CEEs depletas de Smad5 (Smad1-/- Smad5-/-).
1
I. Introduction
The interest in ES (embryonic stem) cells as model for a wide range of studies, such as disease modelling, signalling pathway analysis, and in overall in vitro behaviour upon exposure to different conditions, is continuously growing. ESCs can be kept in the naïve state, which resembles the preimplantation epiblast, displaying unlimited self-renewal capacity and pluripotency. This state has both X chromosomes active (in the case of cells carrying two X chromosomes), which is an epigenetic signature for the naïve ground state of pluripotency. In
vivo, the epiblast cells will become primed after implantation, one of the X chromosomes will
inactivate and the cells become competent to differentiate into other cell types. In culture, these cells are called EpiSCs and like the ESCs still express pluripotency factors, e.g. Oct4, Sox2, and Nanog, although they are not able to contribute to chimeras. On the contrary, naïve ESCs contribute to chimera’s somatic portion as well as germ cell lineage.
Germ cells are a special kind of cells that have to go through steps of differentiation and dedifferentiation2. Differentiation of these cells in vitro would represent a great step to understand their development and characteristics, which would contribute to the advance of assisted reproduction for infertile couples, for instance, although there are major differences between SCs from different species.
In the mouse model it is known that BMP4 and its downstream targets play an important role in PGC differentiation3. So far there is one protocol that succeeded in differentiating PGCs in vitro that were able to mature in vivo after transplantation into functional gametes and generate viable progeny4,5. Although it did result in viable offspring, this
protocol relies on a step-by-step differentiation with the addition of several signalling molecules during the first differentiation step to PGCs, but could consequently bias the study of processes that happen along their differentiation. In general, molecules do not have a single function, but are included in various cellular processes: CHIR modulated genes, for instance, have been reported to regulate more than 50 signalling pathways6. CHIR is a Wnt signalling pathway activator that has a wide array of pleiotropic results7. Which Wnt target genes get activated depend on the history of the cell where Wnt signalling is acting upon8. CHIR is a molecule widely used in vitro, alongside others, to maintain stem cell pluripotency through the stabilization of β-catenin9–11. When no other supplementary factors are added to the culture medium, CHIR is actually capable of inducing differentiation other than neural12. CHIR has been used to generate mesendodermal progenitors, in a monolayer, through sustained Wnt pathway activation. These cells showed the expression of meso/endodermal markers such as
T-brachyury, Sox17, Gata2, among others13. BMP4 has been shown to be expressed at the same time in different parts of the early embryo, being involved in the formation of PGCs, the lens placode and the kidneys14. It would therefore be useful to have a simpler protocol for the study of the intermediate processes of the formation of PGCs.
2
1. Embryonic Stem Cells in mouse
In 1981, Evans et al.15 were able to derive a pluripotent cellular line (capable of differentiating into 3 embryonic germ layers in vitro and in vivo) directly from cultured preimplantation mouse blastocysts and maintaining the cells self-renewing. Previously this had only been possible by using cells from teratocarcinomas formed in vivo16. In vitro, these colonies were able to be induced to differentiate through the formation of embryoid bodies (EBs). The aggregated cells in the EB can start to differentiate into specific cell types through directed differentiation protocols 17.
Pluripotent ES cells can be maintained on a layer of feeder cells when in the presence of serum and LIF (differentiation inhibitor that preserves the potential of the cells to contribute to a developing embryo). However, under these conditions the cells constitute a heterogeneous population18.
Nowadays it is possible to maintain ESCs without a layer of feeder fibroblast cells using a defined culture medium, making them a more homogeneous population. This is because serum allows the expression of lineage specific genes in ESCs, creating an artificial situation where there is more unsteadiness in the expression of lineage specifiers versus upregulation of the core pluripotency network (to counteract the differentiation stimuli). Furthermore, while serum grown cells acquire H2K27me3 methylation and having 3000 bivalent genes (linked to developmental processes), 2i grown cells have only 1000, possessing an additional overall lower expression. Thus, cells growing in serum are composed of cells in different transcriptional stages, therefore being called metastable19.
Serum and 2i transcriptional states are interconvertible between each other. However, some of the cells growing in serum that acquire lineage specific gene expression, although still showing Oct4 expression, reach a point where their differentiation potential is altered. On the other hand, cells grown in 2i are more stable in their expression patterns and thus preserve a relatively steadier differentiation potential19.
The basal formulation of the 2i was first described by Ying and Smith20 for neural commitment. This medium was further improved using a combination of the two inhibitors (2i): CHIR99021 together with PD0325901 plus LIF21, thus allowing the maintenance of the pluripotency network and self-renewal of cells without requiring the addition of non-defined components, giving rise to a ground state population of cells6,11,21. Furthermore, the presence of LIF and Wnt signalling molecules inhibit the cells to become primed epiblast stem cells (EpiSCs) (Figure 1). Wnt signalling is thought to be a highly conserved gene and therefore having some of its functions shared by invertebrates and vertebrates8. Wnt (also called Int-1) was one of the first genes to be identified as a putative oncogene in mice mammary tissue, and its description at the time extensively corresponded to the humans’ homolog transcript22. Furthermore, the APC gene, which is associated with digestive system tumours, has been shown to interact with one of the main components of Wnt signalling, β-catenin23.
3
Figure 1. CHIR influence on pluripotency.The figure shows how the Cytokines CHIR, LIF and PD influence the cell to support the maintenance of its pluripotency. CHIR signals through the canonical Wnt pathway allowing the induction of Wnt and pluripotency associated genes, LIF prompts Stat3 activation thus supporting the pluripotency network, while PD inhibits mitogen-activated Kinase (MEK) which will ultimately inhibit MAPK pathway (Adapted from Wray and
Hartmann, 201124).
PD0325901 is a cytokine that blocks the FGF signalling by binding highly specifically to its receptor. FGF4 in particular acts intracellularly by phosphorylation of the MAPK/ERK (Mitogen-Activated Protein Kinases/Extracellular signal-Regulated Kinases) pathway. PD0325901 suppresses this activation trough selectively inhibiting MEK, an upstream kinase of the pathway25.
CHIR99021 acts upon the beta-catenin/Wnt signalling pathway by inhibiting GSK3, which promotes beta-catenin degradation by phosphorylation of specific sites on the protein11. When added on its own, CHIR suppresses neural differentiation while inducing non-neural differentiation21. On the other hand, when conjugated with LIF, this blockage has been shown to support self-renewal10. Furthermore, in some cell lines, the stabilisation of beta-catenin in response to CHIR causes enhanced expression of the pluripotency factor Nanog, although Oct4 suffers little changes26. Additionally, there is downregulation of Nodal signalling pathway components (smad7, lefty1 and lefty2), and the subsequent secondary upregulation of BMP4 (Id1 and Id3, although Id2 is downregulated by 30%) along with its downstream components
pSmad1/526,27.
2. BMP signalling: BMP4 and Smads 1/5
These proteins, that are responsible for initiating PGC specification, are a part of the transforming growth factor beta (TGFβ) superfamily and are involved in the regulation of cell proliferation, differentiation and apoptosis28.
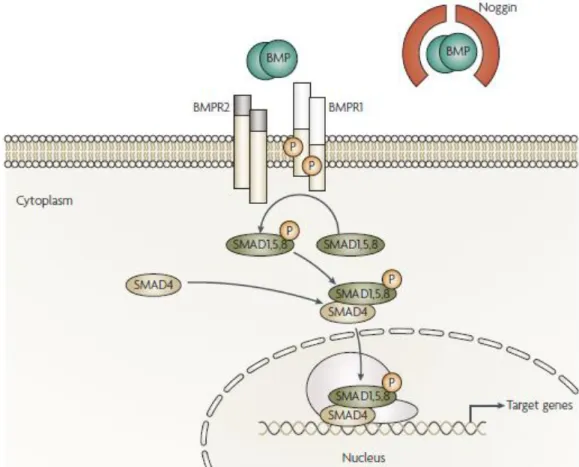
The BMP signalling pathway works through the assembly of two different receptors, type I and type II, upon presence of a ligand. Different ligands favour a certain combination of the type I and II receptors, leading to different outcomes in intracellular signalling29,30. When the receptors dimerize, type I receptor phosphorylates Smad1, Smad5 or Smad8, which then
4
recruits a co-Smad (Smad4) to bind to the DNA in the nucleus. Here, the heteromeric complex will have a transcription factor role in the cell nucleus30(Figure 2).
In combination with LIF, BMP4 supports pluripotency maintenance in vitro of serum-free ESCs by inhibiting neural differentiation (even though it potentiates other types of differentiation)20,31–33. In vivo, the role of BMP4 in the formation of PGCs is shown by the lack of PGCs in the homozygous null mutants and by a reduced founder population on the heterozygous mutants3. Furthermore, cultured epiblasts of BMP4 null mutants do not show Blimp1 expression, but if exogenous BMP4 is added, Blimp1 expression is restored34. Downstream Smad5 mutant embryos have ectopic PGCs although, in total, they have a reduced number or a complete absence of them in the base of allantois (in a dosage dependent manner). However Smad1 mutants lack PGCs in a non-dosage dependent manner35,36.
Figure 2. BMP signalling pathway. When ligands are present, they attach to BMP receptor 1
(BMPR1) and to BMP receptor 2 (BMPR2). The later will phosphorylate and thus activate BMPR1 which will phosphorylate SMAD1/5/8. Later they will associate with SMAD4 and function as a transcription factor in the nucleus, regulating gene expression. (Adapted from Hardwick et
al.37).
3. Primordial germ cells (PGCS)
Primordial Germ Cells (PGCs) are the cells that will mature into gametes, giving rise to sperm or oocytes38. PGCS are not stem cells. Stem cells are usually defined by remaining in a
5
pluripotency state where they are able to give rise to two cells: either two identical cells to the mother-cell, or if they undergo asymmetrical division one identical and another that is able to follow some differentiation pathway. By contrast, PGCs do not self-renew and during each cell division (in mice they go through around 9 or 10 divisions) contributes to an advance in their developmental stage39. Different species have different ways of producing PGCs. PGCs can arise either through preformation or epigenesis.
Preformation depends on maternal determinants (such as RNA and proteins) present in the germ plasm of the oocyte, which is fundamentally a specialized cytoplasm 40. For example, in Drosophila, the germ plasm located in the posterior part of the egg is capable of turning any cell of the syncytioblast into pole cells, which are cells that will later mature into the germ cells41. In the case of zebrafish, where there is no syncytioblast, there is an asymmetric distribution of cytoplasm during cell cleavage. Thus the germ plasm containing specific RNAs will be pushed only into four cells of the embryo, functioning as a cue for PGC development42,43. Epigenesis is a process whereby PGC formation is dependent on the presence of induction factors. It usually occurs further ahead in development, typically during gastrulation, when the embryo is being patterned by induction factors from surrounding tissues40.
In animals using both processes of PGC formation, the PGCs have a migratory phase to the developing genital organs39,44. In mammals, the PGCs of a male individual stop proliferating in the G0/G1 cycle phase after they reach the genital ridges while in females the arrest occurs in the oocyte at the prophase stage of the first meiotic division. After the arrest, the primordial germ cells start the next phase of germ cell development, spermatogenesis or oogenesis39.
3.1
PGCs in mouse
Brambell, in 192745 described mouse PGCs as larger cells of epithelial origin, with big oval nuclei and two or three acidophil nucleoli. Later, Chiquoine46 used AP staining as a specific marker for PGCs, describing that they can be found in cells of the proximal end of the primitive streak (or base of the allantoic mesoderm), suggesting a mesodermal (splanchnopleuric extra-embryonic mesoderm) origin46. Through Ginsburg47 experiments it was possible to distinguish at early E7 a cluster of AP positive cells in the base of the allantois. Later, PGCs increase in number through mitosis and migrate through the dorsal mesentery to the hindgut endoderm, towards the genital ridges were they will settle 48.
3.2
PGC competence and specification
Signals for PGCs competency start as early as E5.5, discriminating the germ cell lineage from the somatic lineage. The first molecular signals involved in PGCs differentiation come from the extraembryonic ectoderm (ExE) and from the visceral endoderm (VE). These signals belong to the TGF-β family: BMP4 and BMP8b from the ExE and BMP2 from the VE49–53.
At around E6.25 BMP4 induces Fragilis to be expressed in the proximal epiblast area next to the extra-embryonic ectoderm, the base of the emerging allantois54. Some of the cells begin to express Blimp1, a protein that represses the expression of major somatic genes, like
6
Hoxb55. The ones expressing Blimp1 and a higher expression of Fragilis are associated with those that will latter express Stella 54(Figure 3).
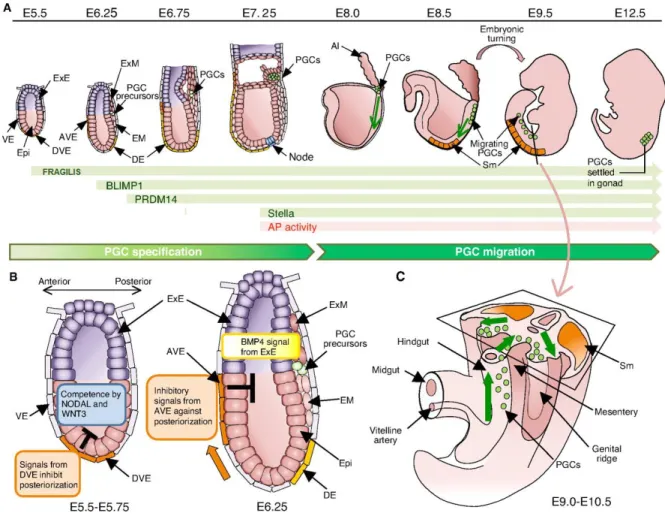
Figure 3. Specification and migration of mouse primordial germ cells. (A and B) After
acquiring competence to respond to ExE BMP4 as a result of Nodal and Wnt3 signalling, some cells will be induced to express Fragilis in the proximal epiblast. Some of these will start expressing Blimp1, then PRDM14 and later on Stella and will have an increase on AP activity. (C) At around E8 the cells will migrate from their place of formation along the endoderm, until E9,5 when they start to migrate towards the dorsal body walls and finally, about 1 day later, they reach the genital ridges were they will continue to mature. (Adapted from Saitou et all, 201256).
Blimp1 downregulates genes that are being expressed by neighboring somatic cells, like
Brachyury T, allowing the upregulation of pluripotency genes like Nanog and Stella55. Nanog is
detectable in the embryo in early migrating PGCs around E7.75 and it is seen co-localizing with Stella about E9.5 (Figure 4).
7
Figure 4. Migrating PGCs in the E9.5 and E10.5 embryos. (Adapted from Yamaguchi 2005)
At E8.5 and until PGCs reach the gonadal ridges, the PGCs undergo major epigenetic remodelling. They go through DNA demethylation by downregulating the histone methyltransferase GLP, responsible for H3K9me2, while this is substituted by high levels of H3K27me3, a still repressive but more plastic methylation57. There is thus the erasure of existing imprints which will later be followed by the establishment of new imprinting. In the case of female cells, there is also the reactivation of the inactive X chromosome. These mechanisms therefore allow epigenetic mutations that might have occurred to be erased, but are important mainly to equalise the two parental epigenomes58.
With the knowledge of these molecular signalling pathways it was possible to generate PGCLCs from ESCs in vitro, recapitulating the different in vivo specification steps 59.
4. Primordial Germ Cells from Embryonic Stem Cells
Earlier protocols for ESCs differentiation into PGCs depended on culturing ESCs with serum and let the cells spontaneously differentiate and after that the cells of interest had to be selected60–62. Some recent protocols go through a step-by-step differentiation induction, first obtaining EpiLCs and afterwards inducing PGCLCs4,5,34,63.
The culturing of E6 epiblasts has shown that the ExE is capable of inducing all the cells of the epiblast to express Blimp1 and Prdm14 through BMP4 induction (since BMP4 null mutants are also capable of expressing them if induced with exogenous BMP4). Additionally, if the VE is removed and its inhibitory signals (like Cer1) are not present, all the cells will be receptive to BMP4 and have potential to express Blimp1. Alternatively, the use of BMP8b in culture restricts
8
possible BMP4 inhibitors (like Wnt or Nodal) potentiating its action34. Wnt3 however gives the epiblast competency to respond to BMP4 signalling, even though independently it does not induce Blimp1 in epiblasts34.
When culturing isolated epiblast cells they show little Blimp1 expression but with the addition of LIF the epiblast becomes totally depleted from Blimp1 positive cells. LIF was found to inhibit a mesendoderm marker, Goosecoid (Gsc)34, which suggests that the presence of mesendoderm or mesendoderm determinants may be important for the induction of Blimp1 cells, even though LIF has also been shown to support PGC survival, and in conjugation with Stem Cell Factor (SCF) assist in their proliferation64,65. The combination of BMP4 with BMP8b, Epidermal Growth Factor (EGF), LIF and SCF was shown to be the most supportive for epiblast-derived cells growth34.
Hayashi and colleagues induced the differentiation of EpiLCs by adding Activin A, basic Fibroblast Growth Factor (bFGF) and Knockout Serum Replacement (KSR) 1% to a culture of ESCs grown in 2i+LIF for 2 days63. These cells showed reduction of the pluripotency markers Nanog by day 1 and Sox2 at day 2, while Oct4 expression remained continuous throughout. ICM markers (Prdm14, Zfp42, Klf2 among others) were downregulated and primitive endoderm markers (Gata4 and 6, Sox17 and Blimp1) underwent downregulation as well, which does not occur in EpiSCs. At the same time there was an increase in epiblast markers Fgf5, Wnt3 and Dnmt3b63.
These EpiLCs could be induced by BMP4 alone or BMP4 plus LIF to become Blimp1 positive (~35.3%) from day 2 on. On day 4, Blimp1 positive cells (~9.8%) formed clusters, with
some of them also expressing Stella (~1%). On day 6, Blimp1 and Stella expressing cells became
more restricted to the periphery. Adding BMP8b, SCF, LIF and EGF to the PGCLCs culture influenced only the maintenance and proliferation of the cells, with BMP4 being the major inducer63.
These PGCLCs expressed Oct4 in a constant manner throughout differentiation, while reacquiring expression of Sox2 and Nanog. Interestingly it was possible to select this population through the surface markers SSEA-1 and Integrin-β3. Expression of PGC markers like Blimp1, Prdm14 and Stella together with downregulation of somatic mesodermal genes like Hoxa1 and Hoxb1 was observed63.
The transplantation of these disaggregated sorted cells into seminiferous tubules of infertile male mice resulted in proper spermatogenesis of the PGCLCs, were able to produce fertile offspring with normal imprinting and growth63. A similar procedure was also attempted to achieve female gametes from PGCLCs. The cells were first aggregated with a reconstituted ovary, composed of the PGCLCs aggregated with female gonadal cells isolated from E12.5 embryos, matured in vitro for 2 days and afterwards transplanted into the ovarian bursa. The obtained oocytes were capable of generating viable offspring after IVF (in vitro fertilisation). However, faulty second polar body extrusion occurs in half of the generated eggs, and overall success of PGCLCs to offspring was 3.9%66.
Exploring other protocols would therefore be useful to assess the robustness of already described differentiation methods (for the case of directed ME differentiation) and also to evaluate the spontaneity of PGC developmental process.
9
II. Project Objective
The aim of this study was to investigate whether it is possible to obtain more PGCLCs. A protocol for obtaining mesendoderm, using only the addition of CHIR (GSK-3beta inhibitor), was tested. This choice was based in the already published protocol by Hayashi where there is a first step of differentiation into epiblast like cells and only subsequently the induction of PGCLCs. Through adapting the Hayashi protocol, increasing the production of mesendodermal cells (that produce BMPs) from EpiLCs, instead of adding additional factors to the medium, in order to obtain PCGLCs.
BMP4 and its downstream signaling components have been shown to play a crucial role in PGC differentiation. Smad5 null mice in particular have PGCs even though in a reduced number, but also develop ectopic PGCLCs. The second goal was thus to study the role of Smad5 (and Smad1) in the in vitro induction of PGCs, using our proposed method.
10
Material and Methods
1. Cell Culture
1.1
Cell lines
1.1.1 Non-transgenic cell line E14
Embryonic stem cell line ES-E14TG2a (E14) (ATCC, Manassas USA), derived from 129/Ola mice67 was used as a comparison baseline, since it has been widely used across laboratories.
1.1.2 Smad5
-/-Blimp:RFP
In order to create a reporter cell line, a crossing between strain C57BL/6 Smad5 heterozygous transgenic mice (Smad5+/-) and a C57BL/6, with a RFP protein linked to a Blimp1 promotor, transgene (B6.Cg-Tg(Blimp1-RFP1)Rbrc) (Riken, Wako, Japan), were performed. This would allow to track Blimp1 expression and to compare it with Smad5 null individuals in order to study the importance of this molecule.
1.1.3 Smad5
fl/flSmad1
fl/fland Smad5
-/-Smad1
-/-To assess the importance of downstream BMP4 signalling, a Smad1 Smad5 null cell line was used. The Smad5 null allele was obtained by flanking Exon2 together with a Neo-cassete, for Neomycin resistance selection, by loxP sites, generating Smad5flox/flox cells68. The phenocopy of these floxed mice is similar to that of conventional Smad5-/- mice69, displaying an abnormally elongated allantois with an enlarged base 70. Ectopic cells in the amnion and abnormal vessels were also observed, similar to what is already described for Smad5-/- mice69. Smad1 loxP flanked allele used was generated in a similar way as described by Tremblay71. A Cre recombinase-expression vector (pEFBOS-CreIRESpuro) was used for the excision of Smad1 and Smad5 alleles by homologous recombination72. 8x10 cells were suspended in a solution of 750µl of phosphate buffered saline (PBS) and afterwards 10µg of Cre recombinase-expression vector were added. Electroporation was done as described previously by Barnett and colleagues73. Cells were plated and allowed to grow in 2i medium for 48h, after which followed another 48h of 2µg/ml puromycin selection. 96 of the selected colonies were manually isolated, grown in 2i and genotyped as described70,71.
1.2
Mouse Embryonic Stem Cell (mESC) line Derivation
Females were checked every morning for plugs. The midday after the plug being detected was considered to be embryonic day (E)0.5. Pregnant females were sacrificed at E3.5, and the uterus along with the fallopian tube and ovaries were isolated and placed in M2 medium. The majority of the fat was removed and the uterus was cut under the fallopian tube and ovary and flushed with a syringe filled with M2 medium (Gibco, Carlsbad, USA) containing 1% Bovine Serum Albumin (BSA) Fraction V (Gibco). Blastocysts were collected using a mouth
11
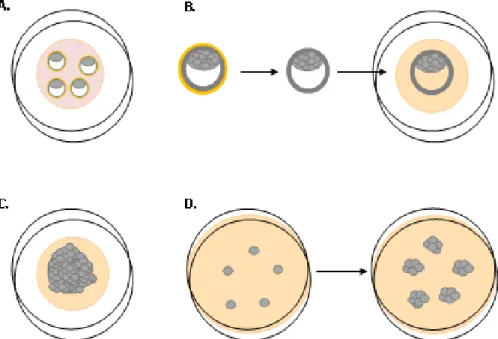
pipette and transferred to drops of KSOM+AA (Milipore, Bilerica, USA) with phenol red medium placed under mineral oil (Figure 5A).
After incubation for 24h at 37ºC and with 5% CO2, the E4.5 blastocysts were treated with
Tyrode's acid, while pipetting up and down, to remove the zona pellucida (ZP) (Figure 5B) and plated for 3 days in organ dishes, previously coated with 1% porcine skin gelatine, with N2B27 containing 2i + LIF to allow the cells to proliferate (Figure 5C) The N2B27 medium is described in detail in Table 3). The ICM outgrowth was picked, washed in 3 drops of PBS and incubated in 0.25% trypsine/EDTA for about 5 minutes followed by pipetting up and down in order to obtain single cells. Thereafter, the single cells were seeded in a 1.9 cm2 organ dish, previously gelatinized, until the colonies are big enough to trypsinize again (passage 1) (Figure 5D). After 3 to 4 passages a mESC line is considered established.
Figure 5. Representative scheme of a cell line derivation from blastocysts. (A) Blastocysts in
a drop of KSOM medium. (B) Detachment of the zona pellucida (here represented by the yellow color) after treatment with Tyrode’s acid (C) Growing ICM of the cultured blastocyst in N2B27+2i+LIF. (D) Single cells after picking and trypsinization will grow into colonies. The scheme is merely representative and not to scale.
12
1.2.1 Genotyping
In order to identify the derived cells genotype, these were directly collected from culture and subsequently lysed. The lysis was performed with a Proteinase K (Promega, Wisconsin USA) solution specified bellow (Table 1). The cells were kept in a shaker with the lysis solution for 2 hours at 55ºC at 750 rpm. The temperature was raised up to 96ºC for 10 minutes to inactivate the enzyme. For amplification of the queried transgenes the biological material was submitted to PCR. The PCR mix was prepared with SilverStar DNA polymerase (0,4μL of enzyme, 2,5 μL 10x reaction buffer, 2,5 μL of dNTPs 2,5mM each, 0,5 μL of each primer, 1 μL MgCl2 and 16,6 μL of H2O) (Table 2). The primers used were designed to amplify Smad5 (3’-TCTGGCCTCTTAATCCTGGACTTTCC-5’, 5’-GAGACTAGTGAGACGTGCTACTTCC-3’ as well as the
Smad5 KO sequence (5’-AAGAGAGTGGAGAGTCCAGGTAAG-3’, 3’-
ATGCAAATTGGGGAGGTACACGTT-5’)74, and RFP (5’- CGAGGACGTCATCAAGGAGT-3’, 3’- CTTGGCCATGTGTAGGTCT -5’), with expected band sizes of 700bp, 520bp and 541bp, respectively.
Table 1. Lysis buffer solution components.
Table 2. PCR programs for the Genotyping primers.
Smad5 RFP UBEX
Temperature Time (min) Temperature Time (min) Temperature Time (min)
94º C 03:00 94º C 03:00 94º C 05:00 94º C 00:15 Repeat 38x 94º C 00:30 Repeat 34x 94º C 00:15 Repeat 34x 60º C 00:45 60º C 00:30 64º C 00:20 72º C 00:45 72º C 00:30 72º C 01:00 72º C 07:00 72º C 05:00 72º C 07:00
Lysis buffer Proteinase K
Component Concentration Volume Component Concentration Volume
KCL 3M 3,3 ml Tris-HCL (ph8) 1M 100 µl Tris-HCL (ph8.3) 1M 2,2 ml CaCl2 1M 200 µl Gelatin 1mg/ml 20 ml Glycerol 100% 5 ml NP40 - 900 µl MQ - 5 ml Tween 20 - 900 µl ProtK - 100 mg MQ - 172.6 ml
13
1.2.2 Agarose gel Electrophoresis
The products of genotyping PCR were later submitted to electrophoresis in an agarose gel (UltraPure Agarose, Life Technologies Carlsbad USA). This technique was used in order to separate bands and visualise PCR reactions. Agarose was used mostly at 1.5% concentration in 1x TAE. Ethidium bromide was added in 0.2μg/mL concentration, which allowed visualisation of the bands under UV light owing to its DNA intercalating and fluorescent properties. Loading buffer was added in a proportion of 1:6, loading buffer to sample DNA, to allow visualisation of band migration during electrophoresis with the naked eye. Additionally, a 1Kb DNA ladder was added to the gel to estimate fragment size and left running for approximately 40 minutes at 100v of power. The agarose gel was imaged with AutoChemi System UVP (Bioimaging Systems).
1.3
Splitting
The mES cells were maintained in the ground state with a modified version of the classical N2B27 (Table 3). As described previously by Ying et al. (2003)20, supplemented with 1 µM PD0325901 (STEMGENT, Cambridge, USA) and 3µM CHIR99021 (Axon-Medchem, Groningen, Netherlands), together called as 2i (2 inhibitors) and 2000 U/ml of mouse Leukemia Inhibitory Factor (mLIF) (ESGRO Millipore, Billerica, USA) at a density of 30.000 cells per cm2. Medium was refreshed every day and cells split every other day. The wells were previously coated with 0.1% of porcine skin gelatine for 1 hour at room-temperature (RT) or 30 minutes at 37oC in the incubator. Cells were cultured under controlled environment of an incubator, at 37 ºC, with 5% CO2 and 20% O2.
The splitting consisted in washing the cells 3 times with PBS 1X, incubating them for 3 minutes in 0.05% tryspsin/EDTA gently tapping the culture plate.. This step was followed by trypsin inactivation through addition of N2B27+2i+LIF medium and by collection into a falcon tube. The cells were then centrifuged for 3 minutes at 1100 rpm, the supernatant was removed and they were ressuspended in 1 ml of N2B27+2i+LIF. The cells were then passaged 1:10 or counted using a Neubauer hemocytometer.
1.4
Cryopreservation
In order to keep a stock of the mESC lines they were routinely cryopreserved at least once per week. After trypsinisation, mESC were centrifuged, the supernatant discarded and resuspended in 500 µl of culture medium after which 500 µl of freezing medium (60% regular medium, 20% FCS and 20% DMSO) was added. The mESC (Cryo.s™ Greiner Bio-One) were either stored in the -80oC for 2 to 3 months or stored in the liquid nitrogen for longer term.
1.5
Thawing
For thawing of the cells, the vials were immediately put in the water bath at 37oC until it was possible to distinguish only a small pellet of frozen medium inside the cryovial. Afterwards the cryovial content was transferred to a falcon, centrifuged for 3 minutes at 1100 rpm, resuspended in the desired medium and placed in culture.
14
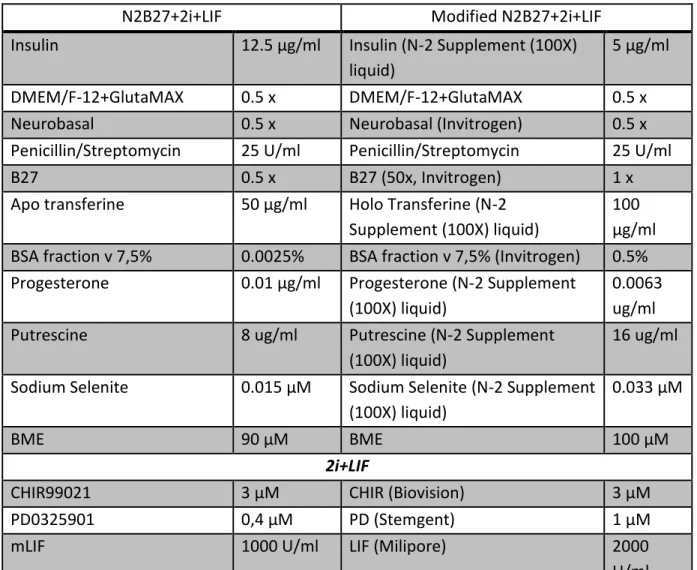
Table 3. Comparison of the components of N2B27+2i+LIF by Ying (2003) and the modified
version of the N2B27 used for this study.
N2B27+2i+LIF Modified N2B27+2i+LIF
Insulin 12.5 μg/ml Insulin (N-2 Supplement (100X) liquid)
5 μg/ml
DMEM/F-12+GlutaMAX 0.5 x DMEM/F-12+GlutaMAX 0.5 x
Neurobasal 0.5 x Neurobasal (Invitrogen) 0.5 x
Penicillin/Streptomycin 25 U/ml Penicillin/Streptomycin 25 U/ml
B27 0.5 x B27 (50x, Invitrogen) 1 x
Apo transferine 50 μg/ml Holo Transferine (N-2 Supplement (100X) liquid)
100 μg/ml BSA fraction v 7,5% 0.0025% BSA fraction v 7,5% (Invitrogen) 0.5% Progesterone 0.01 μg/ml Progesterone (N-2 Supplement
(100X) liquid)
0.0063 ug/ml
Putrescine 8 ug/ml Putrescine (N-2 Supplement
(100X) liquid)
16 ug/ml Sodium Selenite 0.015 μM Sodium Selenite (N-2 Supplement
(100X) liquid)
0.033 μM
BME 90 μM BME 100 μM
2i+LIF
CHIR99021 3 μM CHIR (Biovision) 3 μM
PD0325901 0,4 μM PD (Stemgent) 1 μM
mLIF 1000 U/ml LIF (Milipore) 2000
U/ml
1.6
Differentiation Media experimental design
mESCs were plated at 10 000 cells per cm2 on day 0 (D0) of the experiment either in N2B27 alone (Figure 6A and 6B) or in Mouse Embryonic Feeder, MEF, medium (Figure 6C), constituted by DMEM 41966 (Life Technologies), 10% FCS, 0,5% Penicilin/Streptomycin, 1% non-essential amino acids and 0.1mM BME. After 2 days (D2), when the cells became competent to respond to differentiation signals75, the media was refreshed: the set of the cells growing in N2B27 was refreshed with N2B27 containing 3µM of the inhibitor CHIR99021 (from here on also called C medium) and the other set with N2B27 alone (from here on also called N medium), while cells in MEF were refreshed with the same medium (from here on also called M medium). They were left to differentiate for 4 more days, for a total of 6 days (D6). At D6, the cells were either collected for Alkaline Phosphatase staining, QPCR or Immunostaining.
15
2. Alkaline Phosphatase staining
Alkaline phosphatase was performed as described previsouly76. Brief cells were fixed in a coverslip for 2 hours at 4ºC temperature in 4% PFA, washed 3 times with PBS, kept for 1 hour in 70% EtOH at 4ºC, followed by 3 times PBS wash and treated with the alkaline phosphatase reaction solution (Table 4). Enough solution was used to completely cover the bottom of the well. Cells in the staining solution were observed under the magnifier; the staining was evaluated by eye and stopped with tap water when a strong red colour was achieved. The final mounting was done in 70% glycerol.
Table 4. Components of the alkaline phosphatase aqueous solution reaction.
Component Percentage in Solution µl
Veronal 1% 500
Magnesium Chloride 0.12% 500
Fast RED 1 mg/ml 500
Sodium α-Naphtyl phosphate 0.02 mg/ml 500
Distilled water - 3000
Total - 5000
Figure 6. Conditions used for the 6 day differentiation of the mESCs cell lines. The media
used in treatment (A) Mesendoderm (ME) medium for the differentiation of the cells into mesendoderm-like cells with the addition of CHIR. Treatment (B) Neuronal (NE) medium. N2B27 alone has been shown to promote neuronal differentiation. (C) Spontaneous differentiation medium using regular MEF cells medium.
16
3. Analysis of gene expression
3.1
RNA isolation and cDNA synthesis
Cells were collected as a dry pellet obtained through centrifugation and removal of the supernatant. RNA was extracted using the RNeasy Micro Kit (Qiagen) and following the manufacturer’s instructions. The concentration and the purity of RNA were determined after RNA extraction using the NanoVue Spectrophotometer (GE Healthcare Life Sciences, Piscataway USA) and the QuBit Fluorometer (Life Technologies, Carlsbad USA).
Reverse transcription cDNA was synthesized with Bio-Rad iScript™ cDNA Synthesis Kit (BioRad, California USA) according to the manufacturers protocol (Table 5). As a control for DNA contamination the amplification of the cDNA by PCR was also performed without the reverse-transcriptase.
Table 5. Reverse transcription reaction mix and PCR program.
Reaction Mix iScript™ PCR program
5x iScript reaction mix Temperature Time (min)
Nuclease free water 25ºC 05:00
Up to 1 μg RNA 42ºC 30:00
iScript reverse transcriptase 85ºC 05:00
3.2
Quantitative reverse-transcriptase PCR (QPCR)
The relative amount of a target gene present in a sample was assessed with SYBR green® fluorophore PCR analysis. For one reaction, a primer mix for each gene was prepared with 10μl SYBR green® and 0.5 μl of the forward and reverse primers. The template mix was prepared with 3 μl of template cDNA diluted in 8μl of mQ water (Table 6A). The reaction was set in a 96-well plate (BioRad) on a PCR cooler (Eppendorf®) with 9μl of template mix and 11μl of the primer mix in each well. All the samples were analysed in triplicate together with the respective negative control (without the reverse transcriptase) and expression was normalised relatively to the geometric average of two house-keeping genes GAPDH (5´-TGCACCACCAACTGCTTAGC-3’, GGCATGGACTGTGGTCATGAG-5’) and β-actin (5’ -CCT GAA CCC TAA GGC CAA CCG-(5´-TGCACCACCAACTGCTTAGC-3’, 3’-TGT AGC CAC GCT CGG TCA GGA-5’) using the ΔΔCT method77. Adhesive PCR film (Eppendorf®) was used to cover the plate, which was afterwards centrifuged to remove any bubbles that may have formed during the pipetting process and could disturb the fluorescence signal reading. The plate was then inserted in a C1000 thermal cycler (BioRad) (Table 6B). The primers used are depicted in Table 7.
17
Table 6. A. Components used for the QPCR reaction mix solution and B. corresponds to the program used for the QPCR machine.
Table 7. QPCR primers sequence.
Gene Primer Product size (bp)
Forward Reverse
Oct4 TTCTAGCTCCTTCTGCAGGG AGAGGGAACCTCCTCTGAGC 115
Stella CGGGGTTTAGGGTTAGCTTT GGACCCTGAAACTCCTCAGA 110
Blimp1 TAGACTTCACCGATGAGGGG GTATGCTGCCAACAACAGCA 96
Nanog CTTTCACCTATTAAGGTGCTTGC TGGCATCGGTTCATCATGGTAC 112
GAPDH TTGATGGCAACAATCTCCAC CGTCCCGTAGACAAAATGGT 110
ACTB ACCATGTACCCAGGCATTG TACTTGCGCTCAGGAGGAG 101
4. Immunostaining
For immunostaining cells were grown on glass coverslips coated with 0.1% gelatine. Then they were fixed in 4% Paraformaldehyde (PFA), permeabilised in 0.1% Triton X-100 in phosphate-buffered saline (PBS) and blocked in 0.05% tween-20 in PBS containing 2% BSA. The primary and secondary antibodies were applied in blocking solution with 1% BSA, overnight at 4oC and 1 hour at RT, respectively. The secondary antibody was washed 3 times with PBS 1X. Nuclei were stained with DAPI (1:1000) for 1-2 minutes and washed 3 times with PBS 1X 5 minutes each. Finally the coverslips were mounted on a slide with 5µl of antifade mounting medium (Prolongold), left to dry overnight and sealed with nail polish.
The primary antibodies used were the following: Oct4 (1:200, Oct-3/4 Antibody (N-19): sc-8628), Nanog (1:200, ab80892, Abcam), Sox17 (1:200, AF1924, R&D systems), Brachyury-T
B. Reaction Mix Primer Mix 10 µl SYBR green® 0.5 µl Forward primer (10mM) 0.5 µl Reverse Primer (10mM) Template Mix 8 µl mQ water 1 µl Template cDNA Total 20 l A. QPCR program Temperature Duration 95oC 3 minutes 95 oC 15 seconds Repeat 40x 60 oC 1 minute 72 oC 30 seconds 72 oC 10 minutes Melt curve: 65 oC to 95 oC 0.5 o C each 5 seconds
18
(1:200, AF2085, R&D systems), β-catenin (1:200, 610153, BD Biosciences). All the Alexa Fluor secondary antibodies (Invitrogen) were used at 1:500 dilutions.
5. Imaging
Pictures of the stained cells were obtained with Leica microsystems DM5000 microscope and pictures produced with imageJ and photoshop CS6.
6. Statistical Analysis
Statistical analysis of the QPCR values was performed with STATISTICA. Mann-Whitney test was used to calculate if there is a pairwise difference between the distributions of the three conditions. The comparison was made using the 2-ΔΔCT values.
19
Results
1. Effects of cell density during mesendoderm (ME) differentiation
Culture conditions influence cell behaviour extensively and density in particular influences the differentiation ability of cells78. Our objective in this study is to have a simpler way to differentiate PGCLC, thus we first investigated if cell density would play an important role during the 6 day differentiation towards PGCLC in E14 cell line.CHIR has been shown to augment beta-catenin (canonical Wnt signalling) which on its turn downregulates Nodal signalling allowing the subsequent upregulation of BMP4 and phosphorylation of Smad1 and Smad59,27, which are important factors for PGC specification36,49,79. In addition, Wnt signalling enforced by CHIR was also shown to direct cells into meso/endoderm-specific differentiation in a more homogeneous manner when cultured in a monolayer (when compared with EB differentiation)13.
We tested different monolayer densities to assess the efficiency of the mesendoderm (ME)-differentiation protocol: 1 × 10⁴, 2 × 10⁴ and 3 × 10⁴ of E14 mESCs per cm2. The density of 2 × 10⁴ and 3 × 10⁴ cells/ cm2 were shown to be the optimal density for regular feeder-free cell passaging, higher densities resulting in cell death and lower concentrations found to block cell proliferation66.
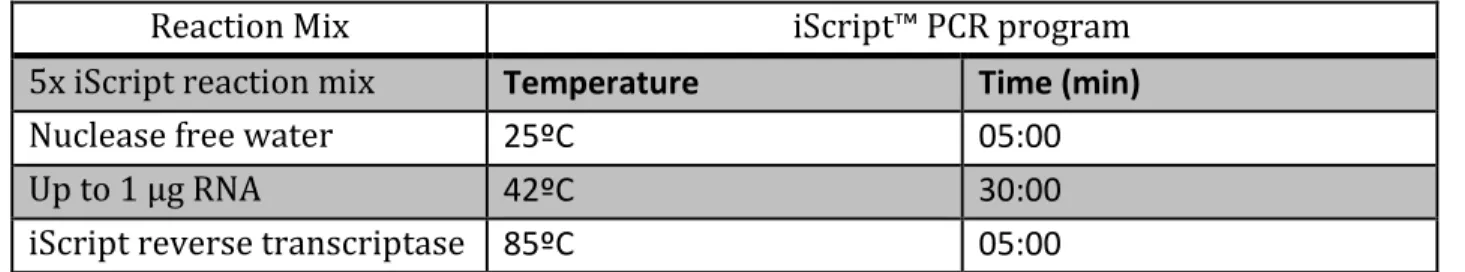
We observed AP-positive clusters (presumably PGCLCs clusters) only when the cells were seeded at a density of 1 × 10⁴ cells/cm2 (Figure 7A). At higher density, AP-staining was reduced to background levels and most of the differentiated cells displayed a flattened morphology66,80 (Figure 7B and C). The density used for further experiments was thus 1 × 10⁴ cells/ cm2.
Figure 7. Alkaline phosphatase staining of E14 mESCs after 6 days of ME-differentiation. The
cells were plated at different initial densities: (A) 1 × 10⁴ cells/cm2 is the only condition that shows AP-positivve cells (B) 2 × 10⁴cells/cm2, and (C) 3 × 10⁴ cells/cm2. The scale bar is 500 µm.
20
2. ME markers are upregulated in E14 after 6 days ME-differentiation
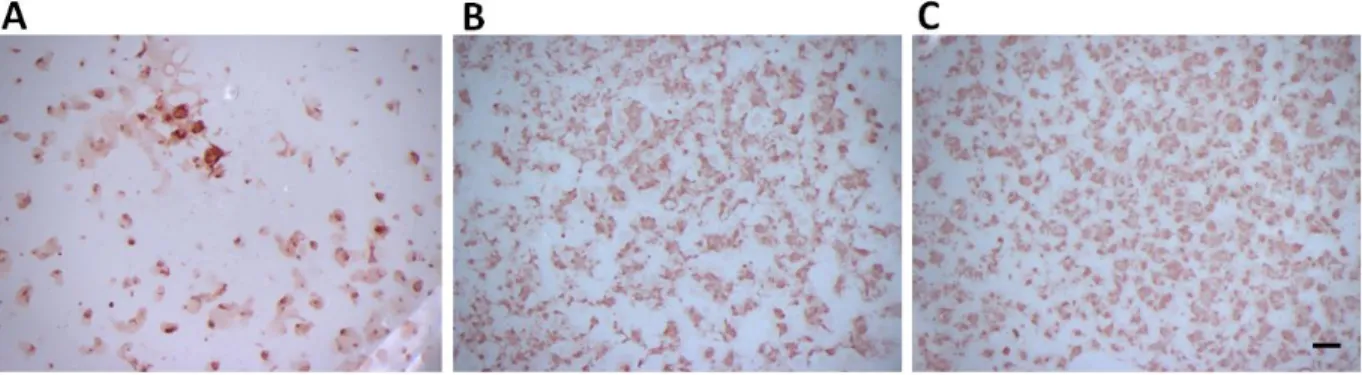
It is known that Wnt signalling pathway (inhibition of GSK-3β) not only promotes self-renewal in mESCs when combined with PD and LIF but is also capable of inducing cells to become ME progenitors81. When E14 mESCs are induced to differentiate through inhibition of GSK-3β, after 7 days, the cells begin to express T-brachyury, Sox17, Gata2, Nkx2.5, Hand1, Foxa2, AFP and Gata481. The first two, the core mesodermal regulator Brachyury-T and endodermal Sox17 will be examined here by immunofluorescence together with Nanog. The latter is a pluripotency factor which is required to decrease in order to allow the cells to evade the pluripotency network loop, allowing differentiation to occur (later emerging again in migrating PGCs82).In E14 ESCs differentiated for 6 days in MEF medium (spontaneous differentiation), it is possible to distinguish some cells expressing SOX17 (endoderm marker) and BRACHYURY-T (mesoderm marker) and some NANOG positive cells (Pluripotency or presumptive PGCLCs). However, mESCs differentiated to ME showed high levels of SOX17 and BRACHYURY-T compared to spontaneous differentiation and neurectoderm (NE) differentiation. Moreover, the number of NANOG positive cells in ME-differentiation condition was higher and concentrated in larger NANOG-positive clusters, suggesting a higher number of presumptive PGCLCs (Figure 8A).
3. PGC markers are upregulated in E14 after ME differentiation
The analysis of certain lineage markers would permit to distinguish whether the differentiated mESCs have differentiated into PGCLCs (when expressing Blimp1 and/or Stella, but also expressing pluripotency markers Nanog and Oct4) or other lineages (no expression of the pluripotency markers Nanog, Oct4, Stella, but eventually Blimp1 which is expressed by endoderm cells as well).
Using QPCR, the relative expression of Oct4, Nanog, Blimp1 and Stella, after normalisation to the house keeping genes GAPDH and beta-actin, was studied. We expected a slight increase in PGC markers because it is expected that cells becoming ME will be the majority of cells and only a few will become PGCLCs, since in the ME-inducing protocol the yield of PGCs was also relatively low (8% at 4 days of culture after Blimp-positive cell selection which occur in 21% of the cells, giving a yield of approximately 1.6%4).
In differentiated E14 cells, Oct4 and Nanog decreased using all 3 differentiation protocols suggesting loss of pluripotency83,84. However, in the ME-differentiation, the E14 retained higher Oct4, Nanog and Blimp1 expression and most importantly, the ME-protocol resulted in the strong upregulation of Stella, suggesting increased differentiation to PGCLCs. The induction of ME could indeed increase the production of PGCs during differentiation of E14 mESCs (Figure 8B).
21
Figure 8. Immunostaining and QPCR of E14 cells after 6 days of differentiation. (A) In the
MEF condition (spontaneous differentiation) there are few cells expressing NANOG while SOX17 and T are not expressed. In N2B27 condition (NE-differentiation) there is also expression of NANOG while the mesendodermal markers are absent. The N2B27+CHIR condition (ME-differentiation), the condition expected to generate mesoderm and endoderm in larger quantities, shows expression of SOX17 and BRACHYURY-T in addition to NANOG. Scalebar is 100µm. (B) Relative expression of pluripotency and PGCs markers in E14 cells after 6 days ME-differentiation. Expression values were normalised to expression of housekeeping genes and are shown in relation to undifferentiated mESC in the 2i condition. Raw ct values can be found in Supplemental Table 1.
N2
B
27
+CHIR
N2
B
27
ME
F
A
B
NANOG SOX17 BRACHYURY-TOct4 Nanog Blimp1 Stella Oct4 Nanog Blimp1 Stella
22
4. Derivation of Smad5 KO Blimp1:rfp mESCs lines
After developing a protocol that allowed differentiation to PGCLCs after 6 days (ME-differentiation protocol), we investigated the role of Smad5 in (ME-differentiation to PGCLCs in vitro using a Smad5 KO Blimp:rfp mouse model. For this, we attempted to derive Smad5 KO Blimp:rfp mESC lines. We derived three independent mESC lines (from three different embryos, resulting of a crossing between Smad5+/- Blimp1+/- male mouse with a Smad5+/- female mouse), that were named 1.2 (Smad5 WT), 1.3 (Smad5 KO) and 1.4 (Smad5 Het), but none of the lines expressed the Blimp1:rfp transgene.
The genotype of each of the newly derived ESC line was determined by genomic PCR using Smad5 and RFP specific primers. To visualise the amplification products the samples were loaded in an agarose gel and submitted to electrophoresis (Figure 9).
Figure 9. Genotyping of mESC lines. Determination of which transgene is carried by each
cell line is depicted in the gels in addition to the sex assessment of the cell lines. Cell line PCR product bands are indicated with 1.2, 1.3 and 1.4 above their respective lanes. (A) Agarose gel containing Smad5 KO PCR products, with a band size of 520bp. K.O. lane serves as a positive control as it contains material from a previously confirmed Smad5+/- mouse. WT lane represents the negative control. (B) Gel for Smad5 WT gene, with a size of 700bp. K.O. and WT lanes are both positives controls. Since the K.O. mouse used for control was heterozygous it also has a band for the Smad5 WT gene. (C) Gel containing RFP PCR products of 541bp of length. RFP+ and RFP- are positive and negative controls, respectively. The control DNA used was from mice previously tested for the RFP gene. (D)UBEX PCR for assessing the cells sex chromosomes. Males, which contain XY sex chromosomes, have two bands, one for the X chromosome (with 217bp of length) and another for the Y chromosome (with 198bp) while females have only one band corresponding to XX sex chromosomes. The lane where mQ is indicated is a control for contamination and instead of biological material, H2O was added to the PCR mix. In all gels a
23
Despite the derivation efforts, no Smad5 KO mESCs line containing the Blimp1:gfp reporter was generated (Figure 9 and Table 1).
Table 1. Genotyping final results of transgenic cell lines.
Cell line UBEX Smad5 K.O. Smad5 WT RFP
Smad5 KO*Blimp:RFP 1.2 ♀ - + -
Smad5 KO*Blimp:RFP 1.3 ♀ + - -
Smad5 KO*Blimp:RFP 1.4 ♂ + + -
5. Derivation of Smad5 and Smad 1 KO mESCs lines
As we were unable to derive Smad5KO Blimp1:rfp mESCs, we decided to use a double Smad1/5 mutant mESCs instead of the single Smad5 KO, since we no longer had the advantage of having the Blimp1:rfp.
5.1
ME markers are upregulated in Smad1
fl/flSmad5
fl/flWT mESCs
The results from ME-differentiation protocol Smad1fl/fl Smad5fl/fl WT mESC line showed NANOG-positive cells with neighbouring SOX17 positive cells, in a tight structure (Figure 10A). The latter, similar to the results obtained for E14 cell line, suggests the presence of PGCLCs after 6 days of ME-differentiation. Mesoderm (BRACHYURY) was also successfully induced in the ME protocol and resulted in a typical elongated structures of mesoderm. Although the other differentiation protocols were able to induce mesendodermal marker expression as well, there were relatively less expressing cells and NANOG cells did not display a cluster-like structure (Figure 10A).
As for the PGC markers studied by QPCR, our analysis showed no Stella expression but instead an increase in Blimp1, suggesting that they are differentiating towards mesendoderm or PGC precursors (Blimp1 positive/Stella negative) (Figure 10B). This also indicates that the cells likely require a protocol adjustment, for example differentiation during a longer period.
5.2
ME markers are upregulated in Smad1
-/-Smad5
-/-KO mESCs
Although we do not expect to see Stella expressing cells in ME-differentiated Smad1-/- Smad5-/- KO mESCs, we still wanted to assess the capacity of the KO cells to differentiate into mesendoderm. Thus, we tested 3 different Smad1-/- Smad5-/- KO mESCs lines for 6 days ME-differentiation. After immunofluorescence, we observed the presence of endoderm (SOX17-expressing cells), but less than in the Smad1fl/fl Smad5fl/fl WT mESC (except for Smad1-/- Smad5 -/-KO 1.35). Furthermore the induction of mesoderm (BRACHYURY-T) was similar to that of the