Programa de Doutoramento em Biologia
Tese de Doutoramento
Global patterns of marine biodiversity and the potential
impact of climate change
Joana Sousa e Silva Boavida-Portugal
Orientador(es) | Fran¸cois Guilhaumon Miguel Bastos Ara´ujo Rui Afonso Bairr˜ao da Rosa
´
Programa de Doutoramento em Biologia
Tese de Doutoramento
Global patterns of marine biodiversity and the potential
impact of climate change
Joana Sousa e Silva Boavida-Portugal
Orientador(es) | Fran¸cois Guilhaumon Miguel Bastos Ara´ujo Rui Afonso Bairr˜ao da Rosa
´
pelo Diretor da Instituto de Investiga¸c˜ao e Forma¸c˜ao Avan¸cada:
• Presidente | Diogo Figueiredo (Universidade de ´Evora)
• Vogal | Jo˜ao Carlos de Sousa Marques (Universidade de Coimbra) • Vogal | Adelino Vicente Mendon¸ca Can´ario (Universidade do Algarve)
• Vogal | L´ucia Maria das Candeias Guilhermino (Universidade do Porto - Instituto de Ciˆencias Biom´edicas Abel Salazar)
• Vogal | Pedro R. Almeida (Universidade de ´Evora)
• Vogal-orientador | Miguel Bastos Ara´ujo (Universidade de ´Evora)
´
Nothing is permanent. Everything is subject to change.
1
AGRADECIMENTOS
Quero agradecer a todas as pessoas que me apoiaram neste percurso e tornaram esta tese possível. Foi uma experiência extremamente enriquecedora. Obrigada!
Em primeiro lugar quero agradecer aos meus orientadores pelo apoio durante a realização desta tese de doutoramento. Ao Doutor Miguel Araújo pela incrível oportunidade de entrar num mundo completamente novo para mim. Foi uma aprendizagem extraordinária e alterou por completo a forma como olho para a biologia. Merci au Dr François Guilhaumon de partager avec moi votre passion pour R, il me reste encore beaucoup à apprendre de vous. Ao Doutor Rui Rosa por me ter incentivado e motivado a realizar esta tese de doutoramento, foi um salto para o desconhecido para ambos, mas que tanto nos alargou os horizontes.
Agradeço também às instituições me acolheram, o CIBIO\InBio, grupo Climate Change and Biodiversity (BIOCHANGE) da Universidade de Évora e o MARE – Centro de Ciências do Mar e do Ambiente, Laboratório Marítimo da Guia - Faculdade de Ciências da Universidade de Lisboa. E à Fundação para a Ciência e Tecnologia (FCT) pelo bolsa que me permitiu desenvolver este doutoramento (SFRH/BD/51514/2011).
Obrigada aos meus colegas do grupo BIOCHANGE, por tão bem me terem recebido, particularmente à Márcia, ao Diogo e à Dora. Quero agradecer ainda a todos os colegas do Laboratório Marítimo da Guia, em especial à Catarina, Gisela, Marta e Ricardo, pela amizade, cachorros, noitadas de trabalho, cumplicidade, bolas de berlim e muita alegria. Fiquei mais rica por partilhar aquele forte, à beira mar plantado, com vocês.
Obrigada aos meus amigos por todos os momentos especiais, que muito me ajudaram a manter alguma sanidade mental. Obrigada Ana, Cláudia, Marta, Rita G. e P., Selma, Sofia e Susanne por todo o apoio. E um obrigada muito especial à Ana João, por tudo!
Quero agradecer à minha família, sem o apoio de todos esta tese não seria possível. Em especial quero agradecer à minha irmã Inês por toda a ajuda e pragmatismo. À minha irmã Natacha pelo apoio. E ao meu pai por me ter ensinado a voar, sendo sempre a minha rede. Por fim quero agradecer à Luísa, pelo tanto que me ensina todos os dias.
3
TABLE OF CONTENTS
List of abbreviations and units ……….5
List of figures ………7
List of tables ... 11
Abstract and Keywords ... 13
Resumo e Palavras-chave ... 15
CHAPTER 1 General introduction ... 17
CHAPTER 2 Climate change impacts on the distribution of coastal lobsters………..………..……41
CHAPTER 3 Global patterns of cephalopod coastal diversity under climate change………..…..61
CHAPTER 4 Global diversity and catch potential of small pelagic fishes in the end of the 21st century………89
CHAPTER 5 Final remarks and future perspectives ………..119
5
LIST OF ABBREVIATIONS AND UNITS
atm Atmosphere(s) Chl Clorophyll CO2 Carbon Dioxide
DRS Delta Richness
EEZs Economic Exclusive Zones e.g. For Example
ENM Ecological Niche Model
ENSO El Niño and The Southern Oscillation ESM Earth System Models
etc. Et cetera g Gram(s)
GCM General Circulation Model GDP Gross Domestic Product GES Gas Emission Scenario H Hydrogen
HS Habitat Suitability
ISSCAAP International Standard Statistical Classification of Aquatic Animals and Plants IPCC Intergovernmental Panel on Climate Change
i.e. That is Km Kilometer(s) Kg Kilogram(s) M meter(s)
MCP Maximum Catch Potential
MOC Meridional Overturning Circulation MRP Maximum Revenue Potential
NOAA National Oceanic and Atmospheric Administration
OECD Organization for Economic Cooperation and Development O2 Oxygen
ppm Parts per Million psu Practical Salinity Unit
p-value Probability of the test statistic
RCP Representative Concentration Pathway SDM Species Distribution Models
SPACC Small Pelagic and Climate Change Program SRES Special Report on Emissions Scenarios SSS Sea Surface Salinity
SST Sea surface temperature TSS True Skill Statistic
Ton Tons
USD United State Dollar (s) μmol Micromole(s)
% Percentage °C Degree Celsius ± Approximately
7
LIST OF FIGURES
CHAPTER 1 – General introduction
Fig. 1 A) Carbon dioxide concentration levels from previous 800 thousands of years until August 2018 [Source: NOAA (2018)]; B) projected surface temperature changes for the late 21st century - temperatures are relative to the period 1850-2012; colors indicate
different data sets [Source: IPCC (2014)].
Fig.2 Meridional Overturning Circulation [Source: IPCC (2007)].
Fig. 3 Predicted changes between the baseline and the end-century period, according to
IPCC most extreme scenarios (RCP 2.6 and 8.5) for the climatic variables used in this thesis: pH at surface (‘pH’, in mol H kg−1), sea surface salinity (‘SSS’), sea surface
temperature (‘SST’, in °C), dissolved oxygen concentration at surface (‘O2’, in mol m−3).
Fig. 4 Global impacts attributed to climate change based on the available scientific
literature since the IPCC Fourth Assessment Report (AR4 in 2007). Symbols indicate categories of attributed impacts, the relative contribution of climate change (major or minor) to the observed impact and confidence in attribution [Source: IPCC (2014)].
Fig. 5 Exclusive Economic Zones projected to contain one or more new fishery stocks by
2100, using RCP 8.5 scenario [Source: Pinsky et al. (2018)].
Fig. 6 Exclusive Economic Zones projected to contain one or more new fishery stocks by
2100, using RCP 8.5 scenario.
Fig. 7 Ecological niche models for climate change projections schematic.
Fig. 8 Illustration of the relationship between the different distributional areas of a
species in geographic and environmental space, and its modelled distribution and niche [Source: Araújo & Peterson (2012)].
CHAPTER 2 – Climate change impacts on the distribution of coastal
lobsters
Fig. 1 Predicted species richness for A) coastal lobster assemblage, B) spiny lobster and
C) clawed lobster families, in the baseline and end-century periods according to the RCP 4.5 scenario. Left panel shows mean richness for coastal lobster species predicted per latitude for the baseline period (blue line) and end-century (red line) scenario.
8
Fig. 2 Predicted changes in species richness for A) coastal lobster assemblage, B) spiny
lobster and C) clawed lobster families, between baseline and end-century periods, under the RCP 4.5 scenario. Inland shades of grey represent coastal lobster* global capture production per country [* see table S01 for species used; 2016 data (ton)].
Fig. 3 Projected changes in species richness for the coastal lobster genera with
commercial relevancy (A) Panulirus, B) Jasus, C) Homarus and D) Nephrops) between the baseline and end-century periods, under RCP 4.5 scenario. Inland shades of grey represent coastal lobster* global capture production per country [* see table S01 for species used; 2016 data (ton)].
Fig. S01 Multi-model mean Standard Deviation across model means per scenario and
time period as a measure of precision.
CHAPTER 3 – Global patterns of cephalopod coastal diversity under
climate change
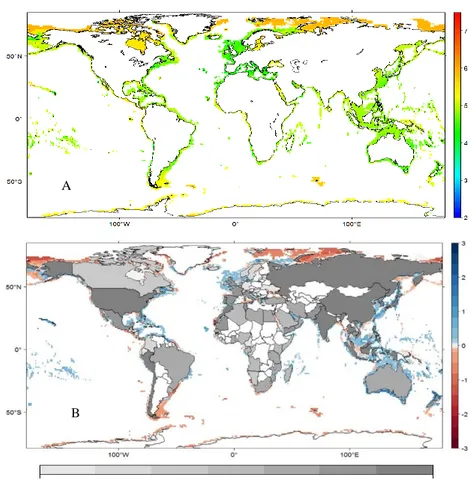
Fig.1 Projected richness for the baseline and the end-of-century period, under IPCC AR5
RCP4.5 scenario, for coastal cephalopods and its main groups (cuttlefishes (n=76), squids (n=69), octopuses (n=11)).
Fig. 2 Predicted changes in richness and composition between the baseline and the
end-of-century period, under IPCC AR5 RCP4.5 scenario, for the coastal cephalopods assemblages. Changes in diversity are quantified using delta richness (DRS) and changes in composition using the βratio index.
Fig. 3 A) Distribution of geometric mean body size (log) projected for the cephalopod
group, in the baseline period. Lateral panel represents mean body size predicted for the baseline (blue line) and for future (red line) period. B) Net differences in geometric mean body size predicted between the two periods. In land Cephalopod Global Capture Production per Country [(ton) 2016 data - FAO, 2016].
Figure S01 Multi-model mean Standard Deviation across model means per scenario and
time period as a measure of precision.
Figure S02 Multivariate Environmental Similarity Surfaces (MESS) analyses for RCP 4.5
scenario. Cells shown in red indicate areas where at least one environmental variable value occurs outside the range of values in the baseline (training) period.
9
Figure S03 Biogeographic framework. The biogeographic regions used in this work were
adapted from the Realms defined by Spalding et al. (2007). We created 3 extra realms to insure the biogeographical division of the Atlantic and Pacific Ocean (extras realms correspond to 1, 14 and 15). Legend: 1-Eastern Temperate Northern Pacific, 2-Artic, 3- Eastern Temperate Northern Atlantic, 4-Western Temperate Northern Pacific, 5-Eastern Tropical Atlantic, 6-Western Indo-Pacific, 7-Central Indo-Pacific, 8-Eastern Indo-Pacific, 9- Tropical Eastern Pacific, 10-Temperate South America, 11-Temperate Southern Africa, 12-Temperate Australasia, 13-Southern Ocean, 14-Western Temperate Northern Atlantic, 15- Western Tropical Atlantic.
CHAPTER 4 – Global diversity and catch potential of small pelagic fishes in
the end of the 21
stcentury
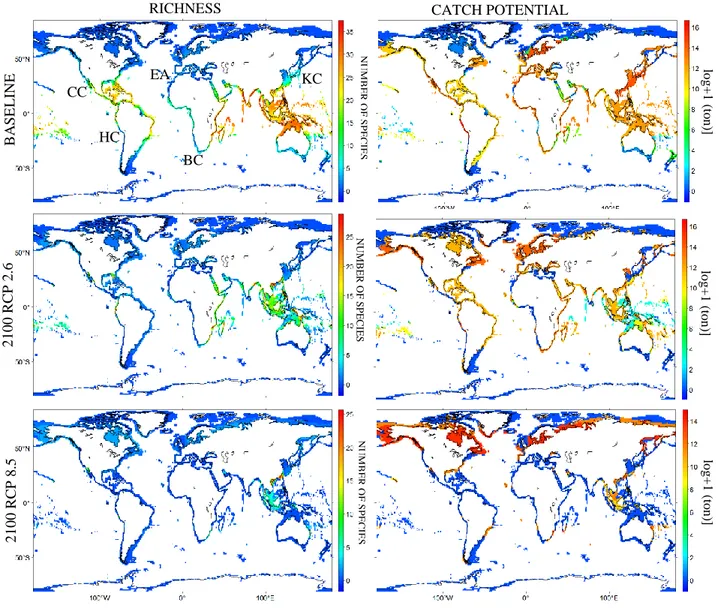
Fig. 1 Projected richness and catch potential for small pelagic fishes for the baseline and
end-of-century periods, under the RCP 2.6 and 8.5 scenarios. Acronyms represented in the first map indicate the location of SPACC regions: CC – California Current; HC – Humboldt Current; EA – European Atlantic; BC – Benguela Current; KC – Kuroshio-Oyashio Current.
Fig. 2 Projected changes in richness and catch potential (log+1) for small pelagic fishes
between the baseline and end-of-century periods, under the RCP 2.6 and 8.5 scenarios. Losses are represented in red and gains in blue. In land shades of grey represent small pelagic fishes* global capture production per country (* defined as the herrings, sardines, anchovies ISSCAAP div/group; 2016 data (ton)).
Fig. 3 A) Projected geographic range size variation (measured as the number of cells
where the species is present) for small pelagic fishes (as sum of all species) and decomposed in the major groups (anchovies, herrings and sardines) for the baseline (green) and end-of-century periods, under the RCP 2.6 (blue) and 8.5 (red) scenarios. B) Variation in projected catch potential (log) for small pelagic fishes and decomposed in the major groups (anchovies, herrings and sardines) for the baseline (green) and end-of-century periods, under the RCP 2.6 (blue) and 8.5 (red) scenarios.
Fig. 4 A) Latitudinal shifts projected for the major SPF species (ANCHOVIES: Engraulis
encrasicolus, Engraulis japonicus, Engraulis mordax, Engraulis ringens; HERRINGS: Clupea harengus, Clupea pallasii; SARDINES: Sardinops sagax, Sardina pilchardus), in the
10
baseline (green) and end-of-century periods, under the RCP 2.6 (blue) and 8.5 (red) scenarios. B) Variation in projected catch potential (ton) for the major SPF species, in the baseline (green) and end-of-century periods, under RCP8.5 and RCP2.6.
Fig. S01 Projected richness and catch potential for sardine species for the baseline and
end-of-century periods, under the IPCC AR5 RCP 2.6 and 8.5 scenarios.
Fig. S02 Projected richness and catch potential for anchovy species for the baseline and
end-of-century periods, under the IPCC AR5 RCP 2.6 and 8.5 scenarios.
Fig. S03 Projected diversity and abundance for herring species for the baseline and
end-of-century periods, under the IPCC AR5 RCP 2.6 and 8.5 scenarios.
Fig. S04 Projected changes in richness and catch potential for small pelagic major groups
(sardines, anchovies and herrings) between the baseline and end-of-century periods, under the IPCC AR5 RCP 2.6 and 8.5 scenarios.
Fig. S05 Relation between average changes in richness and Gross Domestic Product
(GDP) per person for the countries with continental shelf (N=88 countries). The trend line for RCP2.6 is modelled with γ=844χ+28002 (r2=0.35, P<0.005) and trend line for
RCP8.5 with y=649x+27963 (r2=0.35, P<0.005).
Fig. S06 Biogeographic regions used in this work [adapted from the realms proposed by
Spalding et al. (2007)]. Three extra realms were included to insure the biogeographical division of the Atlantic and Pacific Ocean (extras realms correspond to 1, 14 and 15). Legend: 1-Eastern Temperate Northern Pacific, 2-Artic, 3- Eastern Temperate Northern Atlantic, 4-Western Temperate Northern Pacific, 5-Eastern Tropical Atlantic, 6-Western Indo-Pacific, 7-Central Indo-Pacific, 8-Eastern Indo-Pacific, 9- Tropical Eastern Pacific, 10-Temperate South America, 11-Temperate Southern Africa, 12-Temperate Australasia, 13-Southern Ocean, 14-Western Temperate Northern Atlantic, 15- Western Tropical Atlantic.
Fig. S07 Standard deviation across climatic model means per scenario and time period
as a measure of variability in the multi-model ensemble of Earth System Models (ESM) used.
Fig. S08 Multivariate Environmental Similarity Surfaces (MESS) analyses for A) RCP 2.6
and B) RCP 8.5 scenarios. Cells shown in red indicate areas where at least one environmental variable value occurs outside the range of values in the baseline (training) period.
11
LIST OF TABLES
CHAPTER 2 – Climate change impacts on the distribution of coastal
lobsters
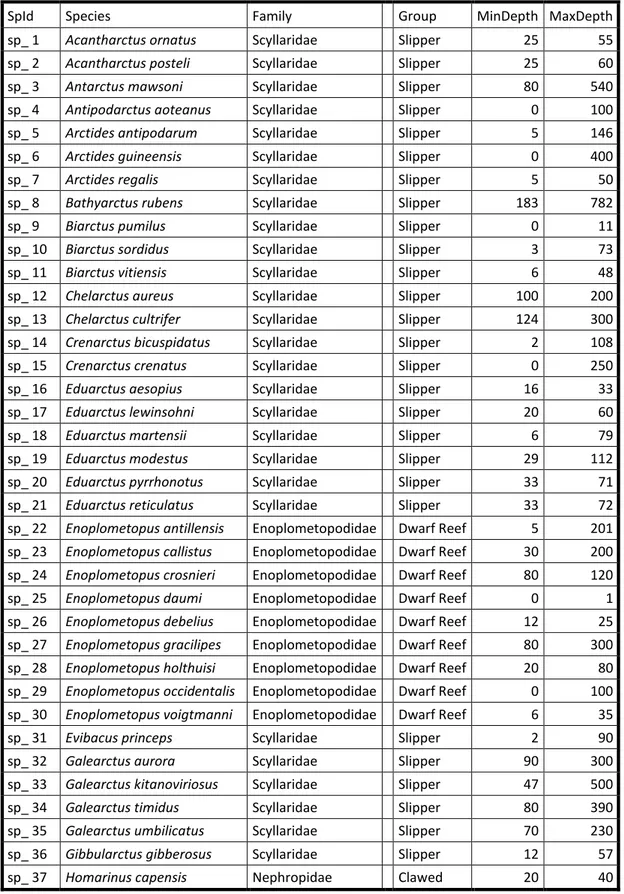
Table S01 List of the 125 coastal lobster species used in this study, with their group and
bathymetric range (min and max depth). Species marked with # are commercial fishing targets and with + are aquaculture productions.
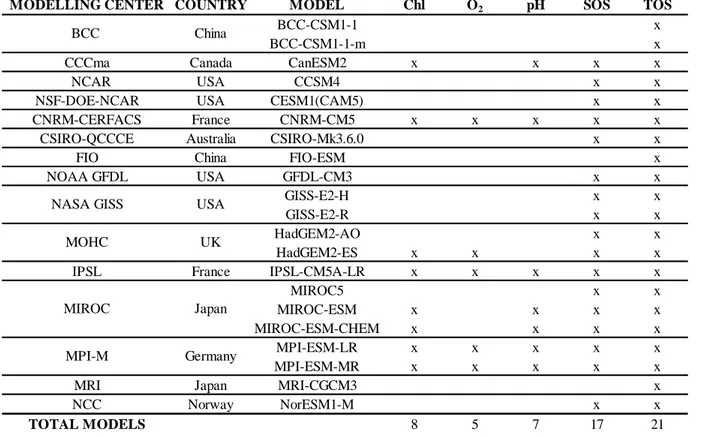
Table S02 The table shows the list of Earth System Models used for each variable
analysed. We considered only models that provided the complete series of data from 1860 to 2100 under the historical and RCP 4.5 experiment. The variables analysed included sea surface temperature (CMIP5 variable name ‘TOS’, in K (converted to ºC in this study)), sea surface salinity (‘SOS’, in psu), total chlorophyll mass concentration at surface (‘Chl’, in kg m−3), dissolved oxygen concentration at surface (‘O
2’, in mol m−3) and
pH at surface (‘pH’, in mol H kg−1).
CHAPTER 3 – Global patterns of cephalopod coastal diversity under
climate change
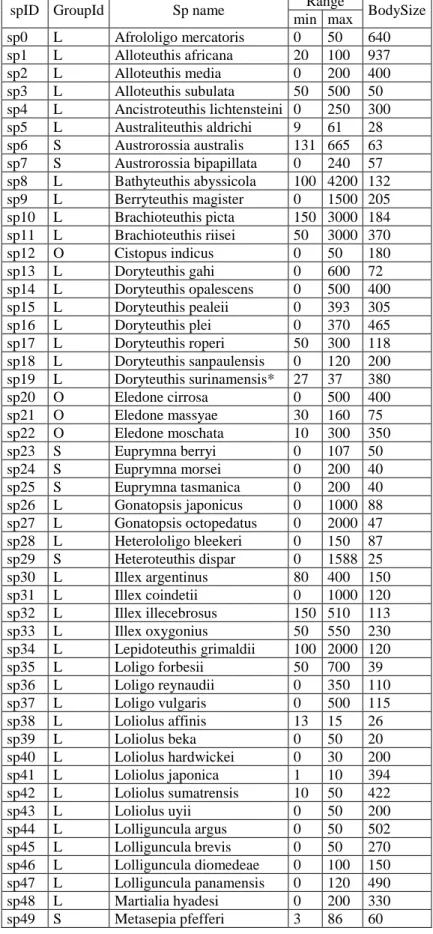
Table S01 List of the 161 costal cephalopod species used in this study (species marked
with * were excluded from the analyses due to few records) with their bathymetric range (min and max depth) and maximum body size (cm).
Table S02 Table showing the list of models used for each variable analysed. We
considered only models that provided the complete series of data from 1860 to 2100 under the historical and RCP 4.5 experiments. The variables analysed included sea surface temperature (CMIP5 variable name ‘TOS’, in K (converted to ºC in this study)), sea surface salinity (‘SOS’, in psu), total chlorophyll mass concentration at surface (‘Chl’, in kg m−3), dissolved oxygen concentration at surface (‘O
2’, in mol m−3) and pH at surface
(‘pH’, in mol H kg−1).
CHAPTER 4 – Global diversity and catch variation of small pelagic fishes in
the end of the 21
stcentury
Table S01 List of species used for this study, the bathymetric range occupied by each
species (Min and Max Depth in meters (m)), their standard body size (Bsize) in cm and the group they belong to. Species marked with (*) were excluded from the analysis due
12
to few records and the species marked with (#) represent the ones with economic value and were included in the abundance analysis.
Table S02 Earth System Models used for each variable analysed. We considered only
models that provided the complete series of data from 1860 to 2100 under the historical, RCP 2.6 and RCP 8.5 experiments. The variables analysed included sea surface temperature (CMIP5 variable name ‘TOS’, in K (converted to ºC in this study)), sea surface salinity (‘SOS’, in psu), total chlorophyll mass concentration at surface (‘Chl’, in kg m−3), dissolved oxygen concentration at surface (‘O
2’, in mol m−3) and pH at surface
13
ABSTRACT
Global patterns of marine biodiversity and the potential impact of climate change
Marine species are highly susceptible to climate change as demonstrated by several studies. However, most of these studies focus on few species or on restricted geographical areas. Within this context, the main goal of my dissertation is to characterize global patterns and forecast the effects of climate change on marine biodiversity. This work is the first macroecological approach to investigate the effects of climate change in the marine realm on key commercial marine groups, namely coastal lobsters (125 species), cephalopods (161 species) and small pelagic fish (103 species). Here I aimed to improve our understanding of how projected changes in species distribution might affect key marine species diversity, body size, assemblage composition, variations in catch, and finally infer on the potential impacts for fisheries worldwide. Using Ecological Niche Models (ENMs) the projected global diversity patterns of the analyzed species generally showed higher values in tropical areas and lower values in higher latitudes. Nonetheless, these patterns were projected to change significantly by the end of the century, with a general tendency of species tracking adequate habitat suitability to higher latitudes. The results obtained provide critical information to anticipate negative impacts of climate change on marine biodiversity and should be considered in future studies, as they highlight climate hot-spot areas or with highly vulnerable species. Ultimately, it is crucial to evaluate species adaptation potential and develop hybrid models that better can guide future political decisions on conservation and management measures.
Keywords: Climate change; marine biodiversity; ecological niche modelling;
15
RESUMO
Padrões globais da biodiversidade marinha e o potencial impacto das alterações climáticas
As espécies marinhas são altamente suscetíveis às alterações climáticas, como demonstrado em numerosos estudos. Porém muitos desses estudos focam-se num número reduzido de espécies ou numa determinada área geográfica (local ou regional). Neste contexto, a presente dissertação tem como objetivo investigar os padrões globais de biodiversidade marinha e projetar como estes poderão estar modificados no final do século. Este trabalho constitui a primeira abordagem macroecológica que investiga, numa escala global, os impactos das alterações climáticas em taxa marinhos com alto interesse económico, como lagostas (125 espécies), cefalópodes (161 espécies) e pequenos peixes pelágicos (103 espécies). Os padrões globais de biodiversidade marinha para todos os taxa analisados mostram maior riqueza na zona dos trópicos e menor número de espécies nas maiores latitudes. No entanto, estes padrões podem sofrer modificações significativas até ao final do século verificando-se uma tendência generalizada das espécies migrarem para latitudes maiores de forma a encontrarem refúgio em áreas com boa adequação ambiental. Os modelos usados nesta tese (modelos de nicho ecológico) projetam alterações significativas na distribuição das espécies analisadas, com impactos profundos na riqueza e abundância em áreas vitais para a saúde dos oceanos e para as pescas, a longo prazo. Esta dissertação representa um contributo importante para o conhecimento dos padrões globais da biodiversidade nos oceanos futuros. Servindo os seus resultados para orientar estudos pormenorizados em áreas de risco elevado ou com espécies mais vulneráveis e informar a tomada de decisões com vista a proteção de espécies marinhas com elevado valor económico e ambiental. Contudo, atendendo aos efeitos das alterações climáticas já sentidos nos oceanos, é crucial avaliar a capacidade de adaptação destas espécies e encontrar modelos híbridos que melhor nos permitam orientar medidas de gestão e conservação futuras.
Palavras-chave: Alterações climáticas; biodiversidade marinha; modelos de nicho ecológico; macroecologia; cefalópodes; lagostas; pequenos peixes pelágicos.
17
CHAPTER 1
1. GENERAL INTRODUCTION
1.1
Global changes
1.1.1
Oceans
1.2
Impacts of climate change on marine biota and
ecosystems
1.3
Fisheries in a changing ocean
1.4
Ecological Niche Models
1.5
Objectives and thesis outline
1.6
References
18
1. GENERAL INTRODUCTION
1.1 Global changes
In the past the main drivers of global change were solar variation, plate tectonics, volcanism, proliferation and abatement of life, meteorite impact, resource depletion, changes in Earth's orbit around the sun and changes in the tilt of Earth on its axis (UNEP, 1993). Presently, there is overwhelming evidence that the main drivers of global change are associated with the human population growth and consumption, energy use, land use changes, and pollution (Vitousek, 1994). Global emissions and the accumulation of carbon dioxide (CO2) in the atmosphere rose dramatically during the 20th century (Fig.
1A). Since the industrial revolution fossil fuel combustion and industrial processes have released tons of carbon into the atmosphere and, at present, the value surpasses six billion metric tons per year (IPCC, 2013). Consequently, atmospheric CO2concentrations
have greatly increased from 280 ppm at pre-industrial levels to more than 400 ppm nowadays (NOAA, 2018).
Fig. 1 A) Carbon dioxide concentration levels from previous 800 thousands of years until August 2018 [Source: NOAA (2018)]; B) projected surface temperature changes for the late 21st century - temperatures are relative to the period 1850-2012; colors indicate
different data sets [Source: IPCC (2014)].
Climate experts predict that future levels may reach 1000 ppm by the end of the century (IPCC, 2014) if anthropogenic emissions remain within the same rates. Carbon accumulation overloads the atmosphere, and the consequently trapped heat causes Earth to warm. The globally averaged combined land and ocean surface temperature
19
data show a linear warming trend of 0.85°C [0.65 to 1.06] over the period 1880 to 2012 (Fig. 1B). The increasing CO2 concentrations in the atmosphere can remain in the
atmosphere or can be absorbed by the terrestrial biosphere or by the oceans (Le Quéré
et al., 2009).
1.1.1
Oceans
The global ocean regulates our climate and drives the weather, determining rainfall, droughts and floods. It also play a key role in mitigating climatic changes, sequestering heat and carbon from the atmosphere. The transport of heat, freshwater and dissolved gases by oceanic currents can have an important effect on regional climates, and the large-scale Meridional Overturning Circulation – MOC -, also referred to as thermohaline circulation (Fig. 2), is known to influence the climate on a global scale (Vellinga & Wood, 2002). Large-scale impacts of climate change on oceans are expected to include increases in sea surface temperature and mean global sea level, decreases in sea-ice cover, and changes in salinity, wave conditions, dissolved gases and overall ocean circulation (Brierley & Kingsford, 2009).
Fig.2 Meridional Overturning Circulation [Source: IPCC (2007)].
Changing climatic conditions and the increased freshwater influx in the polar regions have caused sea ice retreats from the coastline of Arctic countries from 150 km to 200 km (Stendel et al., 2008). The loss of ice in the Polar Regions could lead to a sudden acceleration of global warming, as ice reflects radiation and heat from the sun back into space. The absence of sea ice combined with ocean warming will lead to more evaporation and rainfall occurring in these sensitive regions, which in turn will speed up
20
sea ice loss. Global analyses show long-term freshening in the subpolar latitudes and a salinification of shallower parts of the tropical and subtropical oceans, which is projected to intensify under climate change scenarios (Palmer et al., 2019- Fig.3 SSS). This could lead to significant changes in the atmospheric hydrological cycle over the oceans and in changes in global oceanic circulation.
Furthermore, changes in the storage of heat and in the distribution of ocean salinity cause the ocean to expand or contract and hence change the sea level both regionally and globally. Global mean sea level rise is projected to continue during the 21st century, at a faster rate than observed from 1971 to 2010. Earth System Models (ESM) project a global rise in sea level for all RCP scenarios by the end of the 21st century, ranging from 0.26 to 0.82 m (IPCC, 2014). By the end of the 21st century, it is projected that sea level will rise in more than about 95% of the ocean area, with about 70% of the coastlines worldwide projected to experience a sea level change within ±20% of the global mean (Mimura, 2013).
Over the last 200 years, the ocean has absorbed around a third of the CO2 produced by
human activities and has absorbed over 90% of the extra heat trapped by the rising concentrations of atmospheric greenhouse gases (Gattuso et al., 2015). As a consequence of heat absorption from the atmosphere, oceans are becoming warmer, at a rate of approximately 0.1°C per decade, over the last decades. It is predicted that global mean surface temperature will increase between 1.1-6.4°C by the end of the century (Fig. 3 – SST), depending on the scenario used (IPCC, 2014).
By absorbing CO2, the ocean are also becoming more acidic – at a faster rate than any
other period in the past 65 million years. Since pre-industrial times, ocean’s pH has already dropped an average of 0.1 units (Dupont & Pörtner, 2013), and it is predicted that this process will lead to an increase of 15% to 109% in ocean acidity (Fig. 3 – pH), according to the scenario, by end century (IPCC, 2014).
The same physical processes that affect CO2 affect dissolved oxygen (O2) in the ocean,
but O2 is not affected by changes in atmospheric concentration (Hinkle, 1994). Changes
21
processes within the ocean, such as rate of renewal of thermocline waters, water formation, upwelling or biological export and respiration.
Fig.3 Predicted changes between the baseline and the end-century period, according to
IPCC most extreme scenarios (RCP 2.6 and 8.5) for the climatic variables used in this thesis: pH at surface (‘pH’, in mol H kg−1), sea surface salinity (‘SSS’), sea surface
temperature (‘SST’, in °C), dissolved oxygen concentration at surface (‘O2’, in mol m−3).
RCP 2.6 RCP p Te mp er at O2 Salin it y B C E F G H RCP 2.6 RCP 8.5
pH
SSS
SST
O
222
Dissolved oxygen changes in the ocean thermocline has generally decreased since 1960, at a mean rate of 0.63 μmol kg–1 per decade (Stramma et al., 2012). This long-term
deoxygenation trend is consistent with the expectation that warmer waters can hold less dissolved oxygen (solubility effect), and that warming-induced stratification leads to a decrease in the transport of dissolved oxygen from surface to subsurface waters (stratification effect; for review see Breitburg et al., 2018 ; Fig. 3 - O2).
Future ocean climate-related changes are expected to make organisms more susceptible to the impact of other pressures, such as overfishing, habitat destruction, and pollution. Climate change will challenge the marine biota across multiple levels of biological organization, from molecular to organismic level, and are predicted to elicit cascading effects on population, community and ecosystems dynamics (e.g. Beaugrand
et al., 2015). When species persistence is affected by climate change-related conditions,
organisms can respond by acclimatizing and adapting to new conditions, or by shifting their geographical distribution (Pecl et al., 2017). Changes in biodiversity may alter the community structure and possibly disrupt ecological interactions, enhancing the risk of species and ecosystems extinction (Camill, 2010).
1.2
Impacts of climate change on marine biota and ecosystems
For centuries, people have regarded the ocean as an inexhaustible source of food and a convenient dumping ground, often regarded too vast to be affected by anything we do. But in just a few decades, it became clear that the ocean has limits and that in many important parts of our seas the sustainability thresholds have been breached. The intensity of climate-related impacts varies with the interaction between climate-related hazards, with the vulnerability of the natural systems, with their ability to adapt and with the exposure to human impacts. Rising rates and magnitudes of warming and other changes in the climate system, accompanied by ocean acidification, increase the risk of severe, in some cases irreversible, detrimental impacts. Some risks are particularly relevant locally, while others are global (Fig. 4). The overall risks of future climate change impacts can be reduced by limiting the rate and magnitude of climate change, but the precise levels of climate change sufficient to trigger abrupt and irreversible change remain uncertain (IPCC, 2014).
23
Fig. 4 Global impacts attributed to climate change based on the available scientific
literature since the IPCC Fourth Assessment Report (AR4 in 2007). Symbols indicate categories of attributed impacts, the relative contribution of climate change (major or minor) to the observed impact and confidence in attribution [Source: IPCC (2014)].
For example, ocean acidification reduces the ability of coral reefs to re-establish from disturbances such as bleaching, cyclones and crown-of-thorns starfish outbreaks. If current rates of temperature rise continue, the ocean will become too warm for coral reefs by 2050 (Hoegh-Guldberg et al., 2017). This would potentially mean a major disruption to at least 25 percent of the biodiversity in the ocean, as well as the loss of productive fisheries and significant impacts on industries such as tourism. The loss of reefs as a barrier would increase the exposure of coastal areas to waves and storm systems.
Coastal systems and low-lying areas are also increasingly experiencing adverse impacts from sea level rise – submergence, coastal flooding, and coastal erosion. The loss of coastal ecosystems such as mangroves and seagrass beds increases vulnerability of
24
coastlines and people to the impacts of climate change. Many low-lying developing countries and small island states are expected to face severe impacts that, in many cases, could result in displacement of people, damage to ecosystems, and adaptation costs amounting to several percentage points of Gross Domestic Product (GDP) (UN-OHRLLS, 2015).
The best recorded climate-change-induced ecological consequences are changes in
phenology, i.e., in timing of vegetation development (Menzel & Fabian, 1999), in
spawning date in frogs and toads (Beebee, 1995), return date of migrant birds (Hüppop & Hüppop, 2003) and butterflies (Sparks et al., 2005), egg hatching date in insects (Visser & Holleman, 2001), laying dates in birds (Crick et al., 1997), etc. And in range
shifts, in the distribution of butterflies (Parmesan, 1999), breeding range (Thomas &
Lennon, 1999) or overwintering range (Austin & Rehfisch, 2005) of birds and in distributions of marine biodiversity (Cheung et al., 2009; Poloczanska et al., 2013), etc. Less widespread documented consequences of climate change are shifts in body size (Millien et al., 2006; Barange et al., 2010) and in changes in the strength of competition between species (e.g. Jiang & Morin, 2004).
There are several studies exploring latitudinal range shifts on marine species, as a response to environmental change (e.g. Perry et al., 2005; Mueter & Litzow, 2008; Jones & Cheung, 2014; Sunday et al., 2015) and/or depth range shifts (Dulvy et al., 2008). Such species responses may lead to local extinction and invasions, resulting in changes in the pattern of marine species distributions and richness. Local extinction refers to a species ceasing to exist in an area although it still exists elsewhere, while invasion refers to the expansion of a species into an area not previously occupied by it. Overall, changes in pattern of species richness may disrupt marine biodiversity and ecosystems, and impact commercial fisheries (e.g. Roessig et al., 2004; Ainsworth et al., 2011; Cheung et al., 2013b; Lam et al., 2016). A review (Poloczanska et al., 2013) of recent literature on quantitative analysis of the effect of anthropogenic climate change on community assemblages or distributional range of marine fish and invertebrates shows that the majority of the reviewed papers focus on a regional scale or on limited taxa. The lack of large-scale studies that encompasses a wide array of marine species is in contrast to the
25
situation prevailing in the terrestrial realm. The climate change-related impacts on marine biodiversity are projected to be intensified in the future, differing geographically and among taxonomic groups (e.g. Harley et al., 2006; Mellin et al., 2012; Caputi et al., 2013; Fernandes et al., 2017; FAO, 2018). Global perspectives on the impact of climate change on a wide range of marine species are vital to obtain a more complete picture of the climate change problem.
1.3 Fisheries in a changing ocean
One of the most direct impacts of climate change on marine ecosystem services is through fisheries. Given the significant increase in human population and demand for secure, sufficient and safe food supplies, it is critical to predict and anticipate the nature and magnitude of potential impacts of climate change on food production. Global marine fish landings are estimated officially at 80-85 million ton, with corresponding mean annual gross revenues around USD 100 billion annually (Swartz et al., 2012). Accounting for unreported catches, a recent study (Pauly & Zeller, 2016) updated the likely “true” annual global catch to be about 130 million ton. The global fisheries sector supports the livelihoods of between 660 to 820 million people worldwide, directly or indirectly, which is about 10–12% of the world’s population (FAO, 2016). Fish also provides more than 2.9 billion people with 20% of their animal protein needs and is a crucial source of micronutrients (Golden, 2016).
The consequences of fisheries collapse are complex. The ocean’s once abundant fisheries are increasingly unable to feed and provide livelihoods for the world’s rapidly expanding population. Average fish consumption per capita have been globally increasing from 9.9kg in the 1960s to 19.2kg in 2016 (FAO, 2016). Poor coastal communities who rely most directly on the ocean for food and livelihoods are particularly vulnerable – and often unfairly disadvantaged. Their vulnerability is a result of both their geographical location as well as their poverty situation. Being located at the waterfront, fishing and fish farming communities are exposed to climate related extreme events and natural hazards, such as hurricanes, cyclones, sea level rise, ocean acidification, floods and coastal erosion (Kalikoski et al., 2018). Hence, climate change
26
impacts could fundamentally alter the fishing industry in these communities (WWF, 2015).
Changes in ocean conditions are projected to beget shifts in the distribution range of marine species (e.g. Lam et al., 2016; Fernandes et al., 2017; Cheung et al., 2018; Lotze
et al., 2019), changes in primary and secondary productivity, and shifts in timing of
biological events (Pörtner, 2014). Marine species are gradually moving away from the equator into cooler waters, and, as a result, species from warmer waters are replacing those traditionally caught in many fisheries worldwide. These shifts could have negative effects including loss of traditional fisheries, decreased in profits and jobs, conflicts over new fisheries that emerge because of distribution shifts, food security concerns and a large decrease in catch in the tropics (Fig. 5; Cheung et al., 2013a; Pinsky et al., 2018; Free et al., 2019). Sumaila and Cheung (2010) estimated that the fishing sector may, globally, suffer from a $17–$41 billion loss in annual landed value, depending on the climate change severity, which may result in an annual loss in household income between $6 – $14 billion. They also reinforce the idea that the impacts to fishing sectors in developing countries are estimated to be 2–3 times higher than those for developed countries, under all the scenarios considered in the study.
Fig. 5 Exclusive Economic Zones projected to contain one or more new fishery stocks by
2100, using RCP 8.5 scenario [Source: Pinsky et al. (2018)].
Identifying responses to climate change is complicated by species interactions and multiple stressors. Major marine habitats and biodiversity hotspots are projected to encounter cumulative impact from changes in temperature, pH, oxygen and primary
27
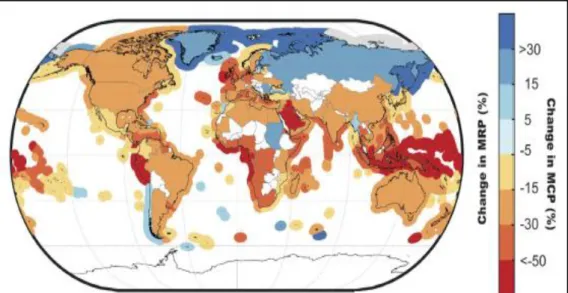
production by the end of 21st century (Mora et al., 2013). Acidification and hypoxia are projected to reduce maximum catch potential (MCP) in both the North Atlantic and Northeast Pacific (Ainsworth et al., 2011; Cheung et al., 2011). The combined effects of the projected distributional shifts and changes in ocean productivity under climate change are expected to lead to changes in species composition (Beaugrand et al., 2015) hence in the global redistribution of MCP, with projected increases in MCP in high latitudinal regions and decreases in the tropics (Fig. 6). This further highlights high vulnerabilities in the economies of tropical coastal countries (Johnson & Welch, 2010).
Changes in O2 content, as well as warming, are projected to drive a global decrease of
community-averaged maximum body size (Cheung et al., 2012), which may affect natural mortality rates and trophic interactions, and reduce yield-per-recruit and thus potential catch. Responses of exploited marine species and their fisheries may interact with other human stressors such as overfishing, exacerbating their impacts (e.g. Lindegren et al., 2010; Ainsworth et al., 2011).
Resource overexploitation appears to be the single most important factor directly threatening the sustainability of many commercial fisheries in Organization for Economic Cooperation and Development (OECD) countries (OECD, 2017). Overexploitation increases the vulnerability of fisheries to climate variability because few fish are left in the stock to grow and multiply in a year of poor recruitment. On the other hand, chronic levels of pollution are known to reduce marine and freshwater fish fecundity (Kime, 1995), decrease freshwater supply (which exacerbates low dissolved-oxygen concentrations), increase solid transport from erosion, and increase habitat fragmentation in inland waters (Carmignani & Roy, 2017). Development of marine aquaculture may also be affected by a decreasing availability of sites with cool enough surface water temperature and by increased susceptibility to disease (FAO, 2018).
Through species shifts climate change may also cause overlap of habitats of species targeted by fishing with habitat of threatened species, potentially increasing the chances of the latter being caught as bycatch (Jones et al., 2013). Moreover, differences in vulnerability and adaptive capacity of species to changing environmental and
28
ecosystem conditions will affect the response of fisheries to climate change (e.g. Griffith
et al., 2011; Bell et al., 2013). Analyses of fish physiological response to climatic changes
have shown significant detrimental, or even deleterious, effects (e.g. Rosa et al., 2014; Faleiro et al., 2016; Pimentel et al., 2016). Unfortunately, current knowledge appears to be limited mostly to single key species, abstracted from the wider ecosystem context that supports fisheries production. It is likely that extrapolation from these limited biological principles will provide only a bounded foresight, but understanding of how the projected changes will influence global fisheries is vital (Santos et al., 2016).
Fig. 6 Mean change in projected maximum catch potential (MCP) of 280 Exclusive
Economic Zones (EEZs) and mean change in projected maximum revenue potential (MRP) of 192 fishing nations by mid-century, under RCP 8.5 scenario [Source: Lam et al. (2016)].
1.4 Ecological Niche Models
As climate change is increasingly affecting ocean physical and biogeochemical environment (Halpern et al., 2008; Crain et al., 2009; Hoegh-Guldberg & Bruno, 2010; Pörtner, 2014), several studies have explored the projected impacts in marine biodiversity (e.g. Hoegh-Guldberg et al., 2008; Fisher et al., 2010; Hofstede et al., 2010; Hall et al., 2013; Gattuso et al., 2015; Frölicher et al., 2018). Within this context, statistical frameworks like Ecological Niche Models [ENMs - also known as Species Distribution Models (SDMs)], have received significant attention in the terrestrial realm and have been used for over two decades to project the potential effects of climate change on species distributions (e.g. Peterson et al., 2002; Araújo & Rahbek, 2006;
29
Thuiller et al., 2011; Garcia et al., 2014). But despite their wide range of theoretical and applied questions in the terrestrial realm, marine‐based applications remain relatively limited (e.g. Cheung et al., 2009; Lasram et al., 2010; Pereira et al., 2010; Kaschner et
al., 2011; Planque et al., 2011; Robinson et al., 2011; Albouy et al., 2012; Jones &
Cheung, 2014; Robinson et al., 2017).
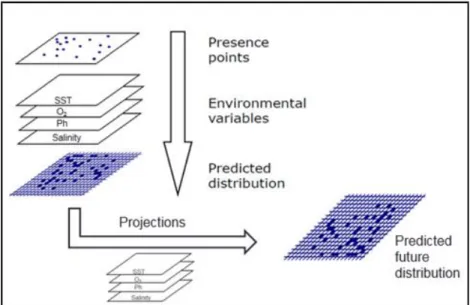
ENMs simulate the distribution of species in geographical space relative to climate. They are correlative models that create statistical relationships between observed presences of a species with values of environmental variables at those sites (Fig. 7). These models have several uses, but can be used under future climatic conditions to obtain an estimate of how species ranges may shift with climate change. The typical output of ENMs is a map of a species’ potential range (or potential habitat), either in the present or in both the present and the future (for review in ENMs see Elith & Leathwick, 2009; Araújo & Peterson, 2012).
Fig. 7 Ecological niche models for climate change projections schematic.
Although the relationship between climate and species ranges is well established (Woodward & Williams, 1987), as it is based on paleoecological studies (Webb & Bartlein, 1992), using ENMs to predict the impact of global warming on species distributions requires some assumptions and has several limitations (Elith & Graham, 2009). First, ENMs assume that species distributions is in equilibrium with the climate (i.e. species occupy all climatically suitable areas and are absent from all unsuitable
30
ones; Araújo & Pearson, 2005). A second assumption is stationarity of the empirical relations defined between environmental conditions and species distributions. This is reasonable when predicting for conditions that have analogues in the historical record, but becomes less reliable for responses to extreme events or for the novel conditions expected under climate change (Williams et al., 2007). Third, caution is advised when interpreting ENM’s results, as the relationships inferred may not adequately describe the factors determining species distributions. Spatial data on species distributions reflect the realized rather than the fundamental ecological niche (Fig. 8; Araújo & Peterson, 2012). This realized niche implicitly reflects biotic interactions as competition, mutualism, predation and barriers to species dispersal, not only environmental conditions (sampling incompleteness (either in geographical or environmental space) may also contribute to this (Peterson, 2011).
Fig. 8 Illustration of the relationship between the different distributional areas of a
species in geographic and environmental space, and its modelled distribution and niche [Source: Araújo & Peterson (2012)].
Lastly, ENMs are a “static” approach to modelling a species distribution, as they typically do not take into account species ability to move on geographical space (dispersal or migration), or do so in simple ways – usually assuming “all or nothing” dispersal or migration into new suitable habitat, or limited dispersal to contiguous suitable habitat (Araújo & Guisan, 2006; Heikkinen et al., 2006). Regardless of these limitations, ENMs use is widespread, with them being continually modified and improved to better cope
31
with methodological limitations (Guisan et al., 2006; Araújo & New, 2007; Nógues-Bravo, 2009; Araújo & Peterson, 2012; Fordham et al., 2012; Guisan et al., 2013; Garcia
et al., 2014; Araújo et al., 2019). Offering a good solution for undertaking relatively rapid
(and cheap) analysis over a large amount of species and/or geographical space.
Despite ENMs many assumptions and the uncertainty associated with their projections, particularly in a climate change context, they present valuable tools with enormous outreach. Knowing the level of uncertainty in their outputs is important not only for managers to understand and manage the risk of actions, but also for scientists to focus their efforts in advancing ecological niche modelling. Following known recommendations on uncertainty reduction can help ENMs achieve a more realistic picture of the future impacts of climate change on biodiversity (Araújo et al., 2019).
1.5 Objectives and thesis outline
Given the urgent need for an understanding of the consequences of climate change on the world’s oceans, the main goal of this dissertation is to characterize global patterns and forecast the effects of climate change on marine biodiversity. Overall, I aimed to investigate the effects of projected climate changes, under different mitigation scenarios, on the distribution of key commercial marine species worldwide, namely coastal lobsters (125 species), cephalopods (161 species) and small pelagic fish (103 species) species. I also aimed at improving understanding of how the projected changes in species distribution might impact important marine species diversity, body size, assemblage composition, variations in catch, and finally infer on the potential impacts for fisheries worldwide. The thesis is composed of five chapters and includes three scientific papers, one published and two submitted in peer‐reviewed international journals, which can be found from chapter 2 to 4.
Specifically, the main objectives of the chapters are presented below:
1. Give an overview on climate change in marine environment and on Ecological Niche Models (Chapter 1);
2. Predict the impacts of climate change on coastal lobster distribution and possible effects on fisheries worldwide (Chapter 2);
32
3. Evaluate the patterns of cephalopod coastal diversity and potential changes under climate change in richness, mean body size and assemblage composition (Chapter 3);
4. Analyse the impact of climate change in small pelagic fish species richness, catch potential and geographic range size (Chapter 4);
5. Resume the work presented in this thesis and give an outlook on future perspectives (Chapter 5).
33
1.6 References
Ainsworth CH, Samhouri JF, Busch DS et al. (2011) Potential impacts of climate change on Northeast Pacific marine foodwebs and fisheries. Ices Journal of Marine
Science, 68: 1217-1229.
Alagador D, Martins MJ, Cerdeira JO et al. (2011) A probability-based approach to match species with reserves when data are at different resolutions. Biological
Conservation, 144: 811-820.
Albouy C, Guilhaumon F, Leprieur F et al. (2012) Projected climate change and the changing biogeography of coastal Mediterranean fishes. Journal of
Biogeography, 40: 534–547.
Araújo MB, Anderson RP, Márcia Barbosa A et al. (2019) Standards for distribution models in biodiversity assessments. Science Advances, 5: eaat4858.
Araújo MB, Guisan A (2006) Five (or so) challenges for species distribution modelling.
Journal of Biogeography, 33: 1677-1688.
Araújo MB, New M (2007) Ensemble forecasting of species distributions. Trends in
Ecology & Evolution, 22: 42-47.
Araújo MB, Pearson RG (2005) Equilibrium of species' distributions with climate.
Ecography, 28: 693-695.
Araújo MB, Peterson AT (2012) Uses and misuses of bioclimatic envelope modelling.
Ecology, 93: 1527-1539.
Araújo MB, Rahbek C (2006) How does climate change affect biodiversity? Science, 313: 1396-1397.
Araújo MB, Rahbek C (2007) Conserving biodiversity in a world of conflicts. Journal of
Biogeography, 34: 199-200.
Austin GE, Rehfisch MM (2005) Shifting nonbreeding distributions of migratory fauna in relation to climatic change. Global Change Biology, 11: 31-38.
Barange M, Cheung WWL, Merino G, Perry RI (2010) Modelling the potential impacts of climate change and human activities on the sustainability of marine resources.
Current Opinion in Environmental Sustainability, 2: 326-333.
Beaugrand G, Edwards M, Raybaud V et al. (2015) Future vulnerability of marine biodiversity compared with contemporary and past changes. Nature Climate
Change, 5: 695-701.
Beebee TJC (1995) Amphibian breeding and climate. Nature, 374: 219-220.
Bell JD, Ganachaud A, Gerkle PC et al. (2013) Mixed responses of tropical Pacific fisheries and aquaculture to climate change. Nature Climate Change, 3: 591-599.
Breitburg D, Levin LA, Oschlies A et al. (2018) Declining oxygen in the global ocean and coastal waters. Science, 359: eaam7240.
Brierley AS, Kingsford MJ (2009) Impacts of Climate Change on Marine Organisms and Ecosystems. Current Biology, 19: R602-R614.
Buisson L, Thuiller W, Casajus N, Lek S, Grenouillet G (2010) Uncertainty in ensemble forecasting of species distribution. Global Change Biology, 16: 1145-1157. Camill P (2010) Global Change. Nature Education Knowledge, 3: 49.
Caputi N, Lestang S, Frusher S, Wahle RA (2013) The impact of climate change on exploited lobster stocks. In: Phillips BF (Ed) Lobsters: biology, management,
34
Carmignani JR, Roy AH (2017) Ecological impacts of winter water level drawdowns on lake littoral zones: a review. Aquatic Sciences, 79: 803-824.
Cheung WW, Watson R, Pauly D (2013a) Signature of ocean warming in global fisheries catch. Nature, 497: 365-368.
Cheung WWL, Bruggeman J, Butenschön M (2018) Projected Changes in Global and National Potential Marine Fisheries Catch under Climate Change Scenarios in the Twenty-First Century. In: Impacts of climate change on fisheries and aquaculture:
Synthesis of current knowledge, adaptation and mitigation options. [Barange M, Bahri T, Beveridge MCM et al. (Eds.)]. Fisheries and Aquaculture Technical Paper:
627, FAO, Rome, pp. 63-86.
Cheung WWL, Dunne J, Sarmiento JL, Pauly D (2011) Integrating ecophysiology and plankton dynamics into projected maximum fisheries catch potential under climate change in the Northeast Atlantic. Ices Journal of Marine Science, 68: 1008-1018.
Cheung WWL, Frölicher TL, Asch RG et al. (2016) Building confidence in projections of the responses of living marine resources to climate change. Ices Journal of
Marine Science, 73: 1283-1296.
Cheung WWL, Lam VWY, Sarmiento JL et al. (2009) Projecting global marine biodiversity impacts under climate change scenarios. Fish and Fisheries, 10: 235-251.
Cheung WWL, Sarmiento JL, Dunne J et al. (2012) Shrinking of fishes exacerbates impacts of global ocean changes on marine ecosystems. Nature Climate Change, 3: 254– 258.
Cheung WWL, Watson R, Pauly D (2013b) Signature of ocean warming in global fisheries catch. Nature, 497: 365-368.
Crain CM, Halpern BS, Beck MW, Kappel CV (2009) Understanding and managing human threats to the coastal marine environment. Annals of the New York Academic
Sciences, 1162: 39-62.
Crick HQP, Dudley C, Glue DE, Thomson DL (1997) UK birds are laying eggs earlier.
Nature, 388: 526.
Dulvy NK, Rogers SI, Jennings S et al. HR (2008) Climate change and deepening of the North Sea fish assemblage: a biotic indicator of warming seas. Journal of Applied
Ecology, 45: 1029-1039.
Dupont S, Pörtner H (2013) Get ready for ocean acidification. Nature, 498: 429.
Elith J, Graham CH (2009) Do they? How do they? WHY do they differ? On finding reasons for differing performances of species distribution models. Ecography,
32: 66-77.
Elith J, Leathwick JR (2009) Species Distribution Models: Ecological Explanation and Prediction Across Space and Time. Annual Review of Ecology Evolution and
Systematics, 40: 677-697.
Faleiro F, Pimentel M, Pegado MR, Bispo R, Lopes AR, Diniz MS, Rosa R (2016) Small pelagics in a changing ocean: biological responses of sardine early stages to warming. Conservation Physiology, 4: 1-9.
FAO (2016) Capture production 1950–2016. FishStat—Universal software for fishery statistical time series. http://www.fao.org/fishery/statistics /software/fishstatj/en. Accessed 6 Jun 2019
FAO (2018) Impacts of climate change on fisheries and aquaculture: Synthesis of current knowledge, adaptation and mitigation options. [Barange M, Bahri T, Beveridge
35
MCM et al. (Eds.)]. Fisheries and Aquaculture Technical Paper: 627, FAO, Rome, 654 pp.
Fernandes JA, Papathanasopoulou E, Hattam C et al. (2017) Estimating the ecological, economic and social impacts of ocean acidification and warming on UK fisheries.
Fish and Fisheries, 18: 389-411.
Fisher JaD, Frank KT, Leggett WC (2010) Global variation in marine fish body size and its role in biodiversity-ecosystem functioning. Marine Ecology Progress Series, 405: 1-13.
Fordham DA, Akcakaya HR, Araújo MB et al. (2012) Plant extinction risk under climate change: are forecast range shifts alone a good indicator of species vulnerability to global warming? Global Change Biology, 18: 1357-1371.
Fordham DA, Akcakaya HR, Brook BW et al. (2013) Adapted conservation measures are required to save the Iberian lynx in a changing climate. Nature Climate Change,
3: 899-903.
Free CM, Thorson JT, Pinsky ML et al. (2019) Impacts of historical warming on marine fisheries production. Science, 363: 979.
Frölicher TL, Fischer EM, Gruber N (2018) Marine heatwaves under global warming.
Nature, 560: 360-364.
Garcia RA, Araújo MB, Burgess ND, Foden WB, Gutsche A, Rahbek C, Cabeza M (2014) Matching species traits to projected threats and opportunities from climate change. Journal of Biogeography, 41: 724-735.
Garcia RA, Burgess ND, Cabeza M et al. (2012) Exploring consensus in 21st century projections of climatically suitable areas for African vertebrates. Global Change
Biology, 18: 1253-1269.
Gattuso J-P, Magnan A, Billé R et al. (2015) Contrasting futures for ocean and society from different anthropogenic CO2 emissions scenarios. Science, 349: aac4722.
Golden CDEA (2016) Nutrition: Fall in fish catch threatens human health. Nature, 534: 317-320.
Griffith GP, Fulton EA, Richardson AJ (2011) Effects of fishing and acidification-related benthic mortality on the southeast Australian marine ecosystem. Global Change
Biology, 17: 3058-3074.
Guisan A, Lehmann A, Ferrier S et al. (2006) Making better biogeographical predictions of species' distributions. Journal of Applied Ecology, 43: 386-392.
Guisan A, Tingley R, Baumgartner JB et al. (2013) Predicting species distributions for conservation decisions. Ecology Letters, 16: 1424-1435.
Hall J, Diaz RJ, Gruber N, Wilhelmson D (2013) The impacts of multiple stressors. A complex web of challenges. In: Managing Ocean Environments in a Changing
Climate. [Noone KJ, Sumalia US, Diaz RJ (Eds.)] Elsevier. San Diego, USA. pp.
193-221.
Halpern BS, Walbridge S, Selkoe KA et al. (2008) A global map of human impact on marine ecosystems. Science, 319: 948-952.
Harley CDG, Hughes AR, Hultgren KM et al. (2006) The impacts of climate change in coastal marine systems. Ecology Letters, 9: 228-241.
Heikkinen RK, Luoto M, Araújo MB et al. (2006) Methods and uncertainties in bioclimatic envelope modelling under climate change. Progress in Physical Geography, 30: 751-777.
Hinkle ME (1994) Environmental conditions affecting concentrations of He, CO2, O2 and
36
Hoegh-Guldberg O, Bruno JF (2010) The Impact of Climate Change on the World's Marine Ecosystems. Science, 328: 1523-1528.
Hoegh-Guldberg O, Hughes L, Mcintyre S et al. (2008) Ecology. Assisted colonization and rapid climate change. Science, 321: 345-346.
Hoegh-Guldberg O, Poloczanska ES et al. (2017) Coral Reef Ecosystems under Climate Change and Ocean Acidification. Frontiers in Marine Science, 4: fmars.2017.00158.
Hofstede R, Hiddink JG, Rijnsdorp AD (2010) Regional warming changes fish species richness in the eastern North Atlantic Ocean. Marine Ecology Progress Series,
414: 1-9.
Hüppop O, Hüppop K (2003) North Atlantic oscillation and timing of spring migration in birds. Procedings of the Royal Society B: Biological Sciences, 270: 233-240. IPCC (2007) Climate Change 2007: Synthesis Report. Contribution of Working Groups I,
II and III to the Fourth Assessment Report of the Intergovernmental Panel on Climate Change [Pachauri RK, Reisinger A (Eds.)]. IPCC, Geneva, Switzerland, 104 pp.
IPCC (2013) Climate Change 2013: The Physical Science Basis. Contribution of Working Group I to the Fifth Assessment Report of the Intergovernmental Panel on Climate Change [Stocker TF, Qin D, Plattner GK et al. (Eds.)]. Cambridge
University Press, Cambridge, United Kingdom and New York, NY, USA, 1535 pp.
IPCC(2014) Climate Change 2014: Synthesis report. Contribution of Working groups I,II and III to the Fifth Assessment Report of the Intergovernmental Panel on Climate Change [Pachauri RK, Meyer LA (Eds.)]. IPCC, Geneva, Switzerland, 151 pp. Jiang L, Morin PJ (2004) Temperature-dependent interactions explain unexpected
responses to environmental warming in communities of competitors. Journal of
Animal Ecology, 73: 569-576.
Johnson JE, Welch DJ (2010) Marine Fisheries Management in a Changing Climate: A Review of Vulnerability and Future Options. Reviews in Fisheries Science, 18: 106-124.
Jones MC, Cheung WWL (2014) Multi-model ensemble projections of climate change effects on global marine biodiversity. ICES Journal of Marine Science: Journal du
Conseil, 72: 741–752.
Jones MC, Dye SR, Fernandes JA et al. (2013) Predicting the Impact of Climate Change on Threatened Species in UK Waters. Plos One, 8: e54216.
Kalikoski DC, Jentoft S, Charles A et al. (2018): Understanding the impacts of climate change for fisheries and aquaculture: applying a poverty lens in Global and National Potential Marine Fisheries Catch under Climate Change Scenarios in the Twenty-First Century. In: Impacts of climate change on fisheries and
aquaculture: Synthesis of current knowledge, adaptation and mitigation options. [Barange M, Bahri T, Beveridge MCM et al. (Eds.)]. Fisheries and Aquaculture
Technical Paper: 627, FAO, Rome, pp. 41-62.
Kaschner K, Tittensor DP, Ready J, Gerrodette T, Worm B (2011) Current and Future Patterns of Global Marine Mammal Biodiversity. Plos One, 6: 0019653.
Kime DE (1995) The effects of pollution on reproduction in fish. Reviews in Fish Biology
and Fisheries, 52: 259-268.
Knutti R, Al. E (2017) A climate model projection weighting scheme accounting for performance and interdependence. Geophysic Research Letters, 44: 1909-1918.
37
Lam VWY, Cheung WWL, Reygondeau G, Sumalia R (2016) Projected change in global fisheries revenues under climate change. Scientific Reports, 6: 112-118.
Lasram FBR, Guilhaumon F, Albouy C et al. (2010) The Mediterranean Sea as a 'cul-de-sac' for endemic fishes facing climate change. Global Change Biology, 16: 3233-3245.
Le Quéré C, Raupach MR, Canadell JG et al. (2009) Trends in the sources and sinks of carbon dioxide. Nature Geoscience, 2: 831.
Lindegren M, Mollmann C, Nielsen A et al. NC (2010) Ecological forecasting under climate change: the case of Baltic cod. Proceedings of the Royal Society
B-Biological Sciences, 277: 2121-2130.
Lotze HK, Tittensor DP, Bryndum-Buchholz A et al. (2019) Global ensemble projections reveal trophic amplification of ocean biomass declines with climate change.
Proceedings of the National Academy of Sciences, 116: 12907.
Mellin C, Russell BD, Connell SD et al. (2012) Geographic range determinants of two commercially important marine molluscs. Diversity and Distributions, 18: 133-146.
Menzel A, Fabian P (1999) Growing season extended in Europe. Nature, 397: 659-665. Millien V, Lyons SK, Olson L et al. (2006) Ecotypic variation in the context of global
climate change: revisiting the rules. Ecology Letters, 9: 853-869.
Mimura N (2013) Sea-level rise caused by climate change and its implications for society.
Proceedings of the Japan Academy Series B: Physical and biological sciences, 89:
281-301.
Mora C, Wei CL, Rollo A et al. (2013) Biotic and Human Vulnerability to Projected Changes in Ocean Biogeochemistry over the 21st Century. PLoS Biology, 11: e1001682.
Mueter FJ, Litzow MA (2008) Sea ice retreat alters the biogeography of the Bering Sea continental shelf. Ecological Applications, 18: 309-320.
Noaa (2018) Earth System Research Laboratory Global Monitoring Division.
https://www.esrl.noaa.gov/gmd/ccgg/trends/gl_full.html. Accessed 3 Jun 2019.
Nógues-Bravo D (2009) Predicting the past distribution of species climatic niches. Global
Ecology and Biogeography, 18: 521-531.
OECD (2017) Organization for Economic Cooperation and Development.
https://data.oecd.org/. Accessed 7 Jun 2019.
Palacios DM, Baumgartner MF, Laidre KL, Gregr EJ (2013) Beyond correlation: integrating environmentally and behaviourally mediated processes in models of marine mammal distributions. Endangered Species Research, 22: 191-203. Palmer MD, Durack PJ, Chidichimo MP et al. (2019) Adequacy of the Ocean Observation
System for Quantifying Regional Heat and Freshwater Storage and Change.
Frontiers in Marine Science, 6: 58-66.
Parmesan C, Et Al. (1999) Poleward shifts in geographical ranges of butterfly species associated with regional warming. Nature, 399: 579-583.
Pauly D, Zeller D (2016) Catch reconstructions reveal that global marine fisheries catches are higher than reported and declining. Nature Communication, 7: 28-32. Pecl GT, Araújo MB, Bell JD et al. (2017) Biodiversity redistribution under climate change:
Impacts on ecosystems and human well-being. Science, 355: eaai9214.
Pereira HM, Leadley PW, Proenca V et al. (2010) Scenarios for Global Biodiversity in the 21st Century. Science, 330: 1496-1501.
![Fig. 1 A) Carbon dioxide concentration levels from previous 800 thousands of years until August 2018 [Source: NOAA (2018)]; B) projected surface temperature changes for the late 21 st century - temperatures are relative to the period 1850-2012; colors](https://thumb-eu.123doks.com/thumbv2/123dok_br/15607725.1053134/25.892.113.783.655.899/carbon-concentration-previous-thousands-projected-temperature-temperatures-relative.webp)

![Fig. 8 Illustration of the relationship between the different distributional areas of a species in geographic and environmental space, and its modelled distribution and niche [Source: Araújo & Peterson (2012)]](https://thumb-eu.123doks.com/thumbv2/123dok_br/15607725.1053134/37.892.191.700.520.864/illustration-relationship-different-distributional-geographic-environmental-distribution-peterson.webp)