Production and Characterisation of Activated Carbons
made from Coffee Industry Residues
João Valente Nabais
*1, Peter Carrott
1, M.M.L. Ribeiro Carrott
1,
Vânia Luz
1, Angel Ortiz
21
Universidade de Évora, Departamento de Química e Centro de Química de Évora, Rua Romão Ramalho, 59, 7000 Évora, Portugal
2
Departamento de Electrónica e Ingeniería Electromecánica, Escuela de Ingenierías Industriales, Universidad de Extremadura, Avda. de Elvas, s/n, 06071 Badajoz, Spain.
Email: [email protected]
Keywords
Activated carbon, activation, microporosity.
INTRODUCTION
The use of agricultural residues and sub products as precursors for producing activated carbons (AC) was studied in many papers published in the last decades. H owever, the search for new precursors that are cheap, accessible and with potential to create significant economic valorisation, as in the case of using industrial residues, is still needed. In this work we used, to our knowledge, a never tested precursor, the coffee bean endocarp. This lignocelulosic material represents a useless residue produced by the Portuguese coffee industry, NovaDelta-Comércio e Indústria de Cafés, S.A..
Besides the endocarp, also known as parchment or hulls, other coffee components have been recently used to produce AC, mainly coffee husks (Boonamnuayvitaya, 2005; Baquero, 2003) and coffee grounds (Hirata, 2002; Tsunoda, 1998).
EXPERIMENTAL
Activated carbon production
The precursor was used in cylindrical pellets and transformed into activated carbon by physical and chemical activation.
Physical activation
For the production of the AC about 40g of precursor and a horizontal tubular furnace were used. Carbonisation was carried out by heating to 700ºC at a rate of 5ºCmin-1 under a constant N2 flow of
85cm3min-1 and maintaining for 1h. Activation was carried out by switching to a CO2 flow of
85cm3min-1, maintaining for the appropriate time at 700ºC in order to obtain burn-offs within the range 13-36w% (indicated in the sample designations after AF7), switching back to the N2 flow and
allowing to cool to below 50ºC before removing the AC from the furnace and storing in a sealed sample flask. The activation was also performed at 800ºC (samples AF8). In this case a heating rate
*
of 10ºCmin-1 was used and similar carbonisation and flow rates conditions. The burn-offs obtained, 12-65w%, are also indicated in the sample designations.
Chemical activation
For the AC production about 10g of precursor and a horizontal tubular furnace were used. The precursor was mixed with powdered KOH to obtain impregnation ratios of 1:0.5, 1:1 and 1:2 (precursor:KOH). The pyrolysis of the mixtures was done under a constant N2 flow of 85cm3min-1
at 650, 750 and 850ºC for 2hours using a heating rate of 5ºC/min. Both pyrolysis temperature and impregnation ratio are included in sample designation as in the following example: AQTR; T=6,7,8 for 650, 750 and 850ºC; R=0.5, 1, 2 for 1:0.5, 1:1 and 1:2.
Materials Characterisation
The AC samples were characterized by FTIR, mass titrations, nitrogen adsorption isotherms at 77K and SEM/EDX.
RESULTS AND DISCUSSION Reactivity
The variation of burn-off with time of activation is shown in figure 1 for carbon dioxide activated samples. As would be expected, the rate of burn-off is much lower when the activation is carried out at 700ºC than at 800ºC. In each case the plot is linear, and from the slopes we can calculate rates of activation of 17.5 and 4.0w%/h. The KOH activated samples have pyrolysis yields within the range 13 to 24w%.
FIGURE 1: Burn-off as a function of activation time
Porosity and surface chemistry
The nitrogen adsorption isotherms, according to the IUPAC classification (Rouquerol, 1994), are all Type I which indicates that the AC are all microporous in nature. All the isotherms, not shown here, are reversible and have very low slope in the multilayer region indicating a low external surface area.
0 2 4 6 8 10 Activation time / h 0 20 40 60 80 B u rn -o ff / w % AF7 AF8
The isotherm analysis by the Brunauer-Emmett-Teller (BET), as and Dubinin-Radushkevich (DR)
methods are shown in table 1. The point of zero charge (pzc) is also shown in table 1.
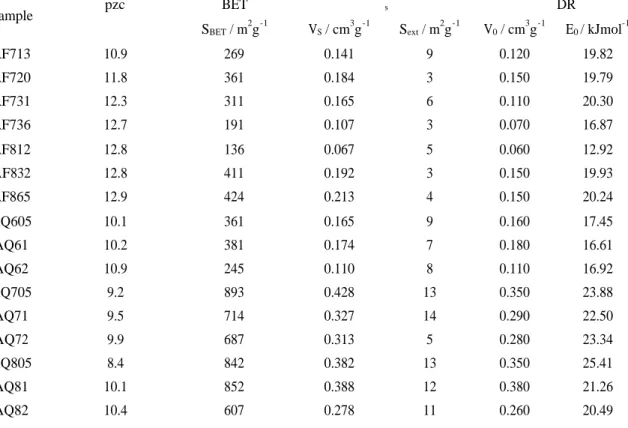
TABLE 1: Textural characterisation of the carbon samples by analysis of nitrogen adsorption isotherms at 77K
and pzc values determined by mass titration.
BET αs DR Sample pzc SBET / m 2 g-1 VS / cm 3 g-1 Sext / m 2 g-1 V0 / cm 3 g-1 E0 / kJmol -1 AF713 10.9 269 0.141 9 0.120 19.82 AF720 11.8 361 0.184 3 0.150 19.79 AF731 12.3 311 0.165 6 0.110 20.30 AF736 12.7 191 0.107 3 0.070 16.87 AF812 12.8 136 0.067 5 0.060 12.92 AF832 12.8 411 0.192 3 0.150 19.93 AF865 12.9 424 0.213 4 0.150 20.24 AQ605 10.1 361 0.165 9 0.160 17.45 AQ61 10.2 381 0.174 7 0.180 16.61 AQ62 10.9 245 0.110 8 0.110 16.92 AQ705 9.2 893 0.428 13 0.350 23.88 AQ71 9.5 714 0.327 14 0.290 22.50 AQ72 9.9 687 0.313 5 0.280 23.34 AQ805 8.4 842 0.382 13 0.350 25.41 AQ81 10.1 852 0.388 12 0.380 21.26 AQ82 10.4 607 0.278 11 0.260 20.49
Almost all samples show the presence of small and large slit shape micropores, as indicated by the difference between the values of V0 and VS. The physical activation at 800ºC leads to the formation
of samples with higher micropore volume and BET area, when compared with samples with similar burn-off degree but produced at 700ºC. The chemical activation with solid KOH gives more interesting samples from the porosity development point of view with total pore volume between 0.165 and 0.428cm3g-1 and BET area within the range 245 to 893m2g-1. We can also observe that impregnation ratio and pyrolysis temperature both influence the porosity development. For instance, VS reaches a maximum value for temperature of pyrolysis between 750 and 800ºC and impregration
ratio smaller than 0.6. The BET area is also maximised for the same pyrolysis temperature but for impregnation r a tio less than 1.2. These observations are better supported by the graphic representations, to be presented at the conference Carbon2006, obtained by fitting the results using the Kriging method and a polynomial function of the type Mp = α1X1i + α2X2i + α3X21i + α4X1iX2i +
α5X22i.
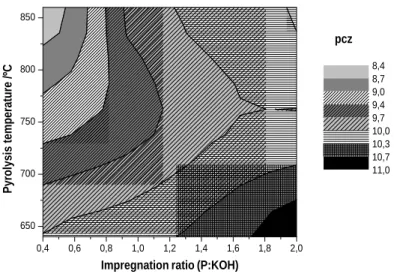
All samples are quite basic with pzc between 8 and 13, as can be observed in table 1. The physically activated samples have 2 different behaviours. On the one hand the activation at 700ºC shows a pzc increase with burn-off, and on the other hand the samples produced by activation at 800ºC have pzc almost constant. The KOH activation shows a pzc increase with impregnation ratio and with the pyrolysis temperature decrease, as can be seen in figure 2. The basicity of the materials is mainly due to the presence of pyrone functional groups, identified by FTIR, and to the delocalized
p electrons. Other functional groups present on the surface of the materials are phenol, alcohol, lactone, quinone and Si groups.
FIGURE 2: pzc Evolution during the KOH activation.
SEM/EDX
The precursor cylindrical shape was maintained during activation and, as can be seen in figure 3 and 4 the carbon dioxide activation lead to more homogeneous samples. On the other hand the chemical activated samples show a more heterogeneous surface morphology with the presence of some heteroatoms such as K, O, Ca, Si and K, as identified by SEM/EDX
FIGURE 3 SEM image of AF20 (a)(b), AQ705 (c)
CONCLUSIONS
The main conclusion is that the coffee hulls can be used as precursors for the production of activated carbons. This fact is relevant because it will contribute to the reduction of industrial residues in the Portuguese coffee industry creating at the same time economic surplus for a useless residue. We can also make the following principal conclusions:
1) All the produced AC’s are microporous with slit shape pores and very small external area. 2) Carbon dioxide activation leads to the formation of pore volume up to 0.22cm3g-1 whereas
KOH activation can produce AC with pore volume up to 0.43cm3g-1.
0,4 0,6 0,8 1,0 1,2 1,4 1,6 1,8 2,0 650 700 750 800 850 pcz
Impregnation ratio (P:KOH)
Pyrolysis temperature /ºC 8,4 8,7 9,0 9,4 9,7 10,0 10,3 10,7 11,0 (b) (a) (c)
3) For the KOH activation the best impregnation ratio is 1:0.5 (precursor:KOH) and the optimum pyrolysis temperature about 750ºC.
4) All the AC produced are very basic in nature with pzc bigger than 8.
Acknowledgements
The authors would like to thank Novadelta-Comércio e Indústria de Cafés, S.A. for the provision of the coffee hulls used as precursor.
References
Baquero, M.C., Giraldo, L., Moreno, J.C., Suárez-Garcia, F., Martínez-Alonso, A.M., Tascón, J.M.D. (2003). Activated carbons by pyrolysis of coffee bean husks in presence of phosphoric acid. Journal of Analytical
and Applied Pyrolysis 70, 779-784.
Boonamnuayvitaya, V., Sae-ung, S., Tanthapanichakoon, W. (2005). Preparation of activated carbons from coffee residue for the adsorption of formaldehyde. Separation and Purification Technology 42, 159-168.
Hirata, M. Kawasaki, N., Nakamura, T., Matsumoto, K., Kabayama, M., Tamura, T., Tanada, S. (2002). Adsorption of Dyes onto Carbonaceous Materials Produced from Coffee Grounds by Microwave Treatment., Journal of
Colloid and Interface Science 254, 17-22.
Tsunoda, R., Ozawa, T., Ando, J. (1998). Ozone Treatment of Coal - and Coffee Grounds - Based Active Carbons: Water Vapor Adsorption and Surface Fractal Micropores. Journal of Colloid and Interface Science 205, 265-270.
Rouquerol, J., Avnir, D., Fairbridge, C.W., Everet, D.H., Haynes, J.H., Pernicone, N., Ramsay, J., Sing, K.S., Unger, K.K. (1994). Recommendations for the characterization of porous solids. Pure and Applied Chemistry, 66 [8], 1739-1758.