Abstract—The purpose of the present work was to develop an innovative food product with nutritional properties as well as appealing organoleptic qualities. The product, a jam, was prepared with the beans’ cooking water combined with fresh apple or carrot, without the addition of any conservatives. Three different jams were produced: bean and carrot, bean and apple and bean, apple and cinnamon. The developed products underwent a sensorial analysis that revealed that the bean, apple and cinnamon jam was globally better accepted. However, with this study, the consumers determined that the bean and carrot jam had the most attractive color and the bean and apple jam the better consistency. Additionally, it was possible to analyze the jams for their chemical components, namely fat, fiber, protein, sugars and antioxidant activity. The obtained results showed that the bean and carrot jam had the highest lipid content, while the bean, apple and cinnamon jam had the highest fiber content, when compared to the other two jams. Regarding the sugar content, both jams with apple revealed similar sugar values, which were higher than the sugar content of the bean and carrot jam. The antioxidant activity was on average 10 mg TE/g.
Keywords—Bean jam, chemical composition, sensorial analysis, product acceptability.
I. INTRODUCTION
URRENTLY there is a wide evidence showing that consuming vegetables and fruits is advantageous in many ways for the human health, because these foods play an important role in the prevention of several diseases [1]–[3]. Increasing awareness among consumers about the importance of consuming healthy foods in preventing disease and improving quality of life has promoted increased consumption of fruits, vegetables and derived products [4].
According to the World Health Organization (WHO) and the United Nations Food and Agriculture Organization (FAO) a daily intake of 400g is recommended to benefit from the protective effect of fruit and vegetables. In the last decade about half the population of the countries members of the European Union consumed per capita an average of 275g of fruit and vegetables, and a compliance with the minimum recommendation would annually prevent about 26,000 deaths
R. P. F. Guiné is with the Research Centre CI&DET, Polytechnic Institute of Viseu, Campus Politécnico, Repeses, 3504 - 510 Viseu, Portugal (corresponding author to provide phone: 480700; fax: +351-232-480750; e-mail: [email protected]).
A. R. B. Figueiredo is with the Food Engineering Department, Agrarian School of Viseu, Quinta da Alagoa, Ranhados, 3500-606 Viseu, Portugal (e-mail: [email protected]).
P. M. R. Correia and F. J. Gonçalves are with the Research Centre CI&DET, Polytechnic Institute of Viseu, Campus Politécnico, Repeses, 3504 - 510 Viseu, Portugal (e-mail: [email protected], [email protected]).
of individuals aged less than 65 years in [5].
The low consumption of fruits and vegetables is among the top ten risk factors for the onset of diseases that can result in cases of premature death. To consume a large variety of fruits and vegetables provides important amounts of vitamins, minerals, fibers and other protective substances which ensure adequate nutritional intake. Thus, the development of food products that incorporate nutritional and bioactive ingredients contributes for improving the overall population health[6].
Consumers prefer to purchase high quality foods, as much similar as possible to fresh fruits and vegetables, following quality and safety standards and without the addition of preservatives [7].
The development of new products requires that they undergo a series of steps. Sensory analysis and consumer research are the most important tools that enable informed decision making. Consumer research can be defined as the problem related with new product development, data analysis and recommending actions to improve an organization’s marketing activities. Through consumer research we can understand the needs of consumers as well as their reactions to the new product[8].
Sensory evaluation is one of the last steps in product development and aims to characterize and measure sensory attributes of the product and/or to determine differences among products. It may be defined as the examination of the organoleptic characteristics of a product by the sense organs and hence its importance in evaluation of the final product [8].
II. EXPERIMENTAL PROCEDURE
A. Product Preparation and Formulation
The beans used were white beans (Phaseolos vulgaris) in the dried state. They were left in water for 10 hours and then cooked for 30 minutes. The water from cooking the beans was later used to prepare the jam.
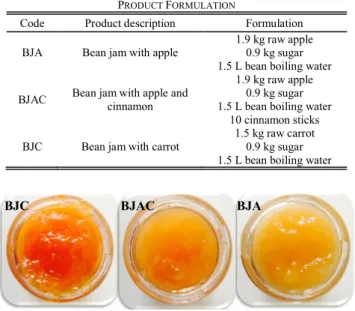
The carrot (Daucuscarota)and apple (Malusdomestica), depending on the type of jam, were each cooked in 1.5 L of the water obtained from boiling the beans, adding 0.9 kg of sugar (Table I). In the case of the bean jam with apple and cinnamon, cinnamon sticks were added during the apple cooking. The mixture was left cooking until obtaining the desired consistency. Fig. 1 shows the three variations of the product obtained.
For the sensorial analysis two more jams were prepared as control: one apple jam and one carrot jam, both with the same formulation as BJA and BJC, respectively, but using fresh water instead of using the water from boiling the beans. These control samples were named WJA and WJC, respectively for
Chemical and Sensorial Evaluation of a Newly
Developed Bean Jam
Raquel P. F. Guiné, Ana R. B. Figueiredo, Paula M. R. Correia, Fernando J. Gonçalves
C
apple and carrot.
TABLEI PRODUCT FORMULATION
Code Product description Formulation BJA Bean jam with apple
1.9 kg raw apple 0.9 kg sugar 1.5 L bean boiling water BJAC Bean jam with apple and
cinnamon
1.9 kg raw apple 0.9 kg sugar 1.5 L bean boiling water
10 cinnamon sticks BJC Bean jam with carrot
1.5 kg raw carrot 0.9 kg sugar 1.5 L bean boiling water
Fig. 1 Obtained bean jams: BJC –bean jam with carrot, BJAC–bean jam with apple and cinnamon and BJA–bean jam with apple
B. Chemical Analyses
The chemical analysis involved the determination of the lipids, sugars, protein, and fiber and antioxidant activity.
The fat content was determined using the Soxhlet method, wherein the fat is extracted from the sample by contact with an organic solvent which is subsequently separated. In this case, 5 g of the sample were used and the extraction solvent was petroleum ether. The extraction process was carried out for 16hours. After the solvent was removed by evaporation and the fat quantified gravimetrically[6].
The total nitrogen content was determined by the Kjeldahl method according to the method of AOAC (2000) [9]which consists in the mineralization of the sample with sulfuric acid in the presence of a catalyst based on copper and selenium for the release of the total nitrogen, followed the distillation and titration. The catalyst used was a saturated solution of copper sulphate. In each tube was placed 1 g of sample, 10 ml of sulphuric acid and 1 ml of copper sulphate. Then the tubes were placed in a mineralizer, programmed to 400 °C for 6 h. After cooling, the tubes were placed in the distiller. An Erlenmeyer tube (with 20 ml of boric acid (1% m/v)) was used to collect the distillate. The distillation took place, and the apparatus was pre-programmed to add to the Kjeldahl tube 50 ml of distilled water and 50 ml of sodium hydroxide (NaOH) at 35% (m/v). The crude protein content was determined by multiplying the total nitrogen content by the factor 6.38.
The sugar content was determined by refractometry, in the brix scale, where 1 ºBrix corresponds to 1g of sugar present in 100g of solution. To determine the sugar content 2 g of sample were diluted with 25mL of water, and the concentration was calculated as % sucrose [6].
Vegetable crude fiber consists in the cellulose organic residue obtained from the dried substance and free of fat, by removal of other sugars and protides, obtained with a boiling
treatment in an acid medium and then in a basic medium. For the determination, crucibles with 3 g of sample were placed in a Dosi-fiber apparatus. In each column (previously preheated on a hotplate), 150 mLH2SO4 (1.25%), was added. After the
boiling process corresponding to all the acid removal, the residue of each column were washed with 150 mL of distilled water, previously heated – this procedure was repeated three times. In a second phase, 150 mL of NaOH (1.25%) were added in each column, and repeated the procedure already described for H2SO4. Finally, the crucibles were removed from
the Dosi-fiber, filtered and placed in a conical flask connected to a vacuum pump, where they were washed with 5 mL of acetone (three times each), and placed in an oven at 104°C, until constant weight.
The extraction of the phenolic compounds was carried out through maceration and subsequent extraction with a solution of methanol:acetic acid (98:2) for 1 hour, with magnetic stirring at room temperature. The antioxidant capacity was determined by the method using the free radical 2,2’-azino-bis(3-ethylbenzthiazoline-6-sulphonic acid) ABTS. The results were based on the percentage of inhibition, compared with a standard antioxidant (Trolox) in a dose–response curve being expressed in Trolox equivalents. To a tube were added 100 µL of sample and 2 mL of ABTS, previously prepared, and it was placed in the dark at room temperature for 15 minutes. After that the absorbance of the samples was read in a spectrophotometer at a wavelength of 734 nm. The antioxidant activity was expressed as mg Trolox equivalent (TE) per gram.
For the analyses of fat content six repetitions were carried out in each sample, for fiber four repetitions were made and for all other chemical analyses three repetitions were used.
C. Sensorial Analysis
In order to evaluate the characteristics of the product and to access what variation of the product would gather better consumer acceptability a sensory analysis was undertaken. The panel was composed by 25 untrained tasters, aimed at stimulating the general consumers, aged between 18 and 50 years old.
The sensorial evaluation consisted in two tests: ordination and sensorial profile. For the ordination test five samples were used: BJC – Bean jam with carrot, BJAC– Bean jam with apple and cinnamon and BJA– Bean jam with apple, WJA - water jam with apple and WJC - water jam with carrot. Through this test was intended to achieve the preference of the panelists by comparing the different samples tasted. They were asked to rate samples from 1 - the sample they liked less to 5 - the sample they liked best.
In order to characterize the three samples of bean jam at study (BJC, BJAC, BJA) these were also these were also analyzed to establish their sensory profiles. For that several attributes were evaluated, namely: product color, aroma, consistency, sweetness, taste and an overall assessment. Each of these attributes was rated on a hedonic scale ranging from 1 to 4, where the number 1 corresponded to the lower limit (less intense, less pleasurable) and 4 corresponded to the higher BJC BJAC BJA
limit (very intense, very pleasurable).
D. Consumer Study
A consumer study was made by means of a gathering information about consumer preferences find a product that could be well accepted
launched on the market.
The study has a quantitative nature and
questionnaire with dichotomous and multiple choice questions. The sample was chosen by convenience and the questionnaire was applied by internet
validated questionnaires obtained was 1110
ages varied from 18 to 67 years. The inquired were mostly from the female gender (77%) against 23
gender.
III. RESULTS AND DISCUSSION
A. Chemical Properties
The results presented in Fig. 2 showed that the fat content was higher for sample BJC –bean jam with
followed by sample BJAC– bean jam with apple and cinnamon (4.50%) and finally sample BJA
apple (4.27%). The higher fat content in sample BJC could be explained by the higher fat content of carrot as com
apple. According to the USDA National Nutrient Database for Standard Reference, the fat content in raw apples without skin is 0.13 g/100 g whereas in raw carrots is 0.24 g/100 g
Fig. 2 Chemical properties of the bean jams analysed: BJAC jam with apple and cinnamon, BJC –bean jam with carrot and BJA
bean jam with apple
The fiber content was relatively low in all samples, varying from 0.9% in sample BJA to 3.0% in sample BJAC
Guiné et al. [11] reported values of total dietetic fiber for apples varying from 15 to 40 % dry basis, corresponding 0.3%-2.1% wet basis, which are similar for the range obtained in the present work for the jams produced with appl USDA National Nutrient Database for Standard Reference refers a value of 1.1 g/100 g of fiber for jams in general
Regarding the protein content only traces were detected, and therefore there is no measurable protein in the jams analyzed (Fig. 2).This would be expected, since fruits used to make jams usually are very poor in proteins.
by means of a survey aimed at formation about consumer preferences, so as to well accepted by consumers when a quantitative nature and was based on a questionnaire with dichotomous and multiple choice . The sample was chosen by convenience and the questionnaire was applied by internet. The number of validated questionnaires obtained was 1110 and the sample The inquired were mostly female gender (77%) against 23% from the male
ISCUSSION
showed that the fat content bean jam with carrot (6.76%) bean jam with apple and cinnamon (4.50%) and finally sample BJA–bean jam with in sample BJC could be higher fat content of carrot as compared to apple. According to the USDA National Nutrient Database for Standard Reference, the fat content in raw apples without skin is 0.13 g/100 g whereas in raw carrots is 0.24 g/100 g [10].
mical properties of the bean jams analysed: BJAC–bean ean jam with carrot and BJA–
was relatively low in all samples, varying from 0.9% in sample BJA to 3.0% in sample BJAC (Fig. 2). reported values of total dietetic fiber for apples varying from 15 to 40 % dry basis, corresponding to 2.1% wet basis, which are similar for the range obtained in the present work for the jams produced with apple. The USDA National Nutrient Database for Standard Reference
jams in general[10]. Regarding the protein content only traces were detected,
no measurable protein in the jams This would be expected, since fruits used to make jams usually are very poor in proteins. Megías-Pérez et
al. [12] reported a very low value for protein content (0.2%) in dehydrated apple fruit. The protein cont
in the USDA Database is 0.37 g/100 g
The amount of sugars was higher for those jams made with apple (63%) when compared to the jam made with carrot (50%) (Fig. 2). This is explained by the difference observed in the sugar content between carrots and apples, being apples much richer in sugars (10.10 g/100 g) than carrots (4.74 g/100 g) [10]. The amount of total sugars in jams accord
USDA Database is 48.50 g/100 g The antioxidant activity varied from being higher for the BJC sample activity is explained by the phenolic c
well as carotenoids in the case of carrot. Wang et al. reported values for total phenolic compounds in appl varying from 160 to 1060 mg Galic acid equivalent (GAE) per kg fresh weight (FW), and antioxidant activities measured by ABTS method in the range 3.6
and Sady [14] found values for total phenolic compounds in carrots ranging from 18.0 to 21.5 mg/100 g FW and total carotenoids ranging from 30.8 to 32.7 mg/100 g FW. Renna et al. [15] observed that antioxidant activity and total phenols were not significantly different in jams, when made by mild method, as compared to the raw carrots. The reported values for total phenols in carrot jams
GAE/100 g FW and for antioxid 3-45 mg TE/100 g FW.
B. Sensorial Evaluation
Fig. 3 shows the average classification obtained for each of the samples tested: the three jams made with the water from boiling the beans and the two control jams made with water.
Fig. 3 Results of the preference test: WJC - water jam with carrot, BJAC cinnamon, WJA–water jam with apple,
It was observed that the addition of the water used to boil the beans dis not considerable alter the panelists percept about the jam, either in case of the carrot or the apple, although the average scores were slightly higher for the corresponding water jams. The results further show that the carrot jam was the least valued, with scores of 2.08 and 2.24, respectively when using bean water or plain water, whereas the bean with apple and cinnamon was the most valued, with an average score of 4.24, in a scale from 1 to 5.
reported a very low value for protein content (0.2%) in The protein content for jams reported in the USDA Database is 0.37 g/100 g [10].
The amount of sugars was higher for those jams made with apple (63%) when compared to the jam made with carrot ned by the difference observed in the sugar content between carrots and apples, being apples much richer in sugars (10.10 g/100 g) than carrots (4.74 g/100 . The amount of total sugars in jams according to the USDA Database is 48.50 g/100 g [10].
The antioxidant activity varied from 7.31 to 11.52 mg TE/g, being higher for the BJC sample (Fig. 2). This antioxidant activity is explained by the phenolic compounds present as well as carotenoids in the case of carrot. Wang et al. [13] reported values for total phenolic compounds in apple flesh varying from 160 to 1060 mg Galic acid equivalent (GAE) per kg fresh weight (FW), and antioxidant activities measured by ABTS method in the range 3.6-22.4 µmolTE/g FW. Smoleń found values for total phenolic compounds in carrots ranging from 18.0 to 21.5 mg/100 g FW and total oids ranging from 30.8 to 32.7 mg/100 g FW. Renna et observed that antioxidant activity and total phenols e not significantly different in jams, when made by mild method, as compared to the raw carrots. The reported values in carrot jams were in the range 17-67 mg GAE/100 g FW and for antioxidant activity were in the range
Fig. 3 shows the average classification obtained for each of the samples tested: the three jams made with the water from boiling the beans and the two control jams made with water.
Results of the preference test: BJC – bean jam with carrot, water jam with carrot, BJAC–bean jam with apple and
water jam with apple, BJA–bean jam with apple the addition of the water used to boil the beans dis not considerable alter the panelists perception about the jam, either in case of the carrot or the apple, although the average scores were slightly higher for the corresponding water jams. The results further show that the carrot jam was the least valued, with scores of 2.08 and 2.24, hen using bean water or plain water, whereas the bean with apple and cinnamon was the most valued, with an average score of 4.24, in a scale from 1 to 5.
Fig. 4 presents the sensorial profiles of the three variations of the product tested: BJC – bean jam w
bean jam with apple and cinnamon, BJA apple.
Fig. 4 Sensorial profiles of the samples evaluated: with carrot, BJAC–bean jam with apple and cinnamon,
jam with apple
The results in Fig. 4 confirm that the bean jam with apple and cinnamon (sample BJAC) is the preferred, with higher scores in almost all attributes, except color (higher for the carrot jam) and consistency (higher in the apple jam). Also the jam with carrot was confirmed as less valued, with the lowest scores in most of the attributes evaluated.
The mean scores for sample BJC were 3.8, 2.6, 3.0, 2.7 and 2.6 for the attributes color, aroma, consistency, sweetness and taste, respectively. This sample was more valued with respect to color and less in terms of aroma and taste.
The mean scores for sample BJAC were 3.0, 3.5, 2.9, 3.5 and 3.7 for the attributes color, aroma, consistency, sweetness Fig. 4 presents the sensorial profiles of the three variations bean jam with carrot, BJAC– bean jam with apple and cinnamon, BJA– bean jam with
Sensorial profiles of the samples evaluated: BJC – bean jam bean jam with apple and cinnamon, BJA–bean
irm that the bean jam with apple and cinnamon (sample BJAC) is the preferred, with higher scores in almost all attributes, except color (higher for the carrot jam) and consistency (higher in the apple jam). Also the lued, with the lowest The mean scores for sample BJC were 3.8, 2.6, 3.0, 2.7 and 2.6 for the attributes color, aroma, consistency, sweetness and taste, respectively. This sample was more valued with respect
lor and less in terms of aroma and taste.
The mean scores for sample BJAC were 3.0, 3.5, 2.9, 3.5 and 3.7 for the attributes color, aroma, consistency, sweetness
and taste, respectively. The attributes more appreciated in this sample were aroma, sweetness
was consistency.
The mean scores for sample BJA were 3.0, 3.2, 3.3, 3.3 and 3.4 for the attributes color, aroma, consistency, sweetness and taste, respectively. This sample was more valued for taste, sweetness and consistency and less scored for color.
Comparing the three samples in regards to the overall assessment, the globally more appreciated sample was BJAC, with a score of 3.6, followed by sample BJA, with a score of 3.2, and finally sample BJC, with a score of 2.5.
results of both tests done in the sensorial analysis undoubtedly showed that the bean jam with apple and cinnamon was a much appreciated product.
C. Prospects for Commercialization
In order to understand in what way this newly developed product could be launched on the market
was undertaken. Most of the inquired, 55
45% who do not. As to the occasions for consuming jams, 41% eat them at breakfast, 11% in meals as deserts, 73% at tea and 7% in other occasions. The b
for most of the inquired, since 64% admitted buying white brands against 36% for whom the commercial brands are preferred.
Fig. 5 shows the importance of different factors that affect consumer choice in the moment of buying a
respondents consider price (65%) and variety (52%) the most important factors when buying a jam. On the other hand the package and brand appear as the least important, with only 6% and 13% of the respondents indicating these factors, respectively.
Fig. 5 Relevant characteristics for choosing a jam
When asked if they would be willing to try these new jams, 93% responded affirmatively. When asked specifically about the products developed, from those who would like to try the products, 67% chose the bean jam with apple and cinnamon (BJAC), 18% chose the bean jam with apple and 14% chose the bean jam with carrot. Interestingly, these results are in close agreement with those obtained in the sensorial analysis, even though the individuals in
did not actually taste any of the products.
Finally, 17% found this type of product generally very appealing, 60% considered it appealing, 18% little appealing and 5% not appealing.
and taste, respectively. The attributes more appreciated in this aroma, sweetness and taste, and the less valued The mean scores for sample BJA were 3.0, 3.2, 3.3, 3.3 and 3.4 for the attributes color, aroma, consistency, sweetness and This sample was more valued for taste,
y and less scored for color.
Comparing the three samples in regards to the overall assessment, the globally more appreciated sample was BJAC, with a score of 3.6, followed by sample BJA, with a score of 3.2, and finally sample BJC, with a score of 2.5. Hence, the results of both tests done in the sensorial analysis undoubtedly showed that the bean jam with apple and cinnamon was a
Prospects for Commercialization
In order to understand in what way this newly developed be launched on the market, a consumer survey Most of the inquired, 55% eat jams against 45% who do not. As to the occasions for consuming jams, 41% eat them at breakfast, 11% in meals as deserts, 73% at tea and 7% in other occasions. The brand was not a choice factor for most of the inquired, since 64% admitted buying white brands against 36% for whom the commercial brands are Fig. 5 shows the importance of different factors that affect consumer choice in the moment of buying a jam. Most of the respondents consider price (65%) and variety (52%) the most important factors when buying a jam. On the other hand the package and brand appear as the least important, with only 6% and 13% of the respondents indicating these factors,
Relevant characteristics for choosing a jam
When asked if they would be willing to try these new jams, 93% responded affirmatively. When asked specifically about the products developed, from those who would like to try the % chose the bean jam with apple and cinnamon 18% chose the bean jam with apple and 14% chose the bean jam with carrot. Interestingly, these results are in close agreement with those obtained in the sensorial analysis, even though the individuals inquired in the consumer study did not actually taste any of the products.
Finally, 17% found this type of product generally very appealing, 60% considered it appealing, 18% little appealing
IV. CONCLUSION
This work allowed concluding that the jams produced with the water from boiling beans are particularly rich in sugars, particularly the two variations with apple. As regards the fiber, bean jam with apple and cinnamon proved to be richer when compared to the other two samples. The fat content was similar on both samples made with apple and higher in the sample made with carrot. With respect to the antioxidant activity it was found to be in the ranges reported in literature for similar products.
The sensory analysis showed that the product which was preferred and also which registered generally higher scores, including with respect to overall assessment, was the bean jam with apple and cinnamon. Still, the color was better for the bean jam with carrot and the consistency for the bean jam with apple.
Regarding the market study it was concluded about the possible interest of the potential consumers in experiencing these innovative products, which most recognized as appealing. Among the three possibilities, the inquired chose the bean jam with apple and cinnamon as the product they would most be willing to try.
ACKNOWLEDGMENT
The authors thank CI&DETS Research Centre and Polytechnic Institute of Viseu for financial support.
REFERENCES
[1] G. Duarte Pimentel e J. C. Silva Zemdegs, «What is the importance of nutrition in rheumatoid arthritis?», Reumatología Clínica (English
Edition), vol. 6, n. 3, pp. 183–184, 2010.
[2] K. M. Tuohy, E. Liktrafiti, K. Manderson, G. R. Gibson, e R. A. Rastall, «16 - Improving gut health in the elderly», em Functional Foods, Ageing
and Degenerative Disease, C. Remacle e B. Reusens, Eds. Woodhead
Publishing, 2004, pp. 394–415.
[3] R. P. F. Guiné, Food, Diet and Health: Past, Present and Future
Tendencies. New York: Nova Science Publishers, 2010.
[4] L. Müller, S. Gnoyke, A. M. Popken, e V. Böhm, «Antioxidant capacity and related parameters of different fruit formulations», LWT - Food
Science and Technology, vol. 43, n. 6, pp. 992–999, Jul. 2010.
[5] L. Mondini, S. A. de Moraes, I. C. M. de Freitas, e S. G. A. Gimeno, «Fruit and vegetable intake by adults in Ribeirão Preto, Southeastern Brazil», Revista de Saúde Pública, vol. 44, n. 4, pp. 686–694, Ago. 2010.
[6] A. R. B. Figueiredo, Inovação no Setor Hortofutícola: Compota de
Feijão. Dissertação de Mestrado em Qualidade e Tecnologia Alimentar.
Viseu, Portugal: Escola Superior Agrária de Viseu, 2014.
[7] A. Allende, F. A. Tomás-Barberán, e M. I. Gil, «Minimal processing for healthy traditional foods», Trends in Food Science & Technology, vol. 17, n. 9, pp. 513–519, Set. 2006.
[8] R. P. F. Guiné, E. Costa, S. Santos, A. C. Correia, P. M. R. Correia, e L. Pato, «Food Product development: whey cheese with pumpkin jam»,
Academic Research International, vol. 2, n. 1, pp. 52–59, 2012.
[9] AOAC, Official methods of analysis, 17th ed. Washington: Association of Official Analytical Chemists, 2000.
[10] USDA, «National Nutrient Database for Standard Reference. Release 27».
[11] R. P. F. Guiné, R. Sousa, A. Alves, L. Teixeira, C. Figueiredo, S. Fonseca, S. Soares, I. Sousa, P. Almeida, A. C. Correia, A. Jordão, A. D. Lopes, e D. Ferreira, «Phenolic, dietetic fibre and sensorial analyses of apples from regional varieties produced in conventional and biological mode», Agricultural Engineering International: CIGR Journal, vol. 12, n. 2, pp. 70–78, Abr. 2010.
[12] R. Megías-Pérez, J. Gamboa-Santos, A. C. Soria, M. Villamiel, e A. Montilla, «Survey of quality indicators in commercial dehydrated fruits», Food Chemistry, vol. 150, pp. 41–48, Mai. 2014.
[13] X. Wang, C. Li, D. Liang, Y. Zou, P. Li, e F. Ma, «Phenolic compounds and antioxidant activity in red-fleshed apples», Journal of Functional
Foods.
[14] S. Smoleń e W. Sady, «The effect of various nitrogen fertilization and foliar nutrition regimes on the concentrations of sugars, carotenoids and phenolic compounds in carrot (Daucus carota L.)», Scientia
Horticulturae, vol. 120, n. 3, pp. 315–324, Mai. 2009.
[15] M. Renna, B. Pace, M. Cefola, P. Santamaria, F. Serio, e M. Gonnella, «Comparison of two jam making methods to preserve the quality of colored carrots», LWT - Food Science and Technology, vol. 53, n. 2, pp. 547–554, Out. 2013.