The development of the speciality fibre sector in Portugal
Pinto de Andrade, L, Várzea Rodrigues, J;. and Martins Abrantes, M. Escola Superior Agrária de Castelo Branco - Quinta da Sr.ª de Mércules 6000 Castelo Branco
Introduction
Fine fibre in Portugal is almost limited to wool and, for the moment, the country is still responsible for a reasonable amount of production of fine wool.
There are no cashmere goats registered in Portugal, and so no cashmere fibre is available, as is the case with Angora rabbits. Angora fibre used to be produced in Portugal, however due to disease problems, the rabbits died and the production of this kind fibre disappeared in the sixties. Currently, interest in farming Angora goats for mohair production is low. From the initial flocks set up in the late eighties (500 animals), there are now only 250 animals. Due to the small amount of fibre produced and to the rapid coarsening of the fibre with age, the national textile industries have never shown interest in developing technology for processing this particular type of fibre. Because of this, the producers need to send the small volumes of fibre produced to France or England for processing.
We think that in order to improve mohair production the resolution of industrial processing must be done at the production level in a modular way. It is also necessary that the official organisms have objective guidelines. Even if it is considered as a exotic breed, there are enough information that allows us to say that angora goats can be perfectly integrated in our traditional sheep management systems, and with fewer management problems that some of our indigenous goat breeds.
We think that from the three types of fibre-producing animals referred to, angora goat production is the best option in the short term, since it is the animal that is closest to our traditional system of animal production.
The Portuguese Textile Industry, since a long time ago, prepared to process the only animal fibre (wool) currently available in large quantities in the country. All the other speciality fibres are imported for incorporation into garments.
Wool seems still to have a role in Portuguese Agriculture, mainly fine wool, which is predicted to be in continuing and strong demand.
1- Historical Evolution of Portuguese wool production
In Portugal, in 1997 the sheep population was around 3,414 x 103 , responsible for the production of 8,768 tonnes of wool (Table 1).
Table 1- Historical evolution of sheep population, wool production and stored wool in Portugal (1987 - 1998). Years Animals(1) (x 103) Wool Production (2) (ton) Stored wool (3) (ton) 1987 3035 8700 1602 1988 3187 8800 1431 1989 3347 9100 1497 1990 3360 - 1935 1991 3380 - 1403 1992 3348 - 689 1993 3305 8850 1467 1994 3416 8658 788 1995 3428 8998 444 1996 3380 8636 556 1997 3414 8768 468 1998 3433(4) 8995 818 (1)- Anuário Pecuário (1998/99)
(2)- Anuário Estatístico de Portugal (1998) (3)- Martins Abrantes (non published) (4)- Provisional data
Within this animal population there is a relatively high number of breeds, aggregated in three different ethnic groups: Merino, Bordaleiro and Churro. In the ethnic group Merino there are three breeds: Merino Branco do Alentejo, Merino da Beira Baixa and Merino Preto do Alentejo. Available data show the existence of 1,300 x 103 animals from the two first breeds.
2- Wool collection
Portugal has established since 1940 a system for collecting (livestock cooperatives that also work as wool storage centres) and classifying wool (technicians from the Ministry of Agriculture), so that lots can be grouped for deals with industrial concerns.
In Portugal, the concentration of the wool is done by farmer associations in three different places -Beja, Évora and Castelo Branco. It is predicted that only 15 to 20% of the wool produced in these regions is delivered to the collection depots (Pinto de Andrade and Várzea Rodrigues, 1997). The wool depots for concentration/grading/storing are distributed within the regions related to the distribiution of the threemerino breeds - Merino Branco and Merino Preto do Alentejo (Beja and Évora) and Merino da Beira Baixa (Castelo Branco).
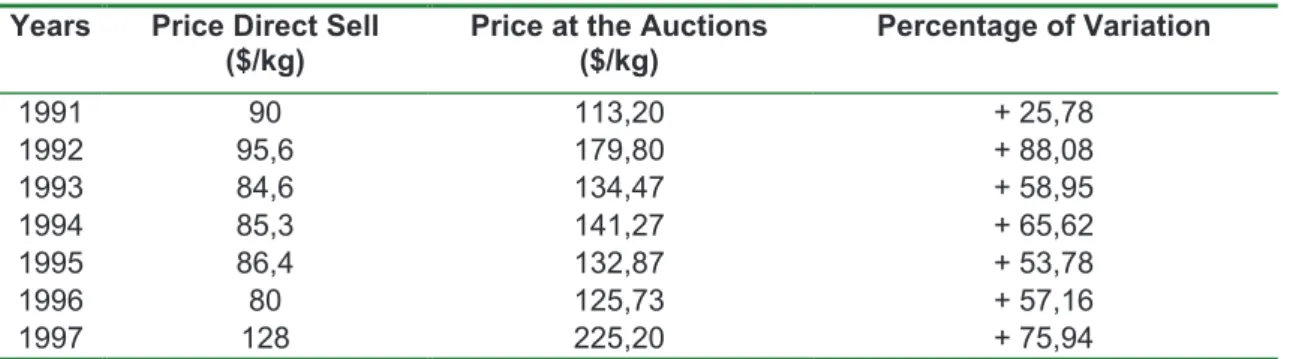
Table 2- Price of direct sell, at the auctions and percentage of variation. Years Price Direct Sell
($/kg)
Price at the Auctions ($/kg) Percentage of Variation 1991 90 113,20 + 25,78 1992 95,6 179,80 + 88,08 1993 84,6 134,47 + 58,95 1994 85,3 141,27 + 65,62 1995 86,4 132,87 + 53,78 1996 80 125,73 + 57,16 1997 128 225,20 + 75,94
Source: Ovinos e Caprinos (1998)
Most breeders are on their own when negotiating with traders since they do not want to deliver their wool production to the wool storage centres (authorised to certify the product´s origin and quality to buyers) and wait four to five months for the wool auctions with higher prices. These farmers receive an identical price irrespective of the quality of wool, with a lower price per kg. The higher value obtained in the auctions where the wool is graded is dependent on the variations in international markets. Wool merchants and textile processors import large lots of wool which have been rigorously graded and meet rigid specifications. The small companies process small quantities of raw wool are less reluctant to buy small batches of locally grown wool, which are of variable quality and often heavily contaminated with vegetable matter.
4- Quality of Portuguese wool
Wool produced in Portugal is quite heterogeneous and is dependent on the ethnic group. It is assumed that the Churra ethnic group has poor quality wool, with low crimp, a rough feel, and with a variable fibre length from 15 - 30 cm. Commonly, mean fibre diameter is in the range 30 - 57µm. The wool has specific uses in handicraft (blankets and carpets).
At the other end of the scale, the Merino breeds are considered to be high quality wool producers with high crimp, soft handle, and with variable fibre length between 6 and 8 centimetres. Mean fibre diameter is in the range 18 - 30µm.
This work aims to develop a credible plan for future development of fine wool production (< 22,5 µ) in Portugal. All the data refer to Merino wool production.
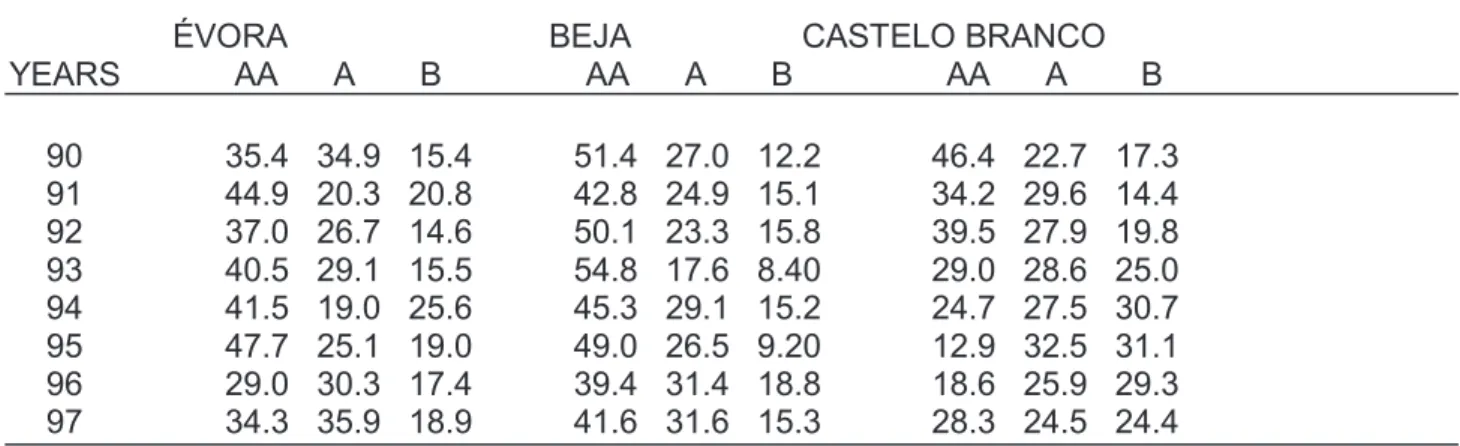
Table 3 shows the changes in the relative production volumes of different wool grades between 1990 and 1997. It can be seen that in the southern regions of the country (Évora e Beja) the percentage of AA wool (19- 22µ) shifted between 35 to 55%, 1996 except in the region of Évora. In Castelo Branco, the evolution in percentage of AA wool has been decreasing since 1990 (46.4%) reaching its minimum in 1995 (12.9%). This situation results from the crossbreeding between indigenous and exotic breeds (Frísian, Manchego, Awassi and Assaf) which have been introduced to increase milk production (Pinto de Andrade and Várzea Rodrigues, 1997; Pinto de Andrade et al., 1998).
Table 3- Changes in the relative production volumes of different wool grades between 1990 and 1997.
ÉVORA BEJA CASTELO BRANCO
YEARS AA A B AA A B AA A B 90 35.4 34.9 15.4 51.4 27.0 12.2 46.4 22.7 17.3 91 44.9 20.3 20.8 42.8 24.9 15.1 34.2 29.6 14.4 92 37.0 26.7 14.6 50.1 23.3 15.8 39.5 27.9 19.8 93 40.5 29.1 15.5 54.8 17.6 8.40 29.0 28.6 25.0 94 41.5 19.0 25.6 45.3 29.1 15.2 24.7 27.5 30.7 95 47.7 25.1 19.0 49.0 26.5 9.20 12.9 32.5 31.1 96 29.0 30.3 17.4 39.4 31.4 18.8 18.6 25.9 29.3 97 34.3 35.9 18.9 41.6 31.6 15.3 28.3 24.5 24.4 AA- [19- 23µ[; A – [23 - 25µ[ and B – [25 - 36µ[
Source: Chabert, personal communication, (1997)
Table 4 shows the consolidated data and illustrates the trend for a decrease in the proportion of AA wool produced (44.4% in 1990 vs. 29.0% in 1996), corresponding to an increase in the production of A wool [23 - 25µ]; B and D classes suffer slight changes. This trend ought to be reversed.
Table 4- Evolution of finesses (%) in the 90´s in Portugal
Years AA [19- 23µ[ A [23 - 25µ[ B [25 - 36µ[ D Defective 90 44.4 28.2 14.9 12.4 91 40.6 24.9 16.7 17.4 92 42.2 25.9 16.7 15.1 93 41.4 25.1 16.3 17.1 94 37.1 25.2 23.8 13.8 95 36.5 28.0 19.7 15.6 96 29.0 29.2 21.8 19.7 97 34.7 30.6 19.5 15.1
Source: Chabert, personal communication (1997).
If we look at the data from merino wool obtained at the wool depots in 1998 and 1999 (Table 5), it is possible to verify that wool from class AA [19 - 23µ] represents 31.5 and 31.2% of the 550,477 kg (1998) and 420,195 kg (1999) of the total merino wool classified.
Table 5- Merino wool quality and prediction of the total Merino wool production. Classified Merino Wool
(kg) Percentage related to classified Merino Wool Prediction of Merino Wool Production (kg) Years Classes 1998 1999 1998 1999 1998 1999 AA (19-23 µ) 173214 133068 31.47 31.22 973563 966019 AA Extra (19 - 22 µ) 23510 14137 4.27 3.32 132140 102629 AA Fine (21 -23 µ) 149 704 118 931 27.20 27.91 841 423 863 390 < 20 µ 9 373 6 475 1.70 1.52 52 682 47 006 20 - 22,5 µ 79 593 60 639 14.46 14.23 447359 440 214 22,5 - 25 µ 60 549 47 453 11.00 11.13 340 320 344 489 > 25 µ 23 699 18 501 4.31 4.34 133 202 134 310
Based on census data indicating 1,300,000 Merinos in Portugal, and 2.38 kg mean fleece weight, this corresponds to a total annual production of 3,094,000 kg Merino wool. This predicts that there are almost 1 000 tonnes of AA wool class produced annually, based on the tactile/visual assessment done by the technicians from the Ministry of Agriculture.
AA wool class is divided in two sub classes: AA Extra (19 - 22µm) and AA Fine (21 - 23µm). It is possible to see that within the AA class (31%) only 3-4 % are AA extra, the remaining 27-28% are AA fine. After random sampling fleeces of each subclass and determining the fibre diameter, we concluded that within the AA class, 1.5 to 1.7% of stored/graded Merino wool is found with a diameter of < 20µ and 14.2 to 14.5% of wool with [20 -22.5 µm].
The results obtained at the laboratory (OFDA), predict an annual availability in Portugal of 487 to 500 t of wool with the desired characteristics (<22.5 µ), and only 47 to 53 t with diameters less than 20µm. This means that only 19 000 to 22 000 animals from the total Merino population have such high quality wool. In the farms that deliver their wool for grading, there are only 2700 to 3900 animals with fine wool (< 20µ).
5- Economic contribution of the Wool sector in the Animal Production (AP)
The contribution of wool to total income from animal production at current prices decreased from 1994 to 1997 (0.26% in 1994 down to 0.21% in 1996 and 1997) (Table 6).
Table 6- Final product at Production at current prices and at constant prices from 1986 from the wool sub sector and from animal production sector in Portugal.
Final Product at Production at Current Prices (x 106 Euros) Final Product at Production at Constant Prices from
1986 (x 106 Euros) Differential Current prices -Constant prices (X 106Euros) Years Wool Total AP Product Wool Current prices related to Constant prices (%) Product Wool relate to the product AP (%) Wool Total AP Product Wool relate to the product of AP at constant prices (%) Wool AP 1994 5,6 2 185 75,4 0,26 7,5 1 869 0,40 -1,8 315,5 1995 4,9 2 006 63,7 0,25 7,7 1 778 0,44 -2,8 227,6 1996 4,7 2 245 63,8 0,21 7,4 1 820 0,41 -2,7 424,8 1997 4,8 2 304 63,7 0,21 7,5 1 864 0,40 -2,7 439,9 1998 5,0 2 061 65,0 0,25 7,8 1 822 0,43 -2,7 238,8
Note: AP- Animal Production a) Provisional Data
Table 6 shows that the wool has been suffering high devaluation: 1- Wool production is referred in national statistics as almost constant;
2- the differential between the final product at current prices and the final product at constant prices from 1986 is negative in all years considered.
In practical terms, we can see that the final product wool in the production, and at current prices is only 63,7 to 75,4% of the final product from the same sector at constant prices from 1986.
Final considerations
The sale of stored wool through auctions, based on lots containing parcels of fine wool and wool with less quality must be changed. At least part of the fine wool (< 22,5µ) should be sold in individual lots, and so properly valorised, with a consequent economic reward to the farmer. This policy has the advantage to stimulate producers to have a specific production goal. The disadvantage is the difficulty to commercialise the wool of less quality.
Is necessary to implement a systematic work in two ways:
- show to the producers the economic advantages of fine wool production;
Delaying the decisions related to the wool production is leading to a rapid decrease of available breeding animals. It is necessary that farmer's associations assume their responsibility as soon as possible.
The small number of animals that produce fine wool with less than 20µm, their distribution by a high number of farms, the introduction of other breeds in crossbreeding, the difficulties of the wool market, the losses of profit from this sub sector, and the absence of objective policies, could lead in a short time to the disappearance of this genetic basis, making irreversible the process of regression of the wool quality.
The social aspect is significant, since the sheep production sector involves thousands of people across Portugal. The standard of living of these people could be improved if wool was more efficiently used.
Crossbreeding to improve certain aspects of the animal's meat and milk is resulting in genetic deterioration. The results of hundreds years of painstaking selection have disappeared or are at risk. This genetic heritage, from which the wool stock of the Southern hemisphere producers originates, must be preserved from the point of view of preservation of genetic resources (Pinto de Andrade et al., 1997).
Biodiversity maintenance is an indisputable goal, however it must be supported by society and must have the unequivocal support and stimulation from the Government, from the central organisms and regional responsible in order that the production could pursue the same goals. Currently, we believe that there is a political will to improve the wool sector. Professional training has restarted with the support from the Ministry of Agriculture, and financial aid is a real possibility. We believe that the necessary conditions exist in order that the farmer's associations responsible for the herd books for the Merino breeds rethink the genetic selection programme of respective breeds and introduce the necessary criteria to improve wool quality without negative consequences for meat traits.
References
ANUÁRIOESTATÍSTICO DE PORTUGAL. 1998. Instituto Nacional de Estatística.
ANUÁRIOPECUÁRIO. 1998/99. Gabinete do Planeamento e Política Agro Alimentar. Ministério da Agricultura, do Desenvolvimento Rural e das Pescas.
PINTODEANDRADE, L., ALBERTO, D., VÁRZEARODRIGUES, J., CHABERT, J. 1997. “ Typical Livestock Products
and Rural Development- The study case of Fine Wool”. 2th European Workshop of the LSIRD network.-“Improving market integration and value-adding in domestic livestock enterprises in disadvantaged regions- the implications for future research:” University of Kassel, Witzenhausen, Alemanha. 27-29th September.
PINTODEANDRADE, L., VÁRZEARODRIGUES, J. 1997. “Fine Wool in Portugal”. 1st European Workshop of the EFFN network. - “Development of European Standards for the objective measurement of genetic selection parameters, based on quantity and quality fibre traits.” EFFN News. 2: 5-7. Villaviciosa, Espanha. 10-11 October.
PINTODEANDRADE, L., VÁRZEARODRIGUES, J. ANDSERRANO, J. 1998. “The Quality of Fine Wool in Portugal -Preliminary Results". 3rd European Workshop of the EFFN network. - “Quality Assessment and the Requirements of the Fibre manufacturing Industry.” EFFN News. 4: 2-5. 4-5 September. Kelmis. Belgium. OVINOS E CAPRINOS. 1998. " O Estado da Campanha Lanar de 1998". 3: 9-11. Federação das Associações