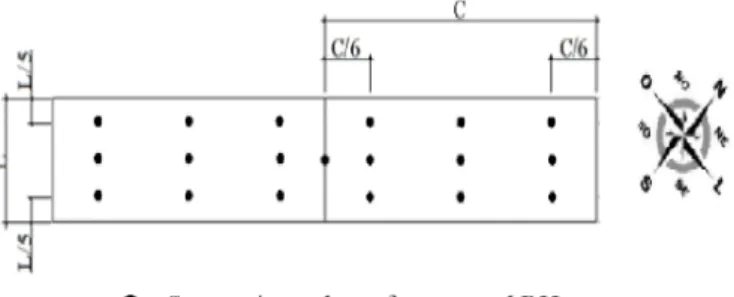
Spatial variability of enthalpy in broiler house during the heating phase
Texto
Imagem
Documentos relacionados
The father is cooperative, in Grice's terms, because he does not leave any question unanswered. Readers might w onder w hether Nick's father breaks Grice's maxim
Assim, o programa de exercício físico para pessoas com hipertensão arterial do Núcleo Interdisciplinar de Estudos e Extensão em Cuidados à Saúde da Família em
Gráfico representando em percentagens os teores de hidrocarbonetos saturados (SAT), aromáticos (ARO) e compostos NSO nas amostras coletadas das unidades de
O segundo foi a noção de cidadão moderno, que “ao criar a figura do cidadão pleno, a constituição revolucionária criou, por oposição, seu contrário: o não cidadão, o que
Já então se conhece a atitude escandalosa de Hoppner de entregar correspondência entre Santarém e Córdova a Palmerston, com anotações à margem das páginas que
Within the context of landscape ecology, the objective of this work was to quantify and analyze changes in the spatial structure of the landscape during the periods of 1979 and
The objective of this study was to model, analyze and compare the structure of spatial dependence, as well as the spatial variability of the water depths applied by a
