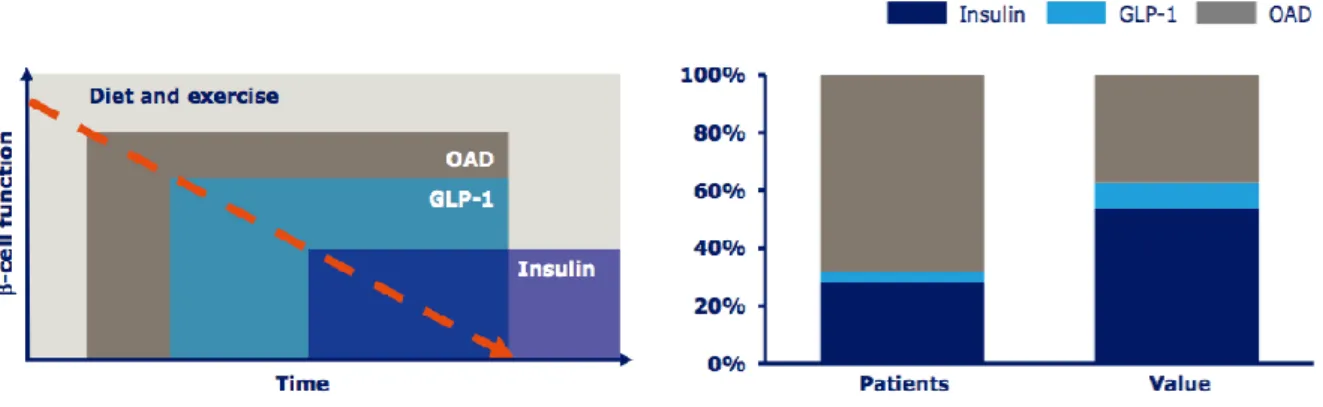
A study of value transitions in the basal insulin regimen for treatment of type 2 diabetes
86
0
0
Texto
Imagem
+7


Documentos relacionados