Sara Maria Ventura Ramalhete
Epigenetic biomarkers as predictors of clinical
outcomes in colorectal cancer
UNIVERSIDADE DO ALGARVE
Departamento de Ciências Biomédicas e Medicina
2019
i
Sara Maria Ventura Ramalhete
Epigenetic biomarkers as predictors of clinical
outcomes in colorectal cancer
Mestrado em Oncobiologia: Mecanismos Moleculares do Cancro
Trabalho efetuado sob a orientação de:
Professor Doutor Pedro Castelo-Branco
UNIVERSIDADE DO ALGARVE
Departamento de Ciências Biomédicas e Medicina
2019
iii
Epigenetic biomarkers as predictors of clinical outcomes in
colorectal cancer
Declaração de autoria do trabalho
Declaro ser a autora deste trabalho, que é original e inédito. Autores e trabalhos consultados estão devidamente citados no texto e constam da listagem de referências incluída.
I declare that I am the author of this work that is original and unpublished. Authors and works consulted are properly cited in the text and included in the list of references.”
___________________________________ (Sara Maria Ventura Ramalhete)
iv Copyright © 2019 Sara Maria Ventura Ramalhete
A Universidade do Algarve reserva para si o direito, em conformidade com o disposto no Código do Direito de Autor e dos Direitos Conexos, de arquivar, reproduzir e publicar a obra, independentemente do meio utilizado, bem como de a divulgar através de repositórios científicos e de admitir a sua cópia e distribuição para fins meramente educacionais ou de investigação e não comerciais, conquanto seja dado o devido crédito ao autor e editor respetivos.
v “If you want to make the world a better place, Take a look at yourself and make a change.” Michael Jackson
vii
Agradecimentos
Em primeiro lugar, agradeço ao meu orientador, Professor Doutor Pedro Castelo-Branco, por me ter aceite no seu grupo, ter confiado em mim, e por todo o apoio que me deu ao longo da realização desta dissertação.
Agradeço à Professora Doutora Ana Marreiros por toda motivação, disponibilidade e ajuda em tudo o que precisei para a realização deste projeto.
Aos meus colegas André Mestre e André Fonseca, um muito obrigada por todo o apoio, motivação e amizade que demonstraram ao longo deste último ano.
Quero também agradecer a todos os restantes membros desta equipa por me terem apoiado e acolhido, e por todas as discussões científicas que proporcionaram ao longo da realização deste projeto.
Um agradecimento especial ao Luís Carlos por todo o apoio e motivação para que pudesse chegar até aqui.
Por último, mas não menos importante, agradeço à minha família por todo o carinho, confiança e por me terem ajudado a chegar aqui.
ix
Abstract
Colorectal Cancer is the third most common cancer and the second leading cause of death by cancer worldwide with about 1.3 million new cancer cases and 693,933 deaths reported in 2012.
Here, we intend to determine an epigenetic roadmap of Colorectal Cancer to predict tumor progression and patient outcome.
We analyzed whole-genome DNA methylation (Illumina Infinium HumanMethylation 450K array) and gene expression (Illumina HiSeq) in multiple stages of CRC (21 normal, 54 stage I, 131 stage II, 111 stage III, and 51 stage IV). The data is available in TCGA database, and was downloaded, processed and analyzed through R programming.
Results show that, in stages I, II, III, and IV, 307, 400, 305 and 233 genes are differentially expressed (fold-change absolute value > 1.5, p-value adjusted<0.05) and 924, 1814, 1169, and 618 CpG sites are differentially methylated (Δβ absolute value > 0.2, p-value adjusted<0.05), respectively. In addition, all these CpG sites are correlated with the respective gene. When the KEGG and Gene Ontology analysis was performed, we found that the enriched functions are related to nervous system, one of the processes deregulated in cancer progression. Moreover, we also identified 66, 85, 41, and 40 specific genes for stages I, II, III, and IV, respectively.
Regarding the diagnosis, were found 238 genes and 835 CpG sites as good diagnosis tool for stage I (AUC>0.8). Furthermore, 6, 1, and 5 genes and 87, 7, and 3 CpG sites were classified as good biomarkers for overall survival for stages I-IV, respectively. In addition, 3, 3, and 2 genes and 30, 12, 9 CpG sites were identified as good biomarkers for recurrence free survival for stages I-IV, respectively.
These results suggest that different methylation events are associated to specific stages of CRC which can predict patient outcome and might improve colorectal cancer diagnosis and prognosis.
Keywords: Colorectal Cancer, Epigenetics, DNA methylation, Biomarkers, Diagnosis,
xi
Resumo
Introdução: O cancro colorretal é um evento biológico que compreende múltiplos
passos, decorrendo de diversas alterações genéticas e epigenéticas.
Apesar das melhorias no rastreio, diagnóstico e prognóstico de cancro, incluindo de cancro colorretal, este continua a ser o terceiro tipo de cancro mais comum em homens e segundo em mulheres, com mais de 1,3 milhões de novos casos diagnosticados, e 693.933 mortes reportados em todo o mundo no ano de 2012. Em parte, a incidência e mortalidade continuam elevadas devido à baixa sensibilidade e especificidade na deteção de cancro colorretal nos estádios iniciais da doença.
Atualmente, entre os diversos meios de diagnóstico, a técnica mais eficiente é a colonoscopia, contudo apresenta baixa especificidade e sensibilidade. Estudos mais recentes têm apontado outros biomarcadores como forma de diagnóstico e prognóstico para o cancro colorretal, incluindo a septina 9. Este último é um biomarcador epigenético atualmente comercializado.
Este projeto teve como objetivos realizar uma análise global do genoma em termos de metilação do ADN e expressão genética através de um código em R, identificar mutações epigenéticas que ocorram ao longo da progressão do cancro colorretal, e, por último, relacionar estas alterações com o efeito causado nos doentes.
Métodos: Neste projeto, foi efetuada uma análise global do genoma de um cohort de
cancro colorretal, em termos de metilação do ADN (Illumina Infinium HumanMethylation 450K array) e expressão genética (Illumina HiSeq). Neste projeto, foram analisadas 21 amostras de tecido normal adjacente ao tumor e 347 amostras tumorais divididas de acordo com a classificação TNM (54 estadio I, 131 estadio II, 111 estadio III e 51 estadio IV). Estes dados estão publicamente disponíveis, sendo que foram descarregados da base de dados do The Cancer Genome Atlas (TCGA) e analisados através de programação em R.
Resultados: Os resultados sugerem que nos estádios I, II, III e IV, estão diferencialmente
expressos 307, 400, 305 e 233 genes (valor absoluto de fold-change > 1,5 e p-value ajustado (FDR) < 0.05) e diferencialmente metilados 924, 1.814, 1.169 e 618 locais de metilação (valor absoluto de Δβ > 0,2 e p-value ajustado (FDR) < 0.05), respetivamente.
xii Em adição, cada um destes locais de metilação encontra-se correlacionado com os respetivos genes encontrados diferencialmente expressos no mesmo estadio (p-value < 0.05). De seguida, efetuou-se uma análise nas bases de dados KEGG e Gene Ontology (GO). A utilização destas ferramentas revelou que as funções mais enriquecidas estão relacionadas com o sistema nervoso. Estudos anteriores já tinham descrito alterações em genes envolvidos no desenvolvimento e regulação do sistema nervoso como desreguladas em diversos tipos de cancro. Em adição, foi ainda realizada uma análise com o objetivo de encontrar quais dos genes encontrados diferencialmente expressos e que continham locais de metilação diferencialmente metilados ainda não tinham sido reportados em associação com cancro colorretal e cancro em geral. Esta análise sugere que 87 genes nunca foram associados nem com cancro colorretal nem com cancro no geral. Em oposição, 511 já forma reportados em algum tipo de cancro. Destes últimos, 278 já foram também reportados em cancro colorretal enquanto 233 nunca foram descritos neste tipo de cancro.
Como forma de validação, realizou-se, ainda, uma técnica multivariada de representação gráfica, a qual demonstrou que tanto os genes como os locais de metilação selecionados conseguem distinguir amostras tumorais de amostras normais. Esta técnica permitiu-nos ainda diferenciar amostras tumorais em dois grupos principais distintos.
Ainda neste estudo, foram identificados 66, 85, 41 e 40 genes que estão somente diferencialmente expressos nos estádios I, II, III e IV. Curiosamente, apenas 85 genes são comuns aos 4 estadios de desenvolvimento de cancro colorretal
O potencial dos genes e locais de metilação, encontrados como diferencialmente expressos e metilados, respetivamente, para distinguir tecido tumoral do tecido normal também foi avaliado através da análise de curvas de receiver operating characteristic (ROC). Como resultado, obteve-se que 238 genes e 835 locais de metilação são bons marcadores de tecido tumoral em estadio I, quando comparado com tecido normal adjacente (AUC > 0,8, sendo que apenas foram selecionados os pontos ótimos com especificidade e sensibilidade > 60%). ASTN1, por exemplo, foi um dos genes classificados como um excelente marcador de diagnóstico (AUC =0,989). Este gene contém ainda o local de metilação cg08104310, o qual foi considerado um excelente marcador de diagnóstico (AUC=1,000).
xiii De seguida, a capacidade de prever o outcome do paciente em termos de sobrevida em geral e sobrevida livre de progressão, através dos valores de metilação e expressão dos genes e locais de metilação específicos para cada um dos estádios, foi avaliada. Em relação à sobrevivência em geral, para os estádios II, III e IV, foram identificados 6, 1 e 5 genes e 87, 7 e 3 locais de metilação, respetivamente, como possíveis biomarcadores de prognóstico (p-value < 0.05). Especificamente, genes como o ZNF536 (p-value=0,018; HR=3,133), SOX1 (p-value=0,041; HR=0.459) e BFSP2 (p-value=0,027; HR=2.828), por exemplo, foram identificados como bons preditores de sobrevivência em geral dos estádios II, III e IV, respetivamente. Relativamente aos locais de metilação, as cg02430935 localizada no gene HMX (p-value=0,013; HR=3,139), cg26489108 localizada no gene DMRT3 (p-value=0,027; HR=0,407) e a cg01847754 localizada no gene CXorf1 (p-value=0,019; HR=3,155), por exemplo, foram identificadas como bons marcadores para a sobrevivência em geral dos estádios II, III e IV, respetivamente. Quanto à sobrevivência livre de recorrência, para os estádios II, III e IV, foram identificados 3, 3 e 2 genes e 30, 12 e 9 locais de metilação, respetivamente, capazes de prever se o doente para recorrer ou não. Mais concretamente, genes como o CNTD2 value=0,00033; HR=0,196), SOX1 value=0.01; HR=0,359) e HTR2C (p-value=0,0064; HR=0,285) foram identificados como bons preditores de prognóstico para a sobrevivência livre de progressão nos estádios II, III e IV, respetivamente. Relativamente aos locais de metilação, as cg06162589 localizada no gene SLC5A8 (p-value=0.0066; HR=0,2924), cg03700449 localizada no gene ASCL1 (p-value=0.0055; HR=0,3114) e cg14772660 localizada no gene SLC5A7 (p-value=0.0047; HR=4,3174) são exemplos de bons preditores de sobrevivência livre de progressão para os estádios II, III e IV, respetivamente.
Conclusão: Este estudo sugere que as alterações epigenéticas são dinâmicas ao longo da
progressão de cancro colorretal, demonstrando que há alterações que são características de estádios específicos, enquanto outras se mantêm alteradas desde o primeiro estadio. Notavelmente, algumas das alterações conseguem distinguir doentes com um prognóstico mais severo de doentes com um prognóstico mais indolente.
xiv Assim sendo, este estudo mostrou que existem possíveis biomarcadores para cancro colorretal que devem ser melhor estudados no futuro. Este estudo pode ainda demarcar o início da melhoria das técnicas de diagnóstico e prognóstico.
Palavras-chave: Cancro Colorretal, Epigenética, Metilação do ADN, Biomarcadores,
xv
INDEX OF CONTENTS
Agradecimentos ... vii
Abstract ... ix
Resumo ... xi
INDEX OF FIGURES ... xvii
INDEX OF TABLES ... xviii
ABBREVIATIONS LIST ... xix
1. CHAPTER I- INTRODUCTION ... 1
1.1. Cancer ... 1
1.1.1. Epidemiology of Cancer ... 2
1.1.2. Mutation in Tumorigenesis ... 2
1.1.3. Hallmarks of Cancer ... 3
1.2. Main Pathways Altered in Cancer ... 7
1.2.1. TGFβ Pathway... 7 1.2.2. Myc Pathway ... 8 1.2.3. PI3K Pathway ... 9 1.2.4. RTK/RAS Pathway ... 10 1.2.5. NRF2 Pathway ... 11 1.2.6. Wnt Pathway ... 12 1.2.7. p53 Pathway ... 13 1.2.8. Notch Pathway ... 14 1.3. Colorectal Cancer ... 15 1.3.1. Epidemiology of CRC ... 15 1.3.2. Disease subtypes ... 17
1.3.3. Colorectal Cancer Model ... 17
1.3.4. Staging Systems ... 19
1.3.5. Screening, Diagnosis and Prognosis ... 20
1.4. Epigenetics ... 21
1.4.1. microRNAs... 22
1.4.2. Histone Modifications ... 24
1.4.3. DNA Methylation ... 26
1.4.4. Epigenetic Alterations and Colorectal Cancer ... 28
1.4.5. Epigenetic biomarkers as predictors of clinical outcome ... 29
1.5. Databases Analysis and Statistic Methodologies ... 29
xvi
3. CHAPTER III- MATERIALS AND METHODS ... 33
3.1. Data Collection ... 33
3.1.1. The Cancer Genome Atlas ... 33
3.2. Patient Selection ... 34
3.3. Study Pipeline ... 36
3.4. Statistical Testing ... 38
3.4.1. Handling Outliers ... 39
3.4.2. Shapiro-Wilk Normality Test ... 39
3.4.3. Paired and Unpaired Two-Sample Tests ... 40
3.4.4. Levene Test ... 41
3.4.5. Correction for Multiple Testing ... 42
3.4.6. Pearson Correlation ... 42
3.4.7. Receiver operating characteristic (ROC) curve analysis ... 43
3.4.8. Overall Survival and Recurrence Free Survival Analysis ... 44
3.4.9. HJ-Biplot and Hierarchical Clusters ... 44
3.5. Citation Tool ... 45
3.6. Enrichment Analysis ... 46
4. CHAPTER IV- RESULTS ... 47
4.1. Clinical Features ... 47
4.2. Epigenetic Roadmap in Colorectal Cancer ... 48
4.3. Nervous System Related Functions are Enriched in CRC ... 53
4.4. Identification of potential New Biomarkers for CRC ... 55
4.5. Identification of genes epigenetically regulated which characterize CRC progression 56 4.6. Potential New Biomarkers for Colorectal Cancer Diagnosis ... 60
4.7. Identification of Epigenetic Biomarkers which predict patient outcome ... 62
4.8. CRC patients can be grouped according to their gene expression and DNA methylation patterns ... 69
5. CHAPTER V- DISCUSSION ... 74
5.1. Limitations ... 82
6. CHAPTER VI- CONCLUSION ... 83
xvii
INDEX OF FIGURES
Figure 1.1 Hallmarks of cancer new capabilities of tumor cells acquired during tumorigenesis . 7
Figure 1.2 Schematic figure representing TGFβ signaling ... 8
Figure 1.3 Schematic figure representing the Myc pathway ... 9
Figure 1.4 Schematic figure representing PI3K pathway. ... 10
Figure 1.5 Schematic figure representing Ras activation ... 11
Figure 1.6 Schematic figure representing NRF2 pathway ... 12
Figure 1.7 Schematic figure representing Wnt pathway ... 13
Figure 1.8 Schematic figure representing p53 pathway ... 14
Figure 1.9 Schematic figure representing Notch pathway ... 15
Figure 1.10 Cancer incidence and mortality in Portugal, 2012 ... 16
Figure 1.11 A heterogenous tumor. ... 18
Figure 1.12 Adenoma–carcinoma sequence model ... 19
Figure 1.13 Schematic representation of epigenetic modifications ... 22
Figure 1.14 miRNA processing ... 24
Figure 1.15 Nucleosome assembly and post-translational modification of histone tails ... 25
Figure 1.16 Hypermethylation can lead to gene inactivation ... 27
Figure 1.17 Promoter hypermethylation can be associated with gene activation... 28
Figure 1.18 The amount of data available contributes to the biology research ... 31
Figure 3.1 TCGA by numbers. ... 33
Figure 3.2 Sample selection using R programming ... 35
Figure 3.3 The approach to remove duplicated cases ... 36
Figure 3.4 Study Pipeline ... 37
Figure 3.5 Function to remove outliers ... 39
Figure 3.6 Adapted functions to compare two-samples ... 41
Figure 3.7 Adapted function to perform the Levene test. ... 41
Figure 3.8 Functions to obtain the number of citations in PubMed for each gene ... 46
Figure 4.1 Study pipeline indicating CpG sites and genes selected for each stage ... 49
Figure 4.2 Characterization of CpG sites differentially methylated throughout CRC development ... 51
Figure 4.3 Localization of CpG sites differentially methylated in the gene ... 52
Figure 4.4 Enriched pathways across colorectal cancer development ... 54
Figure 4.5 Enriched biological process: gene ontology (GO). ... 55
Figure 4.6 Potential new epigenetic biomarkers for colorectal cancer ... 56
Figure 4.7 Genes epigenetically regulated across colorectal cancer development ... 57
Figure 4.8 Epigenetic dynamic in CRC ... 58
Figure 4.9 CpG sites differentially methylated across colorectal cancer development. ... 60
Figure 4.10 ASTN1 gene has the potential to distinguish stage I colorectal tumor tissue from normal tissue ... 62
Figure 4.11 Epigenetically altered genes can predict patient outcome ... 64
Figure 4.12 CpG sites predict patient outcome ... 65
Figure 4.13 Recurrence Free Survival prediction through gene expression levels ... 67
Figure 4.14 CpG sites can predict recurrence ... 69
Figure 4.15 HJ-biplot representation of gene expression for (A) stage I, (B) stage II, (C) stage III, and (D) stage IV of CRC ... 71
Figure 4.16 HJ biplot representation of DNA methylation for (A) stage I, (B) stage II, (C) stage III, and (D) stage IV ... 73
xviii
INDEX OF TABLES
Table 1.1 Colorectal Cancer staging according to the most recent AJCC system effective on
January 2018 ... 20
Table 3.1 Correlation coefficient interpretation.. ... 42
Table 3.2 Classification of the diagnostic accuracy. ... 43
Table 4.1 Descriptive statistics about patients, as well as the distribution of patients by stage. 48 Table 4.2 The top 15 most differentially expressed genes for each stage of disease ... 53
Table 4.3 Top 10 specific CpG sites most differentially methylated in each stage. ... 59
Table 4.4 Genes that better predict the outcome (overall survival) ... 63
xix
ABBREVIATIONS LIST
3’ UTR- Three Prime Untranslated Region 5’ UTR- Five Prime Untranslated Region ALS- Amyotrophic Lateral Sclerosis APC- Adenomatous Polyposis Coli ATP- Adenosine Triphosphate AUC- Area Under the Curve BAX- BCL2 Associated X BRAF- B-Raf Proto-Oncogene CA- Cancer Antigen
CDC4- Cell Division Cycle 4 CEA- CarcinoEmbryonic Antigen
CIMP- CpG Island Methylator Phenotype CIN- Chromosome Instability
CpG- Cytosine phosphate Guanine CRC- Colorectal cancer
DNA- Deoxyribonucleic acid DNMT- DNA methyltransferase EGFR- EGF receptor
FDR- False Discovery Rate FIT- Fecal Immunochemical Test FOBT- Fecal Occult Blood Testing FPF- False positive fraction
xx
GO- Gene Ontology
H3K27ac- Acetylation of histone 3 at lysine 27 H3K27me3- Tri methylation of histone 3 at lysine 27 H3K36me3- Tri methylation of histone 3 at lysine 36 H3K4me1- Mono methylation of histone 3 at lysine 4 H3K4me3- Tri methylation of histone 3 at lysine 4 H3K9me3- Tri methylation of histone 3 at lysine 9 HAT- Histone acetyltransferases
HDAC- Histone deacetylases HDM- Histone demethylases HMT- Histone methyltransferases HR- Hazard ratio
ID4- Inhibitor of DNA Binding 4
IGF2R- Insulin-like Growth Factor 2 Receptor Indel- Insertion and Deletion
IRF8- Interferon Regulatory Factor 8 ITGA4- Integrin Subunit Alpha 4 KM- Kaplan-Meier
Last1- Large Tumor Suppressor 1 Last2- Large Tumor Suppressor 2 MBD- Methyl-CpG-binding domain
MGMT- O-6-Methylguanine-DNA Methyltransferase MiRNA- MicroRNA
xxi
MLH1- MutL Homolog 1 mRNA- Messenger RNA MSH3- MutS Homolog 3 MSH6- MutS Homolog 6 MSI- Microsatellite instability
Mst1- Mammalian STE20-like Protein Kinase 1 Mst2- Mammalian STE20-like Protein Kinase 2 NCI- National Cancer Institute
NHGRI- National Human Genome Research Institute NIH- National Institute of Health
PCA- Principal Component Analysis
PIP2- phosphatidylinositol (4,5)-bisphosphate
PIP3- phosphatidylinositol (3,4,5)-triphosphate
Pol II- Polymerase II
Pre-miRNA- Precursor miRNA Pri-miRNA- Primary microRNA
PTEN- Phosphatase and Tensin Homolog Rb- Retinoblastoma
RISC- RNA-induced silencing complex RNA- Ribonucleic acid
RNase- Ribonuclease
ROC - Receiver operating characteristic RTKs- Receptor tyrosine kinases
xxii
SDC2- Syndecan 2 SEPT9- Septin 9
SFRP2- Secreted Frizzled Related Protein 2 SLC5A8- Solute Carrier Family 5 Member 8
TAZ- Transcriptional Co-Activator with PDZ-Binding Motif TCGA- The Cancer Genome Atlas
TEAD- Transcriptional Enhanced Associate Domain TEAP2E- Transcription factor AP-2 epsilon
TGFBR2- TGFβ receptor 2 THBD- Thrombomodulin
TIMP3- TIMP Metallopeptidase Inhibitor 3 TP53- Tumor Protein 53
TPF- True positive fraction TSP-1- Thrombospondin-1 TSS- Transcription Start Site
VEGF-A- Vascular Endothelial Growth Factor-A VIM- Vimentin
1
1. CHAPTER I- INTRODUCTION
1.1. Cancer
Historically, the humoral theory, proposed by Hippocrates, was the first trying to explain what cancer is. He believed that humans contained 4 body fluids, named humor fluids: blood, phlegm, yellow bile, and black bile, which could be the cause of cancer. Specifically, Hippocrates proposed that alterations on these substances including an abnormal increase of black bile led cancer to arise1.
It was only in 1838 that it was demonstrated that cancer is formed by cells which are derived from other cells- the blastema theory23. After, other theories arose, including the chronic irritation theory, which suggested that cancer was caused by chronic irritation; the trauma theory, which asserted that trauma led to cancer, and the parasite theory, which characterized cancer as a contagious disease that could be transmitted among humans through parasites2,4,5.
Despite multiple attempts to understand the cause of cancer, it was in the 20th century that the mystery started to be solved. Firstly, both Watson and Crick uncovered the structure of deoxyribonucleic acid (DNA). Then, it was revealed how genes work and that genes can be affected by mutations. Later, it was also discovered that DNA can be altered and cause cancer through the exposure to chemicals, radiation, viruses and other carcinogens. It was also in the same century, that oncogenes and tumor suppressor genes were identified2.
Nowadays, it is known that cancer is a group of diseases characterized by uncontrolled cell division that ultimately can spread to other tissues and metastasize. Although proliferation and cellular growth being normal and essential processes for development of organisms, cell division can become out of control, resulting in the accumulation of both mutations and epimutations6. This condition may lead to an uncontrolled cellular
2
1.1.1. Epidemiology of Cancer
Despite the significant improvement in treatment and screening and the search for tumor biomarkers, cancer is the second leading cause of death in the world with more than 14 million new cancer cases reported and 8.2 million deaths worldwide in 2012. In 2018 it was estimated about 18.1 million new cases and 9.6 million cancer-related deaths. Additionally, assenting in statistical predictions, it is expected that over 23 million new cancer cases are diagnosed and 14 million deaths by cancer are reported in 2035.
Among all cancer types, the most frequents are lung, breast, colorectal and prostate cancers8–10.
1.1.2. Mutation in Tumorigenesis
Mutations and epimutations might have an impact in gene expression by modifying DNA sequence or chromatin structure, respectively11. Those changes can occur under many
circumstances such as exposure to tobacco, chemicals, radiation or infectious organisms- external factors- and inherited mutations, hormones, immune conditions and random mutations- internal factors6. Additionally, other events can also arise during cancer development, such as genomic rearrangements, amplification, insertion and deletion (indel)12,13.
Importantly, neither the total number of mutations nor epimutations are directly related to the outcome. These events can be assembled in two main groups: driver and passenger mutations. Driver mutations provide selective advantage to tumor cell growth, contributing to the tumor initiation and progression. In contrast, passenger mutations do not provide selective growth advantage, meaning that they do not contribute to tumor initiation and progression. Driver mutations happen in small scale in cancer, whereas passenger mutations are the most common alterations found in cancer cells. Additionally, there is another type of mutations, named gatekeeping mutations, which provide advantages to the growth of normal cells13–17.
Among all cellular processes, cell fate determination, cell survival, and genome maintenance are the three main processes related to cancer driver genes13. These processes are regulated by several oncogenes and tumor suppressor genes, which are often activated or inactivated, respectively, across the tumor development16.
3
1.1.3. Hallmarks of Cancer
Hanahan and Weinberg have originally proposed six hallmarks that normal cells acquire during the malignant transformation, which promote tumor growth and progression, revolutionizing the knowledge of tumorigenesis (Figure 1.1)18,19:
a. Sustaining proliferative signaling.
Cancer cells can affect the production and release of growth-promoting signals, such as growth factors that bind to cell-surface receptors. This control affects the cell cycle and cell growth, leading to an uncontrolled proliferation. Specifically, there are different known ways to take control of proliferation such as an autocrine proliferative stimulation, meaning that cancer cells produce growth factors themselves; or stimulating normal cells to produce growth factors. Moreover, mechanisms as somatic mutations that activate additional downstream pathways, or the disruption of negative feedback mechanisms that inhibits proliferative signaling are also commonly observed18–21.
b. Evading growth suppressors.
Besides cancer cells constitutively activate proliferative signals, they inhibit growth suppressors (tumor suppressor genes). Among all known tumor suppressor genes, the most studied are Retinoblastoma (Rb) and Tumor Protein 53 (TP53). Both are involved in the control of cell cycle, being responsible to decide if the cell proliferates or enters in senesce or apoptosis. Moreover, the cell-cell contact is also lost in several types of cancer, in order to maintain the uncontrolled cell growth18,19,22,23. Indeed, this fact contributes to cancer development and metastization as well24.
c. Resisting cell death.
Cancer cells avoid apoptosis, a programed mechanism of cellular death. Indeed, there are regulators that receive and process the extracellular death-inducing signals, as well as regulators that sense and integrate signals of intracellular origin. As a consequence of the activation of any of these regulators, the apoptotic effectors are also activated and the cell suffers apoptosis, being digested by both its neighbors and phagocytic cells25. In cancer,
4 this mechanism is abnormally altered, leading to the proliferation of damaged cells. For example, cancer cells lose the tumor suppressor gene TP53, which is responsible for inducing apoptosis. Other strategies, such as to increased expression (upregulation) of antiapoptotic regulators and survival signals, or to downregulate proapoptotic factors are also commonly observed in several types of cancer as a way to avoid apoptosis18,19,26,27.
d. Enabling replicative immortality.
Although normal cells have a limited number of cell divisions, cancer cells acquire the capability of dividing indefinitely. Specifically, cancer cells evade both senescence and crisis/apoptosis, being able to proliferate indeterminately. There are evidences that this feature is, in part, due to the activation of telomerase, a DNA polymerase that is responsible by the maintenance of the repetitive sequences located at the ends of chromosomes, named telomeres, which ultimately leads to cell immortalization. Remarkably, studies demonstrated that most non-immortalized cells do not express the gene that encodes for telomerase whereas about 90% of spontaneous immortalized cells do. Moreover, there are evidences that this alteration is correlated to resistance to senescence and crisis/apoptosis, and is associated to poor prognosis18,19,28,29.
e. Inducing angiogenesis.
During malignant transformation, cancer cells are able to induce angiogenesis with the purpose of obtaining nutrients and oxygen as well as remove metabolic wastes and carbon dioxide. This process is mediated by vascular endothelial growth factor-A (VEGF-A), a promotor of angiogenesis, and thrombospondin-1 (TSP-1), an inhibitor of angiogenesis. Moreover, the production of new blood vessels due to a chronic activation of angiogenesis has liabilities, resulting in precocious capillary sprouting, convoluted and excessive vessel branching, distorted and enlarged vessels, erratic blood flow, micro hemorrhaging, leakiness, and abnormal levels of endothelial cell proliferation and apoptosis.
Studies have revealed that angiogenesis is important in microscopic premalignant stages as well as in later cancer stages as it promotes tumor mass growth18,19,30,31.
5 f. Activating invasion and metastasis.
In advanced stages of the disease, a tumor mass with epithelial origin can spread to other tissues through the epithelial-mesenchymal transition mechanism. During this process, cancer cells must be altered in order to efficiently invade and metastasize. This process is characterized by shape alterations, as well as the loss of adhesion properties to neighboring cells and to the extracellular matrix. In detail, loss of proteins such as E-cadherin, cytokeratin, or laminin-1, involved in the cell adhesion, is often observed in tumors of epithelial origin. Additionally, studies have also demonstrated alteration of these class of proteins in other types of cancer, including breast cancer32, lung cancer33, and colorectal cancer34. Not only that, molecules associated to cell migration during embryogenesis and the inflammation processes were found deregulated18,19,35,36.
More recently, four additional tumor characteristics were added to the “hallmarks of cancer”: genome instability and mutation, tumor-promoting inflammation, deregulating cellular energetics and avoiding immune destruction (Figure 1.1)19.
g. Genome instability and mutation
Throughout tumorigenesis, cancer cells acquire mutations and genomic instability, due to aberrant alterations in multiple genes including oncogenes and tumor suppressor genes. In this sense, cancer cell ability to detect and resolve DNA errors is reduced, and therefore there is increased mutation burden. Thus, cancer cells can acquire alterations that confer selective advantage, promoting cancer progression. Remarkably, these alterations are transmitted to daughter-cells during the cell cycle, leading to a mass constituted by clones of those cells. Moreover, there are evidences that genes involved in the detection and repair of DNA damage, or cell growth and proliferation, as TP53, ATM, and BRCA1 are frequently altered in order to promote tumorigenesis17,19,37–39.
h. Tumor-promoting inflammation
Tumor-promoting inflammation is also considered a cancer characteristic, since it has been found infiltrated innate and adaptative immune cells in tumors. Specifically, inflammatory cells, which are present in the tumor microenvironment, play a key role in tumor progression by facilitating the availability of molecules that promote
6 tumorigenesis, such as growth factors, survival factors, proangiogenic factors, extracellular matrix-modifying enzymes, and inductive signals to induce invasion and metastasis. Importantly, those inflammatory cells can also release chemicals that act as mutagenic factors to cancer cells, promoting cancer development19,40,41.
i. Deregulating cellular energetics
Cancer cells need to change their metabolic program in order to facilitate cancer progression. Therefore, in both absence and presence of oxygen, cancer cells metabolize glucose through anaerobic glycolysis, a process commonly used by normal cells only in the absence of oxygen. Although, glycolysis is a faster process when compared to mitochondrial phosphorylation, it is a less efficient way of adenosine triphosphate (ATP) production. Thus, in a process of aerobic glycolysis, cancer cells increase glucose transporters (GLUTs) as well as the uptake and utilization of glucose. Additionally, glycolysis is associated with cell proliferation, due to the facilitation of macromolecules and organelles biosynthesis achieved from glycolytic intermediates19,42,43.
j. Avoiding immune destruction
Although avoiding immune destruction is an emerging hallmark of cancer, this process is yet to be fully understood. The immune system cannot eliminate cancer cells neither in early/later stages nor in micro metastases. Studies have suggested that in order for cancer cells to escape from immune destruction, they block the function of components from the immune system as well as secretions that can eliminate them. For example, cancer cells alter their cell surface antigens in order to avoid recognition by the immune system cells. In this sense, cancer cells develop strategies to evade immune destruction, leading to the down-regulation of the immune system and consequently increasing cancer cells proliferation19,44.
7
1.2. Main Pathways Altered in Cancer
For the past years, several pathways have been reported to be aberrantly regulated during cancer development and progression, including the following45:
1.2.1. TGFβ Pathway
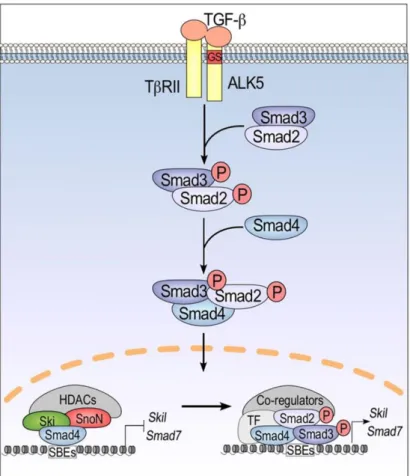
TGFβ pathway is frequently affected in cancer, since it regulates processes such as cell proliferation, apoptosis, and immortalization which are often altered in this disease. When TGFβ activates its receptor (TGFβ receptor), both Smad2 and Smad3 are phosphorylated. and associated with Smad4, constituting a complex that migrates to the nucleus. As a result, proteins that inhibit the cell cycle, as Smad7 and Skil, are produced, leading to cell cycle blockade (Figure 1.2)46–48.
In cancer, mutations/deletions in Smad2, can inactivate the TGFβ pathway, leading to cell cycle progression even in the presence of cell damage7,49. Moreover, the TGFβ receptor
can also loose it functions due to mutations or DNA methylation of its promoter, leading to inactivation of the pathway.
Figure 1.1 Hallmarks of cancer. Capabilities of tumor cells acquired during tumorigenesis (adapted
8 However, several studies have also demonstrated that TGFβ can be up-regulated in metastatic cancer cells when compared to normal cells. Specifically, TGFβ can induce the remodulation of the extracellular matrix, leading to immunosuppression, angiogenesis and activation of myofibroblast differentiation50–52.
1.2.2. Myc Pathway
Myc is considered to have oncogenic properties due to its ability to promote cell cycle progression. In fact, in order for the cell to divide it needs to fulfill multiple requisites which are verified in a checkpoint (R point). If all is correct, Myc forms a heterodimer with Max, inducing the expression of proteins that promote the cell cycle. Simultaneously, Myc can initiate the S phase through the activation of transcription factors. To note there are other pathways that can trigger Myc activation, such as Wnt, Notch, which are approached below. Contrarily, TGFβ signaling can block it (Figure
1.3).
Figure 1.2 Schematic figure representing TGFβ signaling pathway. The activation of TGFβ
9 Hence, genetic or epigenetic alterations that induce aberrant expression of Myc in cancer promotes cell growth and proliferation7,53,54.
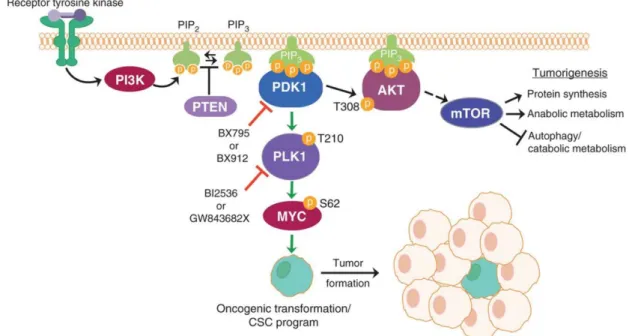
1.2.3. PI3K Pathway
PI3K is an intracellular lipid kinase that, when activated, leads to the conversion of phosphatidylinositol (4,5)-bisphosphate (PIP2) into phosphatidylinositol
(3,4,5)-triphosphate (PIP3), by phosphorylate PIP2. As a result, cytoplasmic proteins, including
AKT, can bind to PIP3. Then, two kinases, PDK1 and PDK2, phosphorylate AKT in two
sites, leading to its activation. Consequently, AKT kinase phosphorylates other substrates that regulate cell proliferation, survival, and size. Recently, there are evidences that PDK1, when activated, can also induce the expression of Myc through phosphorylation of PLK1. Moreover, PTEN can dephosphorylate PIP3, converting it to PIP2, leading to
the block of the activity of AKT (Figure 1.4)7,55–57.
Since PI3K signaling regulates several mechanisms, including cell motility, growth, proliferation, and metabolism, it can play a key role in carcinogenesis. Therefore, this pathway is commonly activated in cancer through several mechanisms, including
Figure 1.3 Schematic figure representing the Myc pathway. Myc protein can induce processes
10 genomic alterations involving PIK3CA, PIK3R1, PTEN, AKT, TSC1, MTOR, and TSC2,
58.
1.2.4. RTK/RAS Pathway
Receptor tyrosine kinases (RTKs) are receptors located in the cell surface and constituted by an extracellular (N-terminal), a transmembrane and a cytoplasmic kinase domain. This type of receptors, when activated by growth factors, hormones, cytokines, neurotrophic factors and other extracellular signaling molecules, stimulate cell proliferation, differentiation, survival and cell migration.
RTKs are monomers, which, when activated by an extracellular stimulus of its N-terminal region, forms a dimer. This dimerization leads to the auto phosphorylation of the receptor, creating a dock site to a complex that can activate Ras, a GTPase protein, that hydrolysis GTP into GDP. Consequently, when the RTK is phosphorylated, Ras is activated, inducing pathways as MAPK and PI3K. Thus, genes involved in cell proliferation and survival are activated (Figure 1.5)59,60.
Figure 1.4 Schematic figure representing the PI3K pathway. PI3K converts PIP2 into PIP3,
leading to the activation of AKT and Myc. As a result, genes involved in cell proliferation and survival are activated (from Cunningham et al. 2013).
11 In cancer, Ras is found frequently mutated, leading to its constitutive activation. Once, permanently activated Ras is incapable of releasing GTP, and therefore the hydrolysis of GTP into GDP is blocked, leading to a constitutive activation of downstream signaling7.
1.2.5. NRF2 Pathway
Generally, the transcription factor Nrf2 is considered a tumor suppressor gene, since its activation leads to the stimulation of genes involved in the defense of the cell against metabolic, xenobiotic, and oxidative stress. In fact, when the cell experiences endogenous or exogenous stress, there is an increase in Nrf2 levels, due to the non-ubiquitination of it by KEAP1. Thus, Nrf2 is translocated to the nucleus where it forms a heterodimer with MAF and binds to the antioxidant response element (Figure 1.6). As a result, genes involved in metabolism, intracellular redox-balancing, apoptosis, and autophagy are transcribed61–63.
Figure 1.5 Schematic figure representing Ras activation. The phosphorylation of RTK leads
12 Also, it is believed that Nrf2 can also act as an oncogene, by promoting the survival of cancer cells. Specifically, studies suggested that due to the anti-oxidant effect of Nrf2, cancer cells can be protected from excessive oxidative stress, chemotherapeutic agents, or radiotherapy. However, this oncogenic role in carcinogenesis is yet to be fully understood61–63.
1.2.6. Wnt Pathway
When the Wnt protein binds to its receptor it leads to the inactivation of glycogen synthase kinase-3β (GSK-3β) preventing the phosphorylation of β-catenin and blocking its degradation. Therefore, β-catenin migrates to the nucleus, where it associates with transcription factors leading to the expression of genes involved in cell proliferation (Figure 1.7).
In cancer, the aberrant activation of Wnt pathway can lead to increased translocation of β-catenin into the nucleus, and, consequently, promote the transcription of genes that promote cell survival and proliferation. Moreover, alterations of Apc, a protein that
Figure 1.6 Schematic figure representing NRF2 pathway. NRF2 pathway induces the
transcription of genes involved in the protection of oxidative stress (adapted from Zhao et al. 2017).
13 participates in the complex that promotes the degradation of β-catenin, are also frequent in cancer7,64,65.
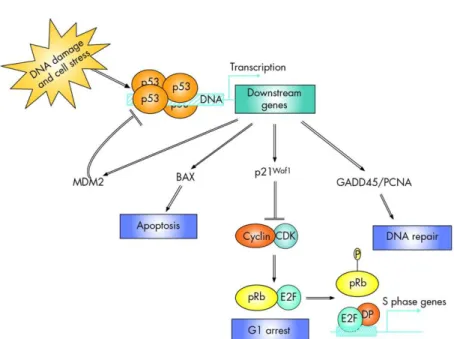
1.2.7. p53 Pathway
p53, considered the master guardian of the genome, plays a key role in apoptosis control, cell cycle arrest and DNA damaged repair (Figure 1.8). Cell stress events, including DNA damage, oncogenic stress, hypoxia, and telomerase erosion, activate the p53 pathway. Specifically, the kinase ATM can block Mdm2, a p53 inhibitor, by phosphorylate it. This event leads to p53 activation, which in turn induces the expression of genes that block cell division and DNA repair, or trigger programmed cell death (Figure 1.8)66–69.
Figure 1.7 Schematic figure representing the Wnt pathway. The expression of Wnt protein
blocks the degradation of β-catenin, leading to the transcription of genes involved in cell proliferation (from Centelles 2012).
14 In cancer, levels of p53 can be reduced, or the protein can be sequestered in the nucleus, inactivating its function7. Furthermore, mutations in TP53 can affect its folding resulting in the proliferation of cells with DNA damage and therefore promoting cancer69.
1.2.8. Notch Pathway
When the Notch receptor is activated by its Delta or Jagged ligands, suffers a proteolytic cut. As a consequence, a cytoplasmatic fragment is translocated into the nucleus, where it activates the expression of genes involved in cell proliferation, by participating in a transcription factor complex (Figure 1.9).
In cancer, there are reports that an increased expression or truncated forms of the Notch receptor are common ways to induce cell proliferation. Moreover, an increased expression of Notch ligands is also observed in several types of cancer. Also constitutive expression of Notch, due to deletions in the gene that encodes the extracellular domain of the protein, is also reported in cancer7,70–72.
Figure 1.8 Schematic figure representing p53 pathway. When p53 is activated, genes
responsible by apoptosis, cell cycle arrest and DNA repair are transcribed (adapted from Boland et al. 2005).
15
1.3. Colorectal Cancer
Colorectal cancer (CRC) consists in a multistep process which occurs due to both genetic and epigenetic alteration leading to silencing of tumor suppressors genes and increased expression of oncogenes, ultimately promoting cellular growth73. This process evolves from a hyperplasia into a adenocarcinoma which ultimately becomes able to metastasize to organs such as liver, lung, peritoneum, bone or brain74.
1.3.1. Epidemiology of CRC
According to statistical data available in GLOBOCAN about the year 2012, CRC is the third most common cancer in men and the second in women with 1, 3 million new cases diagnosed, and 693,933 deaths in the world. In Portugal, during 2012, 7,129 new cases of CRC, and 3,797 deaths due to this disease were reported (Figure 1.10).
Figure 1.9 Schematic figure representing the Notch pathway. The expression of Notch ligands
leads to the translocation of a cytoplasmatic fragment of Notch receptor. As a result, genes involved in cell proliferation are transcbribed (adapted from Avila et al. 2013).
16 The incidence is higher after 50 years of age, being the median age of diagnosis around 70 years8,75,76. In developed regions as Australia/New Zealand, Europe and Northern America the incidence of CRC is higher due to risk factors as diet and lifestyle77. In contrast, Western Africa, Middle Africa and South-Central Asia are the regions where incidence rates are lower. Despite of this, mortality rates are higher in less developed regions due to a lack of healthcare resources. With regard to 5-year survival rates, these can vary greatly, ranging from around 90% in early stages of the disease to less than 10% when the disease has metastasized78.
Sporadic CRC is the most frequent form of CRC representing about 75% of all CRC cases79. Many risk factors may contribute to cancer initiation and progression including
family history80, age81, smoking habits82, alcohol83, and diet, including both red and
processed meat84,85.
Figure 1.10 Cancer incidence and mortality in Portugal, 2012. Colorectal Cancer is the
most common cancer in Portugal, representing 14.5% of all cancer cases, accounting with 7129 new cases in 2012. Moreover, Colorectal Cancer is also the deadliest cancer, being associated to over 15% of mortality by cancer (data source: GLOBOCAN)
17
1.3.2. Disease subtypes
CRC can arise sporadically or affect patients who have a genetic predisposition, with family history, including genetic syndromes as Lynch Syndrome and familial adenomatous polyposis. Several genes altered in familial CRC have been identified, including DNA mismatch repair genes, the Adenomatous Polyposis Coli (APC), MutL Homolog 1 (MLH1), and Phosphatase and Tensin Homolog (PTEN)86.
Sporadic CRC are divided into three main subtypes, depending on the molecular alteration in its origin: microsatellite instability (MSI), chromosomal instability (CIN), and CpG island methylator phenotype (CIMP). However, the tumor can be characterized by features of these different subtypes86.
1.3.3. Colorectal Cancer Model
The model for colon and rectum tumorigenesis was initially suggested by Fearon and Vogelstein. According to that model, CRC is a multistep process that arises from benign lesions into a malignant tumor. Across the malignant transformation, somatic alterations occur, including alterations in oncogenes and tumor suppressor genes87.
It is believed that those alterations are generated and propagated through clonal evolution, meaning that mutations/epimutations occur in a cell, and are inherited by daughter cells during mitosis. When the mutations are acquired, the cell has two ways to go: either undergo senescence before entering in the cell cycle or avoid apoptosis and to entry in cell cycle. In the second case, that cell might accumulate mutations and epimutations, originating clones which altogether can be able to cause a heterogeneous tumor mass (Figure 1.11)17,88,89.
18 In CRC (Figure 1.12), chromosomal instability drives tumorigenesis, initiated by the inactivation of APC gene, and followed by mutations in KRAS. The increasing chromosomal instability leads to other successive alterations, including loss of heterozygosity (loss of 18q-long arm) and mutations of SMAD4, and Cell Division Cycle 4 (CDC4). Ultimately, mutations in TP53 allow the transition from late adenomas to cancer90.
Another less common way to develop CRC is through microsatellite instability which can facilitate tumor initiation and progression, due to lacking mismatch repair mechanisms. This pathway is often initiated by abnormal alterations in the Wnt signaling and followed by activating mutations in B-Raf Proto Oncogene (BRAF) and KRAS genes. Importantly, the inefficiency of mismatch repair genes, caused due to hypermethylation of MLH1 promoter, is increased throughout tumorigenesis. Therefore, tumor cells with mutations in genes as MutS Homolog 3 (MSH3), MutS Homolog 6 (MSH6), TGFβ receptor 2 (TGFBR2), Insulin-like Growth Factor 2 Receptor (IGF2R), and BCL2 Associated X (BAX) are positively selected. Altogether, these events lead to the activation of a mechanism responsible for tumor progression independent of TP5391.
Figure 1.11 A heterogenous tumor. The accumulation of mutations and epimutations leads to a
19
1.3.4. Staging Systems
CRC can be classified according to molecular and histological features- histological staging- or physical exams, biopsies, and imaging tests- clinical staging. These classifications allow to differentiate the state of cancer evolution and decide the best treatment option to the patient.
The most common method of classification used is the TNM system (Table 1.1) which distinguishes the cancer stages based on:
a. Tumor size (T): size of primary tumor (range from T0-T4),
b. Lymph nodes (N): whether cancer has spread to lymph nodes (range from N0-N3),
c. Metastasis (M): whether cancer has metastasized (M0 or M1).
Higher numbers of T, N, and M are associated to most advanced disease, and, consequently, to worst prognosis92. Importantly, when the category cannot be determined, it is classified by X (TX or NX).
The overall stage is obtained by the combination of these three characteristics93.
Figure 1.12 Adenoma–carcinoma sequence model schematic representation of genomic
20
Table 1.1 Colorectal Cancer staging according to the most recent AJCC system effective on
January 2018 (adapted from American Cancer Society®)
1.3.5. Screening, Diagnosis and Prognosis
The detection of CRC in early stages of the disease- screening- is based on colonoscopy, flexible sigmoidoscopy (FS), fecal occult blood testing (FOBT), and fecal immunochemical test (FIT).
Currently, colonoscopy remains the most accurate test for CRC screening and diagnosis. This technique can detect 88-98% of advanced neoplasia. Importantly, several studies have reported a decrease in mortality due to colonoscopy94. FS is also used to diagnose CRC, with a sensitivity of 90% to detect advanced neoplasia. However, both colonoscopy and FS are invasive and expensive techniques.
Overall Stage T N M
Stage I T1 N0 M0
T2 N0 M0
Stage IIA T3 N0 M0
Stage IIB T4a N0 M0
Stage IIC T4b N0 M0
Stage IIIA T1-T2 N1/N1c M0
T1 N2a M0
Stage IIIB T3-T4a N1/N1c M0
T2-T3 N2a M0
T1-T2 N2b M0
Stage IIIC T4a N2a M0
T3-T4a N2b M0
T4b N1-N2 M0
Stage IVA Any T Any N M1a
Stage IVB Any T Any N M1b
21 As an alternative to colonoscopy, FOBT and FIT can also be used to screen CRC at lower costs and in a simpler way. Nevertheless, these tests exhibit low sensitivities and specificities. FOBT only detects 13-50% of CRC cases, and 9-24% of advanced neoplasia. On the other hand, the sensitivity of FIT to detect CRC, and advanced neoplasia is 79%, and 32-53%, respectively81,95–97.
To predict CRC outcome, blood tests targeting tumor markers might be performed. Common CRC marker are the carcinoembryonic antigen (CEA), and cancer antigen 19-9 (CA 119-9-19-9). These markers have poor sensitivity and specificity in early stages of the disease. Nonetheless, over the disease progression, both specificity and sensitivity increase98,99.
The success of treatment and survival depends on the efficiency of screening/detection of cancer. In case of local CRC, the success rate is 70-90% however, in advanced CRC, the mortality is high88. In fact, the statistics presented by National Cancer Institute indicate
that 92% of stage I, 63-87% stage II, 53-89% stage III, and 11% stage IV colon cancer patients survive at least 5 years. Similarly, the rectum cancer patients in stage I-IV have a 5-years survival rate about 87%, 49-80%, 58-84%, and 12%, respectively100.
1.4. Epigenetics
Epigenetics, firstly introduced by Conrad Waddington in 1940s, is defined by reversible alterations that affect gene expression without altering DNA sequence88,101–103. Regulation of gene expression mediated by epigenetic alterations, including DNA methylation at cytosine residues in CpG dinucleotides, posttranslational modifications of amino acids on the amino-terminal tail of histones, and post-transcriptional regulation by small non coding RNAS, including microRNAs, is frequent in normal cells during embryonic development, imprinting or tissue differentiation104–106 (Figure 1.13). Moreover, these epigenetic changes contribute to the different gene expression profiles of distinct cell types107. For example, in humans there are several cell types that are originated from the same fertilized egg cell, presenting the same DNA. However, each one of these cell types have distinct function, due to the inactivation and activation of different sets of genes through epigenetic mechanisms108.
Remarkably, this process can become abnormal, resulting in aberrant changes of gene expression, and consequently in several diseases, including cancer107,109.
22 Besides that, epigenetic alterations are also determinant to tumor heterogeneity and different treatment responses. An example is the chemoresistance due to hypermethylation of the Transcription Factor AP-2 epsilon (TEAP2E) gene, that occurs in 51% of CRC110,111.
1.4.1. microRNAs
MicroRNAs (miRNAs) were discovered in Caenorhabditis elegans in 1993112 and are small non-coding ribonucleic acids (RNA) about 21-25 nucleotides in length, which are related to regulation of gene expression through complementary binding to 3’untranslated region (UTR) of its messenger RNA (mRNA) target molecules. The consequence of this binding depends on the complementarity between miRNA and its target. In case of complete complementarity, the most probable effect is mRNA degradation. In contrast, incomplete complementarity leads to translation inhibition113–115. Therefore, any
Figure 1.13 Schematic representation of epigenetic modifications. DNA methylation, histone
modification, and post-transcriptional regulation by noncoding RNA are reversible alterations which affect gene expression (from Ahuja et al. 2016).
23 alteration in the regulation of these non-coding RNAs may drive changes in gene expression which may lead to silencing or overexpression of many genes.
miRNAs are encoded either in intronic regions or in intergenic regions and are usually transcribed by polymerase II (Pol II), producing primary miRNAs (pri-miRNAs). The pri-miRNA is cleaved by DROSHA, which is constituted by two ribonuclease (RNase) III domains, generating a precursor miRNA (pre-miRNA) which is exported to the cytoplasm, where is recognized by DICER1. This RNase III enzyme cleaves the pre-miRNA, producing an RNA duplex which later associates with RNA-induced silencing complex (RISC). Importantly, this complex will be guided by the guide strand of the mature miRNA incorporated in RISC116,117 (Figure 1.14).
miRNAs have also revealed important in cancer biology, since miRNAs are able to control several targets implicated in tumor growth, invasion, angiogenesis, and immune invasion. Therefore, the function of miRNAs could be considered as tumor suppressor genes or oncogenes, depending on their target. Additionally, recent studies have demonstrated different miRNA patterns between normal and tumor tissue, and that these patterns are also able to distinct tumor types and their subtypes118.
24
1.4.2. Histone Modifications
Cells do not express all genes at the same time as gene expression depends on the needs of the cell. This is possible due to proteins associated with chromatin called histones, which stabilizes the negative charge of DNA and provides stability to the chromatin. Histones regulate gene expression through alterations in the chromatin structure, either by condensing the chromatin, which leads to gene inactivation, or by stretching the chromatin, which results in gene activation104. Therefore, protein binding sites may be exposed or masked, and consequently gene expression is altered.
A group of 8 histones (an octamer) forms the nucleosome, which comprises two of each H2A, H2B, H3 and H4 histones. Moreover, there is an additional histone, H1, that works as a linker (Figure 1.15A). Each one of these histones is susceptible to suffer posttranslational modifications, especially in the N-terminal tails. The impact of these modifications, caused by histone methyltransferases (HMT), histone acetyltransferases
Figure 1.14 miRNA processing. The gene that codifies the miRNA is transcribed originating the
pri-miRNA. This is processed by DROSHA in the nucleus and, originating the pre-miRNA.It is exported to the cytoplasm where it is cleaved by DICER and associated to the RISC complex. Lastly, the mature miRNA guides the RISC complex to the target mRNA (from Nelson et al. 2008).
25 (HAT), histone deacetylases (HDAC), and histone demethylases (HDM), depends on the modification- generally acetylation, methylation, phosphorylation, and ubiquitination- and residue where it takes place- commonly lysine or arginine residues88,119–121 (Figure
1.15B).
Figure 1.15 Nucleosome assembly and post-translational modification of histone tails. (A)
A nucleosome is an octamer of histones. (B) Each histone can suffer post-translational modifications in its tails (from Chen et al. 2014).
26 Artem Barski has identified histone modifications patterns associated to promoters, insulators, enhancers, and transcribed regions. Modifications such as mono methylation of histone 3 at lysine 4 (H3K4me1), tri methylation of histone 3 at lysine 4 (H3K4me3), and acetylation of histone 3 at lysine 27 (H3K27ac) have been associated to active enhancers, active promoters, and active enhancers and promoters, respectively. In contrast, tri methylation of histone 3 at lysine 27 (H3K27me3), tri methylation of histone 3 at lysine 9 (H3K9me3), and tri methylation of histone 3 at lysine 36 (H3K36me3) have been associated to repressive chromatin122.
1.4.3. DNA Methylation
DNA methylation consists in the covalent addition of a methyl group to the 5-carbon of a cytosine residue by DNA methyltransferases (DNMT)123. That reaction often takes place in CG dinucleotides- CpG sites. These dinucleotides can be located in CpG Islands, which are DNA regions constituted by more than 50% of CG dinucleotides in a minimum length of 200-500 bases124,125. CpGs are usually methylated in human normal cells and located outside of the promoter. Paradoxically, CpG Islands are usually unmethylated and overlapping promoter regions (Figure 1.16A)81,108.
The DNMTs enzyme family includes DNMT1, DNMT3a, and DNMT3B, where DNMT1 is responsible for maintaining methylation patterns during replication, and DNMT3a and DNMT3b are responsible for de novo methylation81,108.
This epigenetic mechanism is essential during the embryonic development, imprinting, X-chromosome inactivation, and suppression of repetitive element transcription. Importantly, there are evidences that DNA methylation plays a key role in cancer development86,126.
DNA methylation is often associated with gene inactivation, particularly when it takes place at the gene promoter (Figure 1.16B). Nevertheless, there are evidences that promoter hypermethylation can also lead to gene activation. The result of DNA methylation seems to be dependent on the region where it happens. This means that DNA methylation may affect regulatory regions, blocking protein binding sites due to the recruitment of methyl-CpG-binding domain (MBD) proteins. If the region affected is an activator binding site, the gene will be not expressed. In contrast, hypermethylation of gene promoters on repressor binding site, prevents the DNA access, leading to gene
27 expression. Another explanation of gene activation associated with promoter hypermethylation, suggested by Bert et. al, is that regional hypermethylation forces the activation of alternative transcription start sites (TSS-Figure 1.17)108,125,127.
In cancer, this epigenetic mechanism is frequently deregulated, leading to an unbalance of gene expression. When aberrant DNA methylation changes- either hypermethylation or hypomethylation- occurs in driver genes, the normal cellular function is altered, and tumorigenesis may arise.
Figure 1.16 Hypermethylation can lead to gene inactivation. (A) In normal cells, there is a
generalized methylation of the gene body, in contrast to a promotor region that is un-methylated.
(B) In the case of diseases like cancer, promotor region can be aberrantly methylated and the
region of gene body un-methylated. Consequently, that gene can be silenced. (Adapted from McBryan et al. 2014)
28
1.4.4. Epigenetic Alterations and Colorectal Cancer
Epigenetic events, which may also occur during normal ageing, have been associated with higher risk of cancer. In the early 80’s hypomethylation was associated to cancer. Moreover, in 1986, hypermethylation of calcitonin was associated with tissue-specific gene silencing. Nevertheless, hypermethylation was also associated with inactivation of tumor suppressor genes, through observations based on the Rb promoter101.
Several studies have shown that DNA methylation patterns of many genes become aberrant during carcinogenesis, including genes belonging to the Wnt and Ras signaling pathways, DNA repair genes, and cell cycle-related genes73. Specifically, in CRC, aberrantly methylated genes as Integrin Subunit Alpha 4 (ITGA4), O-6-Methylguanine-DNA Methyltransferase (MGMT), Solute Carrier Family 5 Member 8 (SLC5A8), and Secreted Frizzled Related Protein 2 (SFRP2) have been reported since early stages. Therefore, it is evident that methylation is involved in the initiation and progression of CRC. However, among all abnormally methylated genes, there is no evidence that a specific functional class of genes is more affected during specific steps of CRC initiation or progression81.
In addition, studies have suggested that DNA methylation as well as genetic alterations play a role in cancer progression and metastasis. Methylated genes as TIMP Metallopeptidase Inhibitor 3 (TIMP3), Inhibitor of DNA Binding 4 (ID4) and Interferon Regulatory Factor 8 (IRF8) are more frequent in advanced CRC than in adenomas,
Figure 1.17 Promoter hypermethylation can be associated with gene activation. (A)
Promoter hypermethylation can happen in a region of repressors binding. Hence, when hypermethylation occurs, the transcriptional repressor is blocked, leading to abnormal gene activation. (B) Promoter hypermethylation can lead to the gene activation through alternative TSS. (Adapted from Bert et al. 2013)
29 providing clonal growth advantage. Despite association to advanced stages, DNA methylation seems to be most prevalent in CRC initiation rather than in its progression81.
1.4.5. Epigenetic biomarkers as predictors of clinical outcome
A biomarker is any substance, structure, or process that can be estimated, and used in order to identify normal biological processes, pathogenic processes, treatment responses, or evolution of the disease128. Hence, epigenetic biomarkers could be useful in the clinic for diagnosis, prognosis or prediction of responsiveness to therapy.
Specifically, in CRC, in spite of efforts to identify new biomarkers capable to detect or predict progression and therapy response, there is a lack of accurate biomarkers. Moreover, as reported before, the detection of CRC in early stages is crucial to the efficiency of the treatment.
Therefore, measuring DNA methylation levels of specific sites can be a potential biomarker, since DNA methylation patterns are found usually altered in CRC. Not only that, DNA methylation levels can be detected through non-invasive methods, such as evaluation of tumor-derived cell-free from blood or feces, making it a good biomarker129,130.
Until now, few epigenetic biomarkers have been reported in CRC, including aberrant methylation of Septin 9 (SEPT9) detected in plasma (sensitivity and specificity of almost 90%), methylation of SFRP2 detected in serum and fecal DNA (sensitivity of almost 67%)131, methylation of Thrombomodulin (THBD) detected in blood (sensitivity of 74% to stage I/II CRC at a specificity of 80%)132 and methylation of Syndecan 2 (SDC2) also detected in blood (sensitivity of 92% for stage I)133. An epigenetic biomarker based on aberrant methylation of Vimentin (VIM) is currently commercialized in the United States for early detection of CRC with 83% of sensitivity and 82% of specificity81. Among all existent epigenetic biomarkers, two meta-analysis estimate that the sensitivity to diagnose CRC and adenomas is about 62%-75%134,135.
1.5. Databases Analysis and Statistic Methodologies
In the last years, the amount of data available in public repositories has increased enormously. The Cancer Genome Atlas (TCGA), The National Center for Biotechnology