REGIONAL PLANNING INSIGHTS FROM A PORTUGUESE BI-REGIONAL INPUT-OUTPUT MODEL – THE POTENTIAL IMPACT OF AGRI-FOOD
INDUSTRY
Ana Sargento1, Pedro Ramos2, Eduardo Barata3, Luís Cruz4
1
Management for Sustainability Research Centre, School of Technology and Management, Polytechnic Institute of Leiria, Leiria, Portugal, [email protected].
2
GEMF – Faculty of Economics, University of Coimbra, Coimbra, Portugal, [email protected]. 3
GEMF – Faculty of Economics, University of Coimbra, Coimbra, Portugal, [email protected]. 4
REGIONAL PLANNING INSIGHTS FROM A PORTUGUESE
BI-REGIONAL INPUT-OUTPUT MODEL – THE POTENTIAL IMPACT
OF AGRI-FOOD INDUSTRY
ABSTRACT
In Portugal, the public debate at regional level is typically engaged in the discussion of asymmetries amongst the ‘interior’ and the ‘coast’. What is often discussed, with political and social relevance, is the extent of the interior’s delay (in terms of development) comparatively to the coastal region, and into what extent the dynamics of the economy, or eventually the ‘bias’ introduced by public policies, contributes to this drawback. Interestingly, however, the Portuguese regional science has miscarried this debate, largely on the grounds that the official statistics do not include this cleavage. Indeed, the design of the NUTS II in Portugal splits the country horizontally, forgetting the vertical gap that splits the interior regions from the coastal ones. The first objective of this paper is therefore to refocus the debate - in scientific terms – on the actual territorial disparity in Portugal: the contrast Coast-Interior.
Accordingly, this paper starts by presenting the structure of a bi-regional Input-Output (IO) model for the Portuguese Economy. We consider a rectangular IO model (431 products by 125 industries), decomposing the Portuguese economy into two regions with comparable territorial sizes (the Coastal Region, comprising 44% of the Portuguese continental area, and the Interior Region). the model is ‘closed’ for the private consumption of households below 65 (which is supposed to be endogenous, as it depends on regional employment and therefore on households’ earnings
Multi-regional IO models describe the inter-sectoral dependencies both within the region and between the regions. The main aim is then to assess how the effects of a shock that hits only one of the regions are ‘distributed’ among the two regions. In particular, we intend to analyse at a greater detail the role of the agri-food sector in the Interior Region.
Overall results illustrate the dependence of the Interior on the Coastal region, and that the (positive or negative) effects of a shock that hits the Interior Region tend to leak significantly to the Coastal Region, while an exogenous event in the Coastal Region tends to see its effects relatively more contained within the region.
Thus, this analysis can be particularly relevant to policy-makers in dealing with regional and territorial planning, as they are better informed about the root causes of some outcomes. Accordingly, a summary of the key lessons learned and a discussion of their policy relevance, both at regional and national levels, will be offered.
Keywords: Agri-food industry; Direct, indirect and induced effects; Inter-regional impacts;
1. INTRODUCTION (THIS IS THE STYLE TO USE FOR THE TITLES OF SECTIONS)
Regional asymmetries within the Portuguese economy are typically between the Coast and the Interior part of the country. More specifically, there is a recognized relative delay of the Interior, being it at the heart of the public debate concerning regional policy. However, Portuguese regional science has frequently ignored this Coast-Interior gap, on the grounds that the regional NUT II division of the country splits it horizontally, disregarding the vertical gap. The first objective of this paper is therefore to refocus the debate – in scientific terms – on the actual territorial disparity in Portugal: the contrast Coast-Interior. Using an aggregation of NUT III regions, Interior and Coast are geographically defined as in Figure 1.
Figure 1 – Interior and Coast regions in Portugal
Whenever regional disparities are mentioned, a common policy question emerges: what are the regional effects produced by a certain stimulus policy, or merely an exogenous shock, especially directed towards the less developed region? Multi-regional input-output models are an adequate tool to answer such question, as they describe the inter-sectoral dependencies both within the region and between the regions. Thus, in reaction to an external shock, the multi-regional IO framework allows to estimate, e.g., the spillover effects that may be felt in
other regions and the feedback ones that ‘return’ to the region which initially felt the original disturbance.
Our modelling approach departs from the construction of a bi-regional model for the Portuguese economy, considering Interior and Coast as the two regions, where both the model and the database are formulated in terms of detailed technical parameters, reproducing inter-sectoral and interregional interdependencies.
In this paper, the empirical application of the input-output model is focused on a specific group of products, namely agri-food products and beverages, given its presumed importance for the broad development of the Portuguese economy and, in particular, of the Interior region. It is a common idea that a higher specialization in this sector offers potential for economic growth and employment, for developing regional economies and enhancing cultural wealth diversity and traditions. Political authorities and regional business associations claim that this industry may contribute to a smart specialization strategy of some Portuguese Interior regions, featuring relevant opportunities of contributing to ease the structural external deficit. This research aims to explore the validity of these arguments, through the following research question: “considering a positive shock in demand for Interior’s agri-food products, what is the significance of the corresponding impact and on what degree is it retained within the Interior region?”.
This paper is organized in five sections, including this Introduction. Section 2 aims at a brief characterization of agri-food industry’s importance in the Portuguese economy. In section 3, a bi-regional input-output model is established, making explicit the model structure and the applied regionalization methodology. The fourth section falls upon the analysis of the regional impacts (in terms of output, GVA and employment), considering the scenario of an initial increase in final demand for agri-food products, taking place in the Interior region (and afterwards in the Coast region). Finally, section 5 refers to the relevance and policy implications of the total impacts and prospective leakages between these two regions.
2. AGRI-FOOD INDUSTRY IN THE PORTUGUESE ECONOMY
The agri-food industry – here defined as manufactured food products and beverages – occupies an important role in the Portuguese economy. Table 1 presents data for the period 2004 to 2010 regarding to the characterization of this sector, with reference to the number of companies, number of employees and GVA.
Table 1 – Characterization of the agri-food sector (2004-2010) 2004 2005 2006 2007 2008 2009 2010P Companies (n.) 10 089 10 268 10 683 11 017 10 835 10 461 10 513 Employees (n.) 100 469 101 257 103 840 106 097 104 957 109 040 109 585 VAB (Million €) 2 423 2 477 2 467 2 724 2 822 2 875 2 889 P – Provisional data.
Source: National Institute of Statistics (INE) and Portuguese Federation of Agro-food Industries (FIPA)
The agri-food sector includes around 12 % of the companies of the manufacturing sector, and 2% of total employment and total GVA of the Portuguese economy. Additionally, it has an important presence in international trade of goods. Table 2 depicts the relative importance of these products in total imports and total exports of goods, revealing a considerable and increasing weight in either of these trade flows.
Table 2 – Importance of agri-food Portuguese sector in international trade of goods (%).
2005 2006 2007 2008 2009 2010P EXP agri-food /EXP Goods 8,1 8,1 8,8 10 11,6 10,6 IMP agri-food /IMP Goods 12,2 12,1 12,9 13,2 15 14 P – Provisional data.
Source: Own calculations and National Institute of Statistics (INE).
The relative importance of the interior against the coastal region regarding this sector has been relatively stable during this period. Projections with reference to 2010 data, indicate that 26% of agri-food sector companies are located in the interior region. These are responsible for about 18% of the number of employees in the sector and about 16% of its total GVA.
The agri-food sector is made up of a very diverse number of products and industries with the common feature of transforming raw materials into food and beverages, for different types of consumers. The weight of the different industries is quite differentiated. Beverages, meat products and dairy products are the major sectors representing 47% of the total. The large majority of agri-food companies are of small size. Many of these companies, especially in the beverages’ industry, also play an important role in Portuguese cultural and touristic activities.
3. THE PORTUGUESE BI-REGIONAL INPUT-OUTPUT MODEL: METHODOLOGICAL FEATURES.
3.1. Bi-regional input-output model structure.
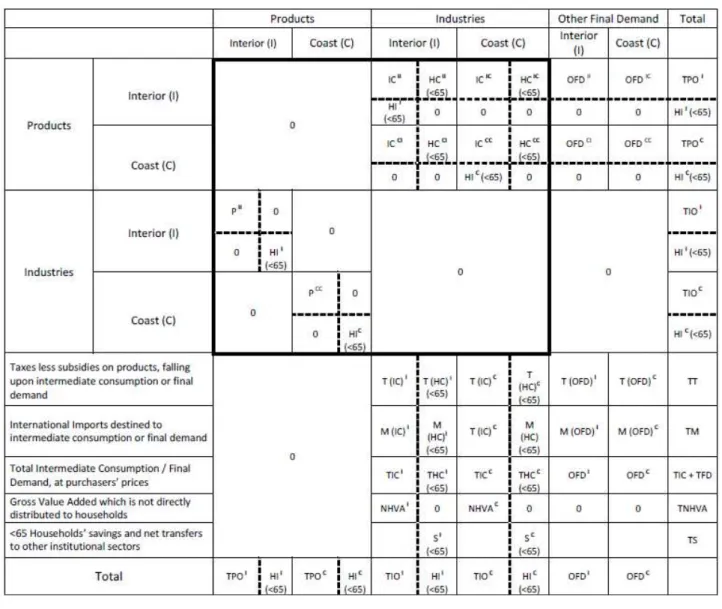
The Portuguese bi-regional input-output model applied in this research corresponds to the structure described in Table 3.
Table 3 – Bi-Regional Input-Output model’s structure.
In which:
I – Interior C – Coast
ICij i,j = I, C - Intermediate consumption of i’s regional products, used by j’s industries.
HCij(<65) i,j = I, C - Final consumption of i’s regional products, consumed by households living in j,
OFDij i,j = I, C - Other final demand for i’s regional products, used in j.
HIi (<65) i = I, C - region i’s <65 Households’ income
TPOi i= I, C - Total output of products produced in region i, at basic prices
Pii i = I, C - i’s regional products, according to the producing industry (generic element of the supply
table)
TIOi i= I, C - region i’s total industry output, at basic prices
T (g)i i= I, C; g= IC,HC,OFD - Taxes less subsidies on products, falling upon g, in region i
TT - Total Taxes less subsidies on products
M(g)i i= I, C ; g= IC, HC, OFD - International Imports destined to use g, in region i
TM - Total International Imports.
TICi i= I, C - Total intermediate consumption by industries, in region i, at purchasers’ prices
THCi (<65) i= I, C - Total region i’s <65 Households’ consumption, at purchasers’ prices
OFDi i= I, C - Other final demand in region i, at purchasers’ prices
TIC + TFD - Total intermediate and final demand, at purchasers’ prices
NHVAi i= I, C - Gross Value Added which is not directly distributed to households, in region i
TNHVA - Total Gross Value Added which is not directly distributed to households
Si (<65) i= I, C - <65 Households’ savings and net transfers to other institutional sectors in region i
S - Total <65 Households’ savings and net transfers to other institutional sectors in region i
The model is based on a supply and use format, with a high level of product and industry disaggregation (precisely, 431 products and 125 industries). Product flows are considered in a “domestic” base, i.e. including only flows of goods and services produced within the regional economy – either in I or C. Valuation is made at basic prices, concerning product as well as industry output.1
Additionally, the model is closed with respect to households headed by a family member still in working age (less than 65 years old). This age limit is justified by the fact that these households’ income comes mostly from their participation in production, either as employees (wages), or self-employed (mixed income). Thus these households’ consumption is endogenously determined by that kind of income, which, in turn, is determined by the output
1
Although total final demand and total intermediate consumption (incorporated in the industries’ output at basic prices) is also valued at purchasers’ prices, as can be seen in Table 1.
of the different industries.2 The consumption of households headed by someone more than 65
years old – typically a retired person, benefiting from redistributive transfers, such as pensions – is considered to be exogenous, and thus is included in the vector of Other Final Demand (OFD), in region I or C. 3
The core of our bi-regional input-ouput table is contained within a bold border, enclosing the supply and use matrices which will be further manipulated in order to compute the inverse matrix. Reading the use matrix (upper right-hand corner of the core table) row-wise, one is informed of the different uses of the 431 products, produced in region I and region C, distinguishing by type and by location of use: in region I or C. Column information concerns to industries, depicting intermediate consumption in each industry and each region, distinguishing the regional origin of each input (I or C). As the model is closed with respect to households, columns also contain the amount of Household Income generated by each industry, in each region. The lower left-hand side of the core table corresponds to the typical supply table: rows in matrices PII and PCC depict the product composition of each industry (including both primary and secondary products), in I and C, respectively.
3.2. Regionalization methodology.
The above modeling approach demanded for several plausible hypotheses, aiming at the decomposition of national flows between regions I and C, carried out on a top-down basis (as it has been done in previous similar studies, namely: Lahr (1993); Hulu and Hewings (1993); Eding et al. (1997) and Schwarm et al. (2006)). Departing from the national supply and use tables for reference year 2007, the maximum available data provided by Regional Accounts were used. In the Portuguese case, available data was limited to: Total Industry Output, Total Intermediate Consumption at purchasers’ prices, and Gross Value Added (including separate knowledge of employees compensation), for each of the 125 industries and by region. Besides this core set of regional data, additional sources were used, namely:
- The estimation of households consumption was based on the Households
Expenditure Survey, applied every five years by the Portuguese Institute of Statistics.
This survey, together with demographic regional data, allowed for the estimation of
2
Commuting or other type of systematic migrations between I and C are not considered in this version of our
model; thus, income generated in each region affects exclusively household consumption in the same region. 3
Besides household consumption of >65 households (headed by someone more than 65 years old), Other Final
Demand includes: final consumption expenditure of general government and non-profit institutions serving households, investments and also final consumption expenditure of non-residents (in Portugal), mainly associated to tourism, as well as other exports of goods and services.
consumption structures by region and also by age-group of households (<65 or >65 years old). This distinction is particularly important in the context of a closed model with respect to <65 households, as the objective is to capture induced effects of an increased income on the consumption of these households, which differs from the typical consumption bundle of >65 households.
- The generic assumption concerning industries’ secondary production (which, in most cases, was not significant) is that the weight of secondary products would be the same in each region, as in the whole country (using National Accounts’ data). However, regarding primary products, in cases in which the same industry produces more than one primary product, regionally-specific supply-side information was gathered in order to infer the dominant primary products by industry, in each region. 4
As usual in similar studies, we have adopted the national technology assumption, applied to both regions, in each of the 125 industries.5 In our data context, it means that we have considered the same structure (by 431 products) of each industry’s intermediate consumption (since GVA is previously known, by region). It is also worthwhile remarking that this equal technology assumption is considered on a “total flow” perspective, i.e. each input is assumed to have the same weight on total intermediate consumption, regardless of the local source of production. Actually, international imports propensity for each product was also assumed to be the same in both regions (thus, equal to the national one), and irrespective of the type of product use.6
Inter-regional trade estimation deserves a special attention in this methodological section, given the typical difficulty associated with this step in any multi-regional input-output table assemblage. The reason is simply the fact that – unlike the remaining aggregates – there is no national reference value (as inter-regional trade is obviously equal to zero when the whole country is taken into account). However, in the specific case of a bi-regional model, such as the case here, this task is fairly simplified. Indeed, in any regional input-output model, net inter-regional exports by region may be estimated through the commodity-balance method: having estimated each product’s supply and use components for any given region, the
4
In most of these cases, this information came from employment data. In the case of Agriculture, in which one
industry corresponds to 63 distinct products, we were able to use direct information from Agricultural Census, for 2009.
5
Ramos and Sargento (2011) refer to the conditions which minimize the inadequacy of this assumption. It must be noticed that a high level of industry disaggregation is crucial for such assumption’s reasonability.
6
difference between supply and use corresponds to net inter-regional trade7, being positive (negative) whenever regional supply is higher (lower) than regional use. Moreover, in a bi-regional model, net exports of any product by one of the regions are necessarily symmetric to net imports of the same product by the other region (as long as the estimation methodologies are consistent for both regions). Besides, in the presence of only two regions that sum up to the whole country, it is always true that one region’s exports are the other region’s imports and vice-versa (concerning inter-regional trade). Such information – about the origin and destination of inter-regional trade flows – is extremely important within the context of multi-regional input-output models, aiming at the correct estimation of spillover and feedback effects originated by any exogenous shock in one of the regions of the system.
Still, the estimation of the gross value of inter-regional imports (and, as a consequence, of inter-regional exports) is not immediately solved, even in a bi-regional input-output model. The typical regional input-output impact analysis aims at estimating a local effect of any given final demand change. That depends on the degree of local provision in each transaction flow, resulting from the exogenous shock. This means that gross imports (either international or inter-regional) must be known in order to be expurgated from the local impact analysis. In other words, we had to solve what is usually named by crosshauling problem (Robinson and Miller, 1988).
The applied procedure to estimate gross inter-regional imports was based on a previous classification of products, according to the degree of tradability, and the adoption of different local source coefficients according to the type of product.8 In fact, most products may be included in one of two extreme categories, for which inter-regional gross imports estimation will be straightforward:
- type A products are regionally non-tradable, i.e., products that must be
produced in the same region where they are consumed, and therefore not imported from other regions (nor from other countries); examples of such products include: building construction, retail trade (except fuel) services, general government services, education and several personal services. For products classified under this category, inter-regional imports were assumed to be null in both regions (consequently, there are no inter-regional exports, either). In other words, the regional intermediate or final
7 In fact, this difference also includes any estimation errors, either concerning supply or demand side. 8
A similar approach was adopted in Barata et al. (2011) to estimate gross inter-regional imports in the context of
single region models for small regions belonging to the Portuguese Interior, and developed in Ramos et. al (2013) already in a bi-regional model context.
consumption flow is assumed to be entirely satisfied by regional source production (Ramos et al., 2013).
- type B products are fully tradable, international and inter-regionally, i.e.,
products that move between regions at no (or non-significant) cost, namely within a small country like Portugal. In this case there is no valid reason to justify any regional preference, leading us to the following proposal: the proportion of local supply is supposed to be equal to the region output weight of that product in the national total. Given the relative weight of each region in national output, this means that in most cases region C is almost self-sufficient and also that it supplies a high percentage of
I’s demand. Most of industrial products were classified under this category.
There are however exceptions to this binary classification. Some products (not many, but with significant transaction amounts) are considered to fall into an intermediate category:
- type C products are regionally tradable between specific regions, for several
reasons; one of them is high shipping cost, leading to trade between neighbor regions. Other interesting situation leading to the classification of some products such as type
C, is what has been named "headquarters effect" (Ramos et al., 2013). Indeed, some
services demand has a local origin, but it is met by nationwide companies that, for reasons of internal organization, have a significant part of their business located in the national headquarters, or on regional headquarters that do not have to necessarily be located in small interior regions. Although this is essentially local demand, production occurs partially in other regions, which is equivalent to import from these regions, a fraction of the total product output.
Most relevant financial intermediation and post and telecommunications services, but also some services provided mainly to companies constitute examples of such "headquarters effect". In these cases, a detailed analysis was carried out at the NUT III level, leading us to the conclusion that production was concentrated in a few NUT III regions, which were assumed as exporting theses services to the remaining regions (that shared a similar weight in national output, concerning such services). Finally, the majority of agricultural products, wholesale trade, transportation services and some specific industrial products were also treated as type C products, assuming as a basic assumption a minimum local source provision
of 50%, plus a percentage equal to the region’s weight on national output of the same product.9
This proposed methodology resulted in our first estimate to gross inter-regional imports by product, for both regions: I and C. Inter-regional exports were computed as the difference between inter-regional imports and previously known net trade. Yet, even if net trade is symmetric between the two regions, it does not imply that the estimated gross imports for one region mirrors the estimated gross exports of the other. Hence, a final consistency adjustment was made in order to guarantee that coincidence, consisting in an increase in inter-regional exports and imports of one region, decreasing at the same time inter-regional exports and imports of the other region, until gross exports of one region matched gross imports of the other, for each product. The distribution of the adjustment made in each region was made taking into account its relative weight in the product’s output.
3.3. Estimating regional impacts.
Once the bi-regional input-output table is completed, regional impacts may be assessed through the implementation of a bi-regional model. Referring back to Table 3, the matrices and vectors enveloped within the bold border constitute the core of the model, i.e., the basis for the Leontief inverse computation. The first step consists in dividing all elements of those matrices and vectors by the correspondent column totals (presented at the bottom row of Table 3). Some methodological specification must be made concerning this operation:
- Regarding intermediate consumption matrices (at the upper right-hand corner), it must be emphasized that, given the closure of the model, they are extended by an additional column and an additional row. Column m+1 (being m the number of industries) is composed of <65 household consumption coefficients, computed as the division of each product’s consumption by total Household Income. Row n+1 (taking
n as the number of products) in each region represents labor (and mixed income) input
coefficients of that region, obtained by the quotient between labor compensations and mixed income of each industry and the correspondent Total Industry Output. In matrix terms, one obtains a coefficient matrix Q (of dimension 2*(n+1) by 2*(m+1), composed by four sub-matrices as follows:
= CIII CCIC Q Q Q Q Q 9
This ad-hoc percentage was then subjected to a sensitivity analysis, reducing it to 30%, 40%, and increasing it
- Concerning the make matrix, the division of each element by the column total (total product output) relies on the hypothesis that each industry has its own specific way of production, irrespective of its product mix (corresponding to the so-called Industry Technology assumption).10 Representing by S the resulting block matrix (of dimension 2*(m+1) by 2*(n+1)), we have: = I C S 0 0 S S
The bi-regional input-output model can, thus, be written as the matrix system, in which p, g and f are column vectors representing, respectively, total product output, total industry output and the exogenous Other Final Demand11:
(
)
(
)
(
)
(
)
− − − − + = − − = = + − − − − − 0 f SQ I S SQ I SQ I Q S SQ I Q I g p 0 f I S Q I g p g p 0 f g p 0 S Q 0 1 1 1 1 1 ( 1)Taking as an objective to simulate impacts on industry’s supply (g) caused by changes in exogenous final demand for products (f), multipliers are obtained from the lower left-hand block of this inverse matrix, using:
(
)
[
I SQ S]
fg= − 1 ⋅∆
∆ −
( 2)
4. ASSESSING IMPACTS FROM AN EXOGENOUS INCREASE IN
AGRI-FOOD PRODUCTS’ DEMAND.
The aim of this section is to illustrate the potential of the agri-food industry, simulating an increase in products’ final demand and computing the corresponding economic impact on
10
Alternative hypothesis may be applied in order to develop the input-output model from the rectangular format.
For a detailed discussion, please refer to Pereira et al. (2011) and Sargento et al. (2011). 11
industries’ output, GVA and employment, and its regional distribution, through the previous described bi-regional input-output model.
Our impact analysis consists in assuming an unitarian exogenous increase in agri-food products’ final demand, of ten million euros, distributed by each product, according to its relative weight in total output. 12 In the first scenario considered, we have assumed that the demand increase would occur in Interior region. Such increase represents a relative change of 0,05%, assuming total final demand in Interior region for these products, in 2007.
From a bi-regional model closed with respect to households, such as the one used in this research, it is possible to decompose the total impact felt on the whole Portuguese economy (by industries) among impact on Interior and impact on Coast and also distinguish between direct13, indirect and induced effects (Miller and Blair, 2009). Besides, industry impact is not only measured in terms of effects on output, but also on gross value added and on employment, using appropriate value added and employment coefficients to do so.
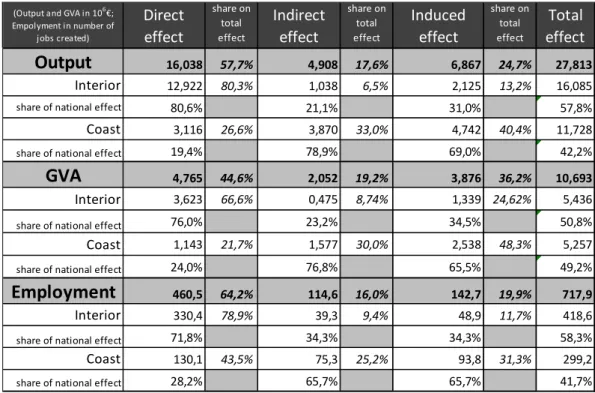
Table 4 sums up the main results of this impact analysis exercise. From these results, it is worth to notice that:
- The total national effect on output, GVA and employment resulting from such increase in agri-food final demand is considered to be moderate. The national effect on output demonstrates that the type-II multiplier effect (including induced effects) of agri-food products and beverages is around 2,8, which represents a reasonable effect.
- Concerning the impact’s regional distribution, it is clear that a considerable share of the total effect (over 40%, either measured in terms of output, GVA or employment) leaks to the coastal region.
- Regarding the relative weight of each type of effect (direct, indirect or induced), it is meaningful noticing the weak share of indirect effects in Interior, irrespective of the type of impact computed (output, GVA or employment). Besides, a great part of the indirect effect is felt in Coast, emphasizing the low degree of interdependence in Interior region and high external dependence of the latter vis-à-vis Coast’s supplies.
12
We have relied on the Statistical Classification of Products of the Portuguese National Accounts – 2006 basis,
assuming a demand increase distributed by 45 different products included in categories 10 (Food products) and 11 (Beverages) of group C (Manufactured products).
13
By direct effects we mean the first wave effects on the production of the inputs directly consumed by the
- Finally, it is important to highlight the relative weight of the induced effect, mainly in Coast, regardless of the type of effect considered. The relevance of such effect supports the option for the closure of the bi-regional model, a necessary condition for the estimation of induced effects.
Table 4 – Economic impact resulting from a 106€ increase in exogenous final demand for agri-food products in Interior region
Direct effect share on total effect Indirect effect share on total effect Induced effect share on total effect Total effect 16,038 57,7% 4,908 17,6% 6,867 24,7% 27,813 12,922 80,3% 1,038 6,5% 2,125 13,2% 16,085 80,6% 21,1% 31,0% 57,8% 3,116 26,6% 3,870 33,0% 4,742 40,4% 11,728 19,4% 78,9% 69,0% 42,2% 4,765 44,6% 2,052 19,2% 3,876 36,2% 10,693 3,623 66,6% 0,475 8,74% 1,339 24,62% 5,436 76,0% 23,2% 34,5% 50,8% 1,143 21,7% 1,577 30,0% 2,538 48,3% 5,257 24,0% 76,8% 65,5% 49,2% 460,5 64,2% 114,6 16,0% 142,7 19,9% 717,9 330,4 78,9% 39,3 9,4% 48,9 11,7% 418,6 71,8% 34,3% 34,3% 58,3% 130,1 43,5% 75,3 25,2% 93,8 31,3% 299,2 28,2% 65,7% 65,7% 41,7%
share of national effect
Employment
(Output and GVA in 106€; Empolyment in number of jobs created) Coast Interior Interior Coast
Output
GVA
Coast Interior share of national effectshare of national effect
share of national effect
share of national effect
share of national effect
Source: Authors’ calculations.
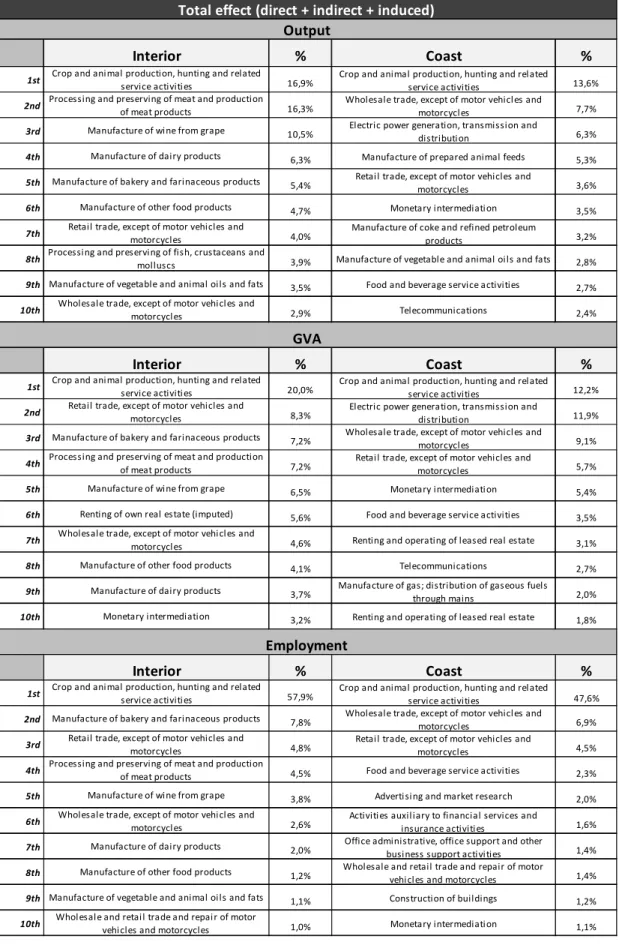
Table 5 allows for an industry-disaggregated analysis. It shows the rank of industries with the ten highest total impacts (considered as the sum of direct, indirect and induced effects), resulting from the supposed final demand increase in the Interior, distinguishing by region(Interior and Coast) and by type (output, GVA and employment) of impact.
The first remark refers to the impact felt in agriculture (named as “Crop and animal production, hunting and related service activities”), which occupies the first position in any of the above presented rankings, either concerning impact felt in Interior or in Coast. The weight of the impact on agriculture relative to the impact felt on the whole economy is particularly high in terms of the jobs created in Interior: almost 60% of jobs created as a consequence of the final demand increase arise in agriculture.
Table 5 – “Top 10” industries with greatest Total effect
% Coast %
1st 16,9% Crop and animal production, hunting and rel ated
service activities 13,6%
2nd 16,3% Wholesale trade, except of motor vehicl es and
motorcycl es 7,7%
3rd 10,5% Electric power generation, transmission and
distributi on 6,3%
4th 6,3% Manufacture of prepared animal feeds 5,3%
5th 5,4% Retai l trade, except of motor vehicles and
motorcycles 3,6%
6th 4,7% Monetary intermediati on 3,5%
7th 4,0% Manufacture of coke and refined petroleum
products 3,2%
8th 3,9% Manufacture of vegetable and animal oi ls and fats 2,8%
9th 3,5% Food and beverage service activities 2,7%
10th 2,9% Telecommunications 2,4%
% Coast %
1st 20,0% Crop and animal production, hunting and rel ated
service activities 12,2%
2nd 8,3% Electric power generation, transmission and
distributi on 11,9%
3rd 7,2% Wholesale trade, except of motor vehicl es and
motorcycl es 9,1%
4th 7,2% Retai l trade, except of motor vehicles and
motorcycles 5,7%
5th 6,5% Monetary intermediati on 5,4%
6th 5,6% Food and beverage service activities 3,5%
7th 4,6% Renting and operating of leased real estate 3,1%
8th 4,1% Telecommunications 2,7%
9th 3,7% Manufacture of gas; distributi on of gaseous fuels
through mains 2,0%
10th 3,2% Renting and operating of leased real estate 1,8%
% Coast %
1st 57,9% Crop and animal production, hunting and rel ated
service activities 47,6%
2nd 7,8% Wholesale trade, except of motor vehicl es and
motorcycl es 6,9%
3rd 4,8% Retai l trade, except of motor vehicles and
motorcycles 4,5%
4th 4,5% Food and beverage service activities 2,3%
5th 3,8% Adverti si ng and market research 2,0%
6th 2,6% Activiti es auxil iary to financial services and
insurance activiti es 1,6%
7th 2,0% Office administrative, office support and other
busi ness support acti vi ties 1,4%
8th 1,2% Wholesale and retail trade and repair of motor
vehi cl es and motorcycles 1,4%
9th 1,1% Construction of buildings 1,2%
10th 1,0% Monetary intermediati on 1,1%
Total effect (direct + indirect + induced)
Processing and preserving of meat and production of meat products
Manufacture of wi ne from grape Renting of own real estate (imputed) Manufacture of other food products Retail trade, except of motor vehicles and
motorcycles
Processi ng and preservi ng of fish, crustaceans and molluscs
Manufacture of vegetable and animal oi ls and fats
GVA
Manufacture of bakery and farinaceous products
Interior
Crop and ani mal production, hunting and related service activiti es
Processing and preserving of meat and production of meat products
Manufacture of wi ne from grape Manufacture of dairy products Manufacture of bakery and farinaceous products
Wholesale trade, except of motor vehi cl es and motorcycl es
Interior
Crop and ani mal production, hunting and related service activiti es
Retail trade, except of motor vehicles and motorcycles
Output
Whol esal e and retai l trade and repai r of motor vehi cles and motorcycles Wholesale trade, except of motor vehi cl es and
motorcycl es Manufacture of other food products
Manufacture of dairy products Monetary intermediation
Employment Interior
Crop and ani mal production, hunting and related service activiti es
Manufacture of bakery and farinaceous products Retail trade, except of motor vehicles and
motorcycles
Processing and preserving of meat and production of meat products
Manufacture of wi ne from grape Wholesale trade, except of motor vehi cl es and
motorcycl es Manufacture of dairy products Manufacture of other food products Manufacture of vegetable and animal oi ls and fats
Our second comment strengthens the already mentioned low degree of industry interdependence in Interior: besides agriculture, most of the industries positioned in the Interior rank, are those which produce (as main production) the products in which the initial shock occurs, jointly with retail and wholesale trade. Conversely, a great part of impact felt in Coast is absorbed by other generic services and supplies to firm activities.
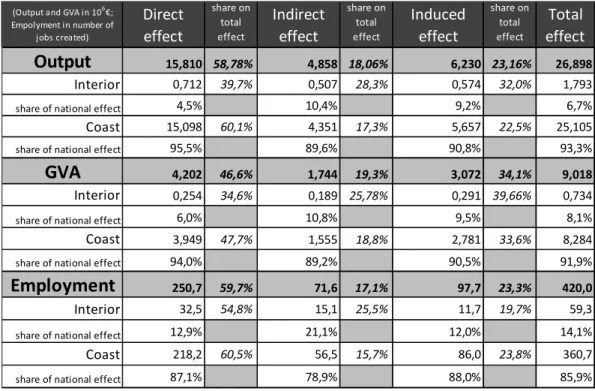
In order to evaluate the degree of asymmetry of a potential exogenous shock on final demand, an additional simulation exercise was carried out, aiming to answer the following question: what would be the national and regional effect if the same final demand increase (exogenous increase in agri-food products’ final demand, of ten million euros, distributed by each product, according to its relative weight in total output) was directed towards the Coast region? Table 6 (equivalent to Table 4) gives the main results of this second impact analysis exercise.
Table 6 – Economic impact resulting from an increase in exogenous final demand for agri-food products in Coast region
Direct effect share on total effect Indirect effect share on total effect Induced effect share on total effect Total effect 15,810 58,78% 4,858 18,06% 6,230 23,16% 26,898 0,712 39,7% 0,507 28,3% 0,574 32,0% 1,793 4,5% 10,4% 9,2% 6,7% 15,098 60,1% 4,351 17,3% 5,657 22,5% 25,105 95,5% 89,6% 90,8% 93,3% 4,202 46,6% 1,744 19,3% 3,072 34,1% 9,018 0,254 34,6% 0,189 25,78% 0,291 39,66% 0,734 6,0% 10,8% 9,5% 8,1% 3,949 47,7% 1,555 18,8% 2,781 33,6% 8,284 94,0% 89,2% 90,5% 91,9% 250,7 59,7% 71,6 17,1% 97,7 23,3% 420,0 32,5 54,8% 15,1 25,5% 11,7 19,7% 59,3 12,9% 21,1% 12,0% 14,1% 218,2 60,5% 56,5 15,7% 86,0 23,8% 360,7 87,1% 78,9% 88,0% 85,9% Interior share of national effect Coast share of national effect
GVA
Interior share of national effect Coast share of national effect
Employment
share of national effect (Output and GVA in 106€; Empolyment in number of
jobs created)
Output
Interior share of national effect Coast
Comparing these results with those of Table 4, the first remark refers to the amount of the total national effect. It is confirmed that the location of the initial shock is not indifferent: if the initial shock occurs in Coast, instead of Interior, the resulting national effect is somewhat
lesser in terms of output and GVA and considerably reduced in terms of jobs created. Of course, we are aware of the productivity effect that must be recognized when analyzing employment effects – one of the reasons behind the large employment effect in Interior (in the first scenario) is its lower labor productivity, with impacts on the production costs and, consequently, on competitiveness of produced goods and services.
It is also evident that the dependence between both regions is asymmetric: whereas a large part of the effect from a shock originated in Interior leaks to Coast, a shock originated in Coast is highly contained within this region, only marginally (less than 10% for output and GVA and less than 15% for employment) escaping to Interior.
Obviously, there are differences between these results and those of Table 4 regarding the relative weight of direct and indirect effects, justified by the different location of the assumed initial shock: in Table 6, the direct effect has a greater relative weight in Coast, while the indirect effect has a superior relative weight in Interior.
5. CONCLUSIONS AND POLICY IMPLICATIONS.
A bi-regional input-output model was established to make explicit the Portuguese regional heterogeneities among Coast and Interior regions as well as the implications of their strong interconnections. The empirical application of this bi-regional model consisted in analyzing the regional impacts (in terms of output, GVA and employment), produced by an exogenous increase in final demand for agri-food products, taking place in the Interior region or in the Coast region. The ultimate goal was to assess the degree in which a local shock would be retained within the region in which it was originated.
In the first scenario considered – initial shock felt in Interior – it became clear that a considerable share (over 40%) of the total effects (considering the sum of direct, indirect and induced effects) leak to the coastal region. Moreover, due to a weak degree of inter-industry connectedness in Interior, and a high external dependence on Coast’s supplies, a great part of the total effects correspond to direct effects, being indirect effects mainly felt in Coast. As a consequence, most affected industries in Interior are: agriculture and those which produce the disturbed products as primary production, whereas the coastal region receives a high impact in energy and several services supplies to firms (besides agriculture, as well).
A second scenario was established in order to evaluate the potential impact of an identical final demand increase, except being now directed towards the Coast region. Results
demonstrated that the location of the initial shock matters. On the one hand, the national effect is larger when initial impact occurs in Interior. Yet, the difference is more relevant in terms of employment impact, which must be carefully understood: a large employment effect is probably due to lower labor productivity levels in Interior region. On the other hand, it is evident that the dependence between both regions is asymmetric: whereas a large part of the effects of a shock that hits the Interior Region tend to leak to the Coastal Region, an exogenous event in the Coastal Region tends to see its effects contained within the region.
This analysis can be specifically relevant to policy-makers in dealing with regional economic policy. Regarding the agri-food industry in particular, it was demonstrated that its potential impact on the national economy is higher if the positive (or negative) shock occurs in the Interior region. Nevertheless, the impact felt in Interior is only about 50% to 60% of the national effect – this must be taken into account in any action destined to promote final demand for agri-food products in Interior region. Still, impact in Interior is substantially higher whenever the initial shock occurs in this region than when it is originated in Coast – spillover effects are much smaller from Coast to Interior than the other way round.
The present research was focused on the potential impact of one specific sector. However, the bi-regional input-output model applied here can be used to estimate impacts from changes occurring in any other industries, or in the whole economy. One of the future developments of this research consists in analysing the potential role of other industries that have a significant presence in Portuguese economy and/or in regional development strategy.
ACKNOWLEDGEMENTS
The authors are indebted to Ana Pimentel and João-Pedro Ferreira for their valuable help with data collection and management. This work has been framed under the Energy for Sustainability Initiative of the University of Coimbra and supported by FCT through the MIT-Portugal Program and the project grant DEMOSPIN, as well as by the R&D Project
EMSURE - Energy and Mobility for Sustainable Regions
(CENTRO-07-0224-FEDER-002004). Responsibility for any remaining errors or omissions is ours alone.
BIBLIOGRAPHY
Barata, E., Cruz, L., Sargento, A., Ramos, P. and Ferreira, J.-P. (2011) “Deriving Regional Input-Output Matrices to Assess Impacts in Small Portuguese Peripheral Regions”, in Cámara, A., Cardenete, M., Medina, A. e Monrobel, J. (eds.), Sectores estratégicos para un nuevo modelo económico, IV Jornadas Españolas de Análisis Input-Output, Universidad Rey Juan Carlos, Madrid.
Eding, G., Oosterhaven, J., de Vet, B. and Nijmeijer, H. (1997) “Constructing Regional Supply and Use Tables: Dutch Experiences” in Hewings, G., Sonis, M., Madden, M. e Kimura, Y. (eds.) Understanding and Interpreting Economic Structure, Springer Verlag, Berlin, pp. 237-262.
Hulu, E. and Hewings, G. (1993) “The Development and Use of Inter-regional Input-Output Models for Indonesia under Conditions of Limited Information” Review of Regional Development Studies, 5, pp. 135-153.
Lahr, M. (1993) “A Review of the Literature Supporting the Hybrid Approach to Constructing Regional Input-Output Models” Economic Systems Research, 5, pp. 277-293.
Miller, R. and Blair, P. (2009) Input-Output Analysis – Foundations and Extensions, 2nd Edition, Cambridge University Press, Cambridge, UK.
Pereira, X., Carrascal, A. and Fernández, M. (2011) “Impacto Económico do Turismo Receptor através de Modelos Origem-Destino: Uma Aplicação para a Galiza” in Haddad, E., Ramos, P. e Castro, E. (coord.) Modelos Operacionais de Economia Regional, Princípia Editora, Cascais.
Ramos, P., Barata, E. and Pimentel, A. (2013) "Um Modelo Input-Output Bi-Regional Litoral-Interior para Portugal: metodologia de construção e alguns resultados sobre a estimativa de comércio inter-regional", in Santos, J., St-Aubyn, M., Lopes, J. and Santos, S. (coord.), Livro de Homenagem a João Ferreira do Amaral, Almedina, Coimbra (forthcoming).
Ramos, P. and Sargento, A. (2011) “Modelos Regionais de Input-Output” in Costa, J., Dentinho, T. e Nijkamp, P. (coord.) Compêndio de Economia Regional, Vol. II, Princípia Editora, Cascais.
Robinson, H. and Miller, J. (1988) “Cross-Hauling and Nonsurvey Input-Output Models: Some Lessons from Small Area Timber Economies”, Environment and Planning A, 20, pp. 1523-1530.
Sargento, A., Ramos, P. and Hewings, G. (2011) “Input-Output Modeling based on Total-Use Rectangular Tables: Is this a Better Way? ” Notas Económicas, 34, pp. 8-34.
Schwarm, W., Jackson, R. and Okuyama, Y. (2006) “An Evaluation of Method for Constructing Commodity by Industry Flow Matrices” The Journal of Regional Analysis and Policy, 36 (1), pp. 84-93.