AR
TIGO
AR
TICLE
1 Faculdade de Ciências Médicas, Universidade Estadual de Campinas. R. Tessália Vieira de Camargo, Cidade Universitária. 13083-887 Campinas SP Brasil. eneida@fcm.unicamp.br
Improving patient care trajectories: an innovative
quasi-experimental research method for health services
Melhoria da linha de cuidado do paciente: um método de pesquisa
quase-experimental inovador para serviços de saúde
Resumo O uso de escores preditores ganhou merecido espaço nas práticas de saúde. Todavia, quando usados para alcançar a excelência do cui-dado, os escores devem levar em conta também aspectos organizacionais e sociais. O objetivo deste artigo é criar escores para obter variáveis-chaves e sua aplicação na gestão do cuidado de uma deter-minada doença. Apresentamos um método cha-mado Planejamento Epidemiológico de Linha de Cuidado (PELC) e sua aplicação em pesquisa com pacientes HIV pediátricos. Este estudo de caso é apresentado por meio de dois estudos. O primeiro, sobre o desenvolvimento do método PELC. O se-gundo é um estudo de caso-controle em pacientes pediátricos com HIV, realizado com base no mé-todo PELC. A pesquisa HIV Pediátrico – primeira aplicação do método PELC – encontrou 4 variá-veis chaves para o grau de qualidade da trajetoria de cuidado do paciente: aderência ao antirretro-viral; ter pelo menos uma consulta no otorrino-laringologista; ter pelo menos uma consulta com assistente social; e ter faltado uma ou mais vezes a consulta de rotina. Acreditamos que o PELC pode ser aplicado em qualquer tipo de linha de cuida-do, contribuindo para avanços na qualidade dos serviços de saúde, com ênfase na segurança do
pa-ciente e na equidade.
Palavras-chave Pesquisa sobre serviço de saúde, Diretrizes para o planejamento em saúde, Melho-ria da qualidade, Lista de verificação
Abstract Scores to predict treatment outcomes have earned a well-deserved place in healthcare practice. However, when used to help achieve excellence in the care of a given disease, scores should also take into account organizational and social aspects. This article aims to create scores to obtain key variables and its application in the management of care of a given disease. We pres-ent a method called Epidemiological Planning for Patient Care Trajectory (PELC) and its applica-tion in a research of HIV pediatric patients. This case study is presented by means of two studies. The first study deals with the development of the method PELC. The second is HIV Pediatric case-control study based on PELC method. HIV pediatric research - the first practical PELC appli-cation - found these four key variables to the indi-vidual quality level care trajectories: adherence to ART, attending at least one appointment with the otolaryngologist, attending at least one appoint-ment with social services, and having missed one or more routine appointments. We believe PELC method can be used in researches about any kind of care trajectories, contributing to quality level advancements in health services, with emphasis
on patient safety and equity in healthcare.
Key words Health services research, Health plan-ning guidelines, Quality improvement, Checklist
Eneida Rached Campos 1
C
amp
os ER
Introduction
Health services, based on the disease care guide-lines, provide clinical, organizational and social actions to deliver healthcare to each patient, striving to ensure access, resolution, complete-ness and rational use of resources.
A core value of an individual care trajectory is to heal without faults such as errors or noncon-formities in daily practice, delays in patient flow, lack of resources, and low patient adherence. These and other faults may cause health harms
and death1,2.
One of the vital issues for improving the indi-vidual care trajectory is the establishment of new systems that would measure and close existing
gaps3,4. We have not found in the literature any
methodology to create such systems, which, in addition to clinical factors, also contemplates or-ganizational and social factors often included in the care guidelines of many diseases such as HIV, cancer and others.
To test and determine the best care trajectory and to ensure its quality, we created the meth-od of Epidemiological Planning for Patient Care Trajectory – PELC (from the original name in Portuguese: Planejamento Epidemiológico de
Linha de Cuidado5,6). This study was approved
by the Research Ethics Committee of the School of Medical Sciences, University of Campinas, SP, Brazil.
The PELC method aimed to develop and im-prove the individual care trajectory.
This paper aimed to present the PELC meth-od and the first research carried out using this method – HIV pediatric research.
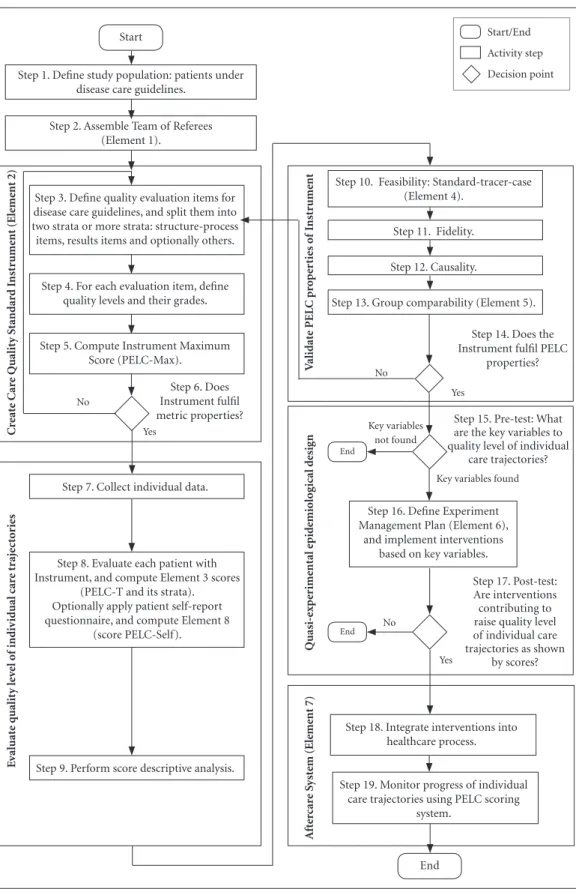
This case study is based on the PELC meth-od (first study) and its first application (second study). The first study deals with the develop-ment of the PELC method – presents a procedure to plan and carry out a PELC research (Figure 1) and steps of the procedure were illustrated using the HIV pediatric research. The second study presents the HIV pediatric research.
PELC research method
The theoretical study that created PELC was centered on the establishment of links between
quasi-experimental studies7-9 and managerial
is-sues10.
PELC researches are designed to answer three questions on the quality of the individual care trajectory: (1) What are the key variables to the quality level?; (2) Are the interventions
contrib-uting to raise the quality level?; and (3) How will we know when we have reached the established quality goal?
It is also possible to perform a research to answer only the first question, in which case the research is no longer interventionist, but just ob-servational, as our HIV pediatric research.
PELC elements
PELC has the following eight elements: (1) team of referees, (2) care quality standard in-strument, (3) PELC scores, (4) standard-trac-er-case, (5) group comparabitity, (6) experiment management plan, (7) aftercare system, and (8) self-reported health (PELC-self score).
A research based on PELC can be performed in one or two phases. The first phase – pretest – performs observational epidemiological studies to investigate organizational, social, and clinical factors associated with outcomes based on PELC scores. In the second phase – posttest, these fac-tors are the basis to formulate intervention hy-potheses that will be tested.
The first phase has five elements: team of referees, care quality standard instrument, PELC scores, standard-tracer-case, group comparabiti-ty. The second phase adds two elements: exper-iment management plan and aftercare system. The self-reported health element is optional score and may be used in both parts.
Design of a research based on PELC method
Because an experimental design would not be feasible to investigate individual care trajectory, a quasi-experimental approach was chosen to be used in a PELC research. Since quasi-experimen-tal studies have important limitations, the
read-er may wish to refread-er to the litread-erature8 for further
discussion.
PELC elements come up in different steps of the procedure (Figure 1) that describes a PELC research.
For the study population (Figure 1, step 1), patients are selected according to inclusion and exclusion criteria.
aúd
e C
ole
tiv
a,
23(5):1459-1470,
2018
Figure 1. PELC* research steps and elements
* PELC - Method of Epidemiological Planning for Care Trajectory Improvement Start
Step 6. Does Instrument fulfil metric properties? Step 1. Define study population: patients under
disease care guidelines.
Step 2. Assemble Team of Referees (Element 1).
Step 3. Define quality evaluation items for disease care guidelines, and split them into two strata or more strata: structure-process items, results items and optionally others.
Step 8. Evaluate each patient with Instrument, and compute Element 3 scores
(PELC-T and its strata). Optionally apply patient self-report questionnaire, and compute Element 8
(score PELC-Self). Step 4. For each evaluation item, define
quality levels and their grades.
Step 5. Compute Instrument Maximum Score (PELC-Max).
Step 7. Collect individual data.
Step 9. Perform score descriptive analysis.
Step 13. Group comparability (Element 5). Step 12. Causality.
Step 11. Fidelity.
Step 10. Feasibility: Standard-tracer-case (Element 4).
Start/End
Activity step
Decision point
End End
No
No
No Yes
Yes
Yes Step 16. Define Experiment Management Plan (Element 6),
and implement interventions based on key variables.
Step 18. Integrate interventions into healthcare process.
Step 19. Monitor progress of individual care trajectories using PELC scoring
system. End
Key variables not found
Key variables found Step 14. Does the Instrument fulfil PELC
properties?
Step 15. Pre-test: What are the key variables to quality level of individual
care trajectories?
Step 17. Post-test: Are interventions contributing to raise quality level of individual care trajectories as shown
by scores?
A
ft
er
car
e S
yst
em (Ele
me
nt 7)
Quasi-exp
er
ime
ntal e
pid
emiolo
g
ical d
esig
n
V
alidat
e PEL
C pr
o
p
er
ties o
f I
nst
rume
nt
C
re
at
e C
ar
e Qualit
y S
tandar
d I
nst
rume
nt (Ele
me
nt 2)
E
v
al
uat
e q
ualit
y le
ve
l o
f indi
v
id
ual car
e t
raje
ct
o
C
amp
os ER
Care quality standard instrument
The way we found to implement quality man-agement in individual care trajectories is to ask the team of referees to select a manageable set of evaluation items. We called this set the ‘care quali-ty standard’. It formalizes the qualiquali-ty goal referred in the third question of PELC researches. The con-struction of the care quality standard draws upon five sources: treatment of the quasi-experimental
study8, quality improvement10, technology11, the
WHO World Alliance for Patient Safety12, and
Donabedian’s triad structure-process-results13.
Each evaluation item must be relevant, ob-servable and numerically measurable. There must be at least two strata of evaluation items (Figure 1, step 3): structure-process items (re-sources and actions) on one hand and results items (therapeutic success) on the other one.
For each evaluation item, the team of referees establishes criteria defining different numerical grades, which represent how well the require-ment has been fulfilled (Figure 1, step 4). Thus, a minor item may be given grades from 0 to 1, and a major one, from 0 to 17. The maximum score (PELC-Max) is the sum of the highest possible grades of all evaluation items (Figure 1, step 5), representing the maximum possible quality level of a patient trajectory in the research.
As an evaluation instrument, the care quality standard instrument must have its metric prop-erties verified by validity and reliability tests such as content validity, construct validity, criterion validity, etc. (Figure 1, step 6). The reader can
re-fer to the literature for details14. In addition, the
care quality standard instrument must have all four PELC properties verified: feasibility, fideli-ty, causalifideli-ty, and group comparability (Figure 1 steps 10-14 described below). If the instrument fails any validation test, it must be reviewed by the team of referees (Figure 1, step 14).
Each PELC research either creates its own care quality standard instrument or uses one in-strument created by a previous PELC research.
The care quality standard instrument con-sists in a sheet, similar to a questionnaire or a
checklist3, to be filled out by a data collector of
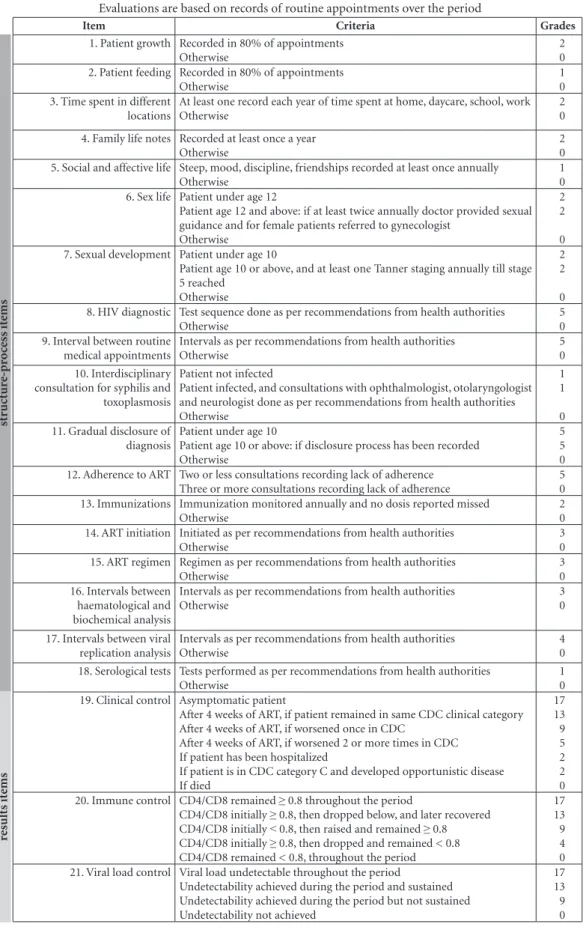
the research team for each patient of the study population. A simplified version of the instru-ment of the HIV pediatric research is shown in Figure 2. This instrument is a practical means to measure how well the care actually received by an individual patient approximates the care quality standard established for the study. It attempts to encapsulate, to the extent possible, the whole
situation of a patient into a single number: the individual’s care trajectory score. The individual patient score is the total of grades.
Evaluation of the patient care trajectory (PELC-T score)
The evaluation of the patient care trajectory is illustrated on Figure 1 steps 7 - 9.
The data sources may be medical records, hospital information systems, or others (Figure 1, step 7). Data are collected from patient care trajectories over a predetermined period of in-vestigation. For example, in the HIV pediatric research, we retrospectively evaluated 2 years of individual care trajectories.
Each patient care trajectory is measured by the care quality standard instrument. The sum of grades of all evaluation items is his/her care trajectory score, or PELC-T score (Figure 1, step 8). It can vary from zero to PELC-Max (Table 1). The letter T stands for total, as a reminder that the PELC-T score can be divided into two or more partial scores, according to strata, as de-fined by the researcher. In this presentation of the PELC method, we assume a simple score com-posed of two strata: one representing the individ-ual structure-process conformity degree (PELC-SP), and the other representing the individual result conformity degree (PELC-Res).
After calculating PELC-T and its components PELC-SP and PELC-Res for all patients a de-scriptive analysis is performed (Figure 1, step 9).
Validate PELC properties of instrument
After computing care trajectory scores for all individuals, the care quality standard treatment instrument is validated with regard to all four PELC properties (Figure 1, steps 10-14). Each validation is described below.
Feasibility – Aiming to make sure that the
aúd
e C
ole
tiv
a,
23(5):1459-1470,
2018
Figure 2. HIV Pediatric Care Quality Standard Instrument: items and grades*.
* This is a simplified version of the Care Quality Standard Instrument of the HIV Pediatric Research. A real instrument requires more detailed criteria for assigning grades.
Evaluations are based on records of routine appointments over the period
Item Criteria Grades
1. Patient growth Recorded in 80% of appointments Otherwise
2 0 2. Patient feeding Recorded in 80% of appointments
Otherwise
1 0 3. Time spent in different
locations
At least one record each year of time spent at home, daycare, school, work Otherwise
2 0 4. Family life notes Recorded at least once a year
Otherwise
2 0 5. Social and affective life Steep, mood, discipline, friendships recorded at least once annually
Otherwise
1 0 6. Sex life Patient under age 12
Patient age 12 and above: if at least twice annually doctor provided sexual guidance and for female patients referred to gynecologist
Otherwise
2 2 0 7. Sexual development Patient under age 10
Patient age 10 or above, and at least one Tanner staging annually till stage 5 reached
Otherwise
2 2 0 8. HIV diagnostic Test sequence done as per recommendations from health authorities
Otherwise
5 0 9. Interval between routine
medical appointments
Intervals as per recommendations from health authorities Otherwise
5 0 10. Interdisciplinary
consultation for syphilis and toxoplasmosis
Patient not infected
Patient infected, and consultations with ophthalmologist, otolaryngologist and neurologist done as per recommendations from health authorities Otherwise
1 1 0 11. Gradual disclosure of
diagnosis
Patient under age 10
Patient age 10 or above: if disclosure process has been recorded Otherwise
5 5 0 12. Adherence to ART Two or less consultations recording lack of adherence
Three or more consultations recording lack of adherence
5 0 13. Immunizations Immunization monitored annually and no dosis reported missed
Otherwise
2 0 14. ART initiation Initiated as per recommendations from health authorities
Otherwise
3 0 15. ART regimen Regimen as per recommendations from health authorities
Otherwise
3 0 16. Intervals between
haematological and biochemical analysis
Intervals as per recommendations from health authorities Otherwise
3 0 17. Intervals between viral
replication analysis
Intervals as per recommendations from health authorities Otherwise
4 0 18. Serological tests Tests performed as per recommendations from health authorities
Otherwise
1 0 19. Clinical control Asymptomatic patient
After 4 weeks of ART, if patient remained in same CDC clinical category After 4 weeks of ART, if worsened once in CDC
After 4 weeks of ART, if worsened 2 or more times in CDC If patient has been hospitalized
If patient is in CDC category C and developed opportunistic disease If died
17 13 9 5 2 2 0 20. Immune control CD4/CD8 remained ≥ 0.8 throughout the period
CD4/CD8 initially ≥ 0.8, then dropped below, and later recovered CD4/CD8 initially < 0.8, then raised and remained ≥ 0.8 CD4/CD8 initially ≥ 0.8, then dropped and remained < 0.8 CD4/CD8 remained < 0.8, throughout the period
17 13 9 4 0 21. Viral load control Viral load undetectable throughout the period
Undetectability achieved during the period and sustained Undetectability achieved during the period but not sustained Undetectability not achieved
17 13 9 0
st
ructur
e-pr
o
cess it
ems
res
ults it
C
amp
os ER
Fidelity -Physicians must feel that scores
ef-fectively reflect the quality level of the care expe-rienced by patients. During validation, individu-al scores are shown to the doctor in charge, who gives a yes/no answer as to whether he/she agrees with the evaluation. If doctors agree in 80% or more of the cases, this property is considered val-idated (Figure 1, step 11).
Causality - Evaluation items representing
quality of results (outcomes), such as years of survival, should be correlated to (be a conse-quence of) items representing quality of struc-ture-process, such as adherence to the prescribed treatment (Figure 1, step 12). This can be ascer-tained by an odds table where exposure (research and actions) is encapsulated in PELC-SP score and outcomes (therapeutic results) in PELC-Res score. Based on a descriptive analysis of each of these scores, cutoff points can be defined to split patients into the four groups of the odds table (Table 2).
Group comparability - A PELC research needs to determine outcomes (PELC scores)
and then classify patients into a control group (desired outcome) and a case group (undesired outcome) for epidemiological studies (Figure 1, step 13). Many outcomes of interest could be defined; however, three of them are possible in any research: PELC-T, PELC-Res and PELC-Self (Figure 1, step 8). The definition of cutoff points for PELC scores splits patients into two groups to be compared. The cuttoff points can be set arbi-trarily by the team of referees or by using an ac-curate statistical tool like the ROC curve (receiver operating characteristic).
The PELC-Self score is an optional outcome. It is the degree of health as self-reported by the patient in questionnaires, such as WHOQOL,
SF-3615, using cross-sectional studies. The PELC-Self
score is used in the PELC element called self-re-ported health, which studies the relationship be-tween a patient perception of care (PELC-Self) and measures of quality level such as PELC-T and PELC-Res. This element is proposed because the quality of life as perceived by the patient is a measure to evaluate treatment outcome.
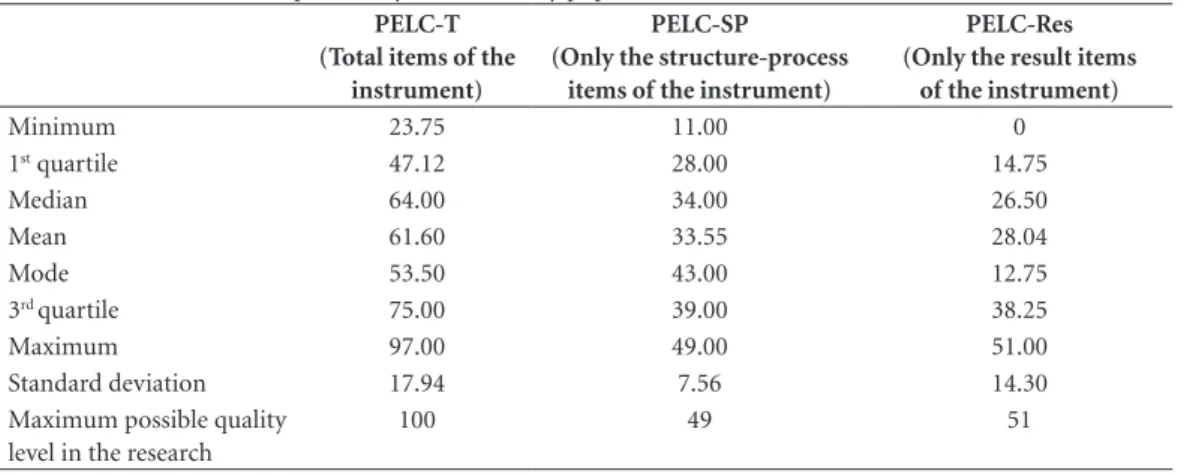
Table 1. Scores PELC descriptive analysis of the study population.
PELC-T (Total items of the
instrument)
PELC-SP
(Only the structure-process items of the instrument)
PELC-Res (Only the result items
of the instrument)
Minimum 23.75 11.00 0
1st quartile 47.12 28.00 14.75
Median 64.00 34.00 26.50
Mean 61.60 33.55 28.04
Mode 53.50 43.00 12.75
3rd quartile 75.00 39.00 38.25
Maximum 97.00 49.00 51.00
Standard deviation 17.94 7.56 14.30
Maximum possible quality level in the research
100 49 51
Table 2. Conformity degree of individual HIV pediatric care trajectories: association of exposure
(structure-process score – PELC-SP) and outcomes (results score – PELC-Res).
PELC-SP
Cases Controls
Total
OR IC 95% p
PELC-Res < 20 PELC-Res ≥ 20
n = 54 % n = 112 % n = 166 %
< 30 26 48.15 29 25.89 55 33.13 2.66 1.3 – 5.3 0.0049
aúd
e C
ole
tiv
a,
23(5):1459-1470,
2018
After the instrument meet all PELC validation test (Figure 1, step 14) quasi-experimental epide-miological studies are performed (Figure 1 steps 15-17).
Quasi-experimental epidemiological design
A PELC research is performed in two phases: pretest and posttest. The period between the two phases should be long enough to allow interven-tions to produce their expected effects on indi-vidual care trajectories. Crossover is also possible in PELC.
Differently from most researches, the PELC method does not require a hypothesis at the be-ginning. The method pretest phase, which is ob-servational and aims to find epidemiological ev-idences that help the formulation of hypotheses – interventions to improve the patient care tra-jectory; the posttest phase, which is intervention-ist and tests the interventions on the assintervention-istance course, will confirm or refute the hypothesis.
Pretest phase
In the pretest phase (Figure 1, step 15), the question to be answered is the first of the three PELC questions, which we can now rephrase as “What are the key variables that predict the values of the scores PELC-T, PELC-Res, PELC-Self or additional scores representing other outcomes?”
The pretest phase is explained here by a case-control design with groups. Two or more ep-idemiological studies with a case-control design can be used in the same PELC research. Each of these studies seeks those clinical, social, organiza-tional factors most decisive for the outcomes rep-resented by PELC scores. The second topic – HIV Pediatric Research – illustrated the pretest phase.
Posttest phase
The posttest phase is performed to answer the second question: “Are the interventions con-tributing to raise the quality level?” Interventions are made, based on the key variables found in the pretest phase, as an attempt to close the gap between the individual care trajectories and the care quality standard.
This set of interventions is what we called the experiment management plan – PELC’s sixth el-ement (Figure 1, step 16). This may involve the introduction of checklists, the establishment of pacts among the involved parties (hospital, doc-tors, and laboratories), educational actions about the care quality standard, nonconformity alert
systems, etc. These are predominantly manage-ment actions, as distinct from clinical actions, hence the name experiment management plan.
Interventions are regarded as a success when individual PELC scores are higher in the posttest than in the pretest (Figure 1, step 17).
Aftercare system
The aftercare system is a nonconformity pre-vention system comprising two elements: (1) Integrating interventions into the healthcare process (Figure 1, step 18), and (2) Monitoring progress of individual care trajectories using the PELC scoring system (Figure 1, step 19). The ef-fective interventions – those shown to result in improvements – are integrated into the health-care process after the end of the PELC research. The aftercare system monitoring is performed to answer the third question, now rephrased as “How will we know when we have reached the goal of the care quality standard?”
Even in cases where for some reason the ex-periment management plan and the aftercare system cannot be implemented, the research still has a value, as it can be regarded an educational intervention that increases awareness of a set of requirements that should be monitored.
HIV Pediatric research
This topic describes the HIV pediatric re-search carried out using the PELC method.
Some factors led us to choose the study popu-lation to be the children and adolescents infected with the HIV virus followed up at a university hospital as first application of the PELC method.
There are recommendations for pediatric HIV care published by the Brazilian Health
Min-istry (MOH-HIV guidelines16). In the
Depart-ment of Pediatrics of the university hospital, a team of professors coordinates care and some of them collaborate in the preparation of recom-mendations. In addition, health professionals of the department have bond with the child and family, with a small loss of follow-up.
Advances in AIDS prevention and treatment
in Brazil are admirable17. However, important
is-sues remain to be resolved, especially concerning social, operational and regional inequalities in coverage and quality of care, and epidemiological surveillance in different regions of the country. Recent studies identified barriers to successful assistance and the impacts of culturally
C
amp
os ER
Objectives of HIV pediatric research
The objectives of the HIV pediatric research were to create an instrument to measure the quality of each patient care trajectory, aiming to identify clinical, social and organizational factors associated with the degree of quality, and then to plan future interventions based on these key fac-tors to reach better outcomes for patients.
Methods and patients
Based on the pretest phase of the PELC meth-od, an observational and analytical case-control study was started in July 2010 in a cohort of HIV pediatric patients from a single center.
The study population had 181 patients fol-lowed up at the Pediatric Immunodeficiency Service of the University of Campinas Teaching Hospital (SIP-HC-Unicamp), the specialized care service for children and adolescents infected with HIV in the Campinas region, with approximately 6 million inhabitants (Southeastern Brazil).
The study comprised 166 patients. The pa-tient care trajectory was investigated in a defined period, according to the following criteria: be followed during the period defined, going back no more than three years from 31/08/2010, and this period was equal or greater than six months. The patient had to be diagnosed with HIV infec-tion proved by laboratory tests. The patient had to be followed using the routine care service. The study excluded 15 patients: four for participating in clinical studies (for having a different routine care service); five for having evaluation period less than six months and six for not having at-tended in the period defined.
The survey data were collected from medical records, hospital information system, notifiable diseases information system, the logistics man-agement system of medicines and the depart-mental basis of SIP-HC-Unicamp.
The following five elements of the PELC method were used in the HIV pediatric research: team of referees, care quality standard instru-ment, PELC scores (T, SP, PELC-Res), standard-tracer-case, group comparability.
The team of referees was formed by the pe-diatric specialist and coordinator of the SIP-HC-Unicamp and by the PELC method author – a professional of quality management and epide-miology. The pediatric specialist collaborated in the preparation of MOH-HIV guidelines as an advisory board member. The team of referees de-fined the research variables.
In August 2010, the care quality standard in-strument (Figure 2) was constructed by the team of referees, drawing upon three sources: pediatric care elements, MOH-HIV guidelines, and Don-abedian’s triad structure-process-result.
Based on Donabedian´s triad13, the care
qual-ity standard included 21 highly desirable struc-ture-process-result items to be observed in pa-tient care trajectories. The care quality standard instrument (Figure 1, step 3) was constructed with these 21 items and its simplified version is shown in Figure 2. Among these 21 items, 18 are about structure-process (items 1-18) and 3 items are about therapeutic result (items 19-21). Furthermore, items 1-7 refer to pediatric care el-ements and items 8-21 refer to MOH-HIV guide-lines.
Arbitrarily, for each evaluation item, the team of referees established criteria defining different numerical grades representing how well the re-quirement has been fulfilled (Figure 1, step 4). The sum of maximum weights of each require-ment resulted in the PELC-Max score equal to 100 points – the maximum possible quality level of a patient trajectory in the research (Figure 1, step 5).
Ideally, the care quality standard instrument should be validated by both methods: the tradi-tional validation methods (Figure 1, step 6) and the PELC method (Figure 1, step 10-14). How-ever, the HIV pediatric care quality standard in-strument was validated only for PELC method.
The evaluation period of each patient care trajectory was set in October 2010, lasting ap-proximately two years: mean 2.09 (± 0.25); mini-mum 0.67 and maximini-mum 2.91.
Under the supervision of the pediatric spe-cialist, a single evaluator collected data and calcu-lated the scores of 166 patients. Each patient care trajectory was measured using the care quality standard instrument (Figure 2). Each patient re-ceived a PELC-T score value (Figure 1, step 7- 8). After perform the score descriptive analysis (Table 1), the instrument was validated with re-gard to all four PELC properties (Figure 1, steps 10-14): feasibility, fidelity, causality and group comparability.
Feasibility was validated because there was a standard-tracer-case: one patient received PELC-T score of 97 out of a PELC-Max of 100 points. Fidelity was validated because the pedi-atricians felt that scores effectively reflected the quality level of care experienced by patients.
aúd
e C
ole
tiv
a,
23(5):1459-1470,
2018
sum of grades of structure-process items) and PELC-Res representing the outcomes (the sum of grades of result items). The cutoff points 20 to PELC-Res and 30 to PELC-SP were defined by the team of referees based on the first quartile. Table 2 had been built and these values demon-strated that the structure-process items are in fact correlated to the result items, thus validating the property of causality: there was a 2.66 times higher risk of a patient with PELC-SP <30 - un-satisfactory degree of structure-process items - to achieve PELC-Res <20 – unsatisfactory degree of result items (OR = 2.66; CI95% = 1.35-5.28; p = 0.0049).
The HIV pediatric research defined two outcomes: PELC-T (total items of the instru-ment) and PELC-Res (only the result items of the instrument). Thus, the research carried out two case-control studies: PELC-Res study and PELC-T study. HIV pediatric patients were clas-sified into control group (desired score PELC) and case group (undesired score PELC) for each one of the studies.
In the PELC-T study, the team of referees se-lected PELC-T score as the outcome with a cut-off point equal to 75, based on the third quartile, resulting in a case group of 122 patients and a control group of 44 patients.
In the PELC-Res study, the team of referees selected PELC-Res score as the outcome with a cutoff point equal to 20, based on the first quar-tile, resulting in a case group of 54 patients and a control group of 112.
The instrument fulfilled all the four PELC properties.
The collected data were tabulated in Excel® for Windows version 2007 (Microsoft, Redmond, WA, USA). Statistical analysis was performed with the “R” version 2.12.1. The collected data were adjusted using the logistic regression mod-el, having as outcomes the PELC-Res score in the first case-control and the PELC-T score in the second study. “Odds ratio” (OR) and 95% con-fidence intervals (95% CI) were obtained for the studied factors. P values < 0.05 were considered significant in hypothesis tests.
HIV pediatric research based on case-con-trol epidemiological approaches answered the question (Figure 1, step 15): “What are the key variables that predict the values of PELC-T and PELC-Res scores?” The two case control studies found the four key factors described below.
HIV pediatric research results
The study comprised 166 patient care trajec-tories. The general characteristics of the study population are shown in Table 3.
The results of the quality grade of patient care trajectories based on the instrument were (Table 1): PELC-T score (the maximum possible score PELC-T equal to 100 points) value ranged from
24 ≤ PELC–T ≤ 97, mean 61.60 (± 17.94),
me-dian 64, mode 53.50. The two strata of PELC-T score: PELC-Res score (the maximum possible score PELC-Res equal to 51 points) value ranged
from 0 ≤ PELC–Res ≤ 51, mean 28.04 (± 14.30),
median 26.50, mode 12.75, and PELC-SP score (the maximum possible score PELC-SP equal to
49 points) value ranged from 11 ≤ PELC–SP ≤ 49,
mean 33.55 (± 7.56), median 34, mode 43. The HIV pediatric research found four key variables. The study with PELC-Res as outcome found two key variables: adherence to ART (OR = 0.26; CI95% = 0.09-0.69; p = 0.007), and at-tending at least one appointment with the oto-laryngologist (OR = 3.9; CI95% = 1.27-12.51; p = 0.018). The study having PELC-T as outcome found two additional key variables: attending at least one appointment with social services (OR = 6.36; CI95% = 1.53-44.36; p = 0.024), and having missed one or more routine appointments (OR = 13.01; CI95% = 3.42-86.81; p = 0.001).
Discussion
Our study adds to the existing knowledge the possibility of using pretest and posttest quasi-ex-perimental studies with an innovative method to find key variables associated with the quality level of individual care trajectories. This level is evaluated with a specifically developed care quality standard instrument. The HIV pediatric research proposed a new instrument to measure the degree quality of the HIV pediatric patient care trajectory based on a standard of systemic scope, consisting of clinical, organizational and social factors.
Thus, the PELC-T score of each patient of a cohort contrasts with other scores used for esti-mating the mortality risk and other major end-points in clinical practice, such as the APACHE (acute physiology and chronic health
evalua-tion)18, because, in addition to clinical and
C
amp
os ER
Table 3. Characteristics of the study population.
Characteristic Values
Gender 88(53%) male; 78(47%) female
Age at the beginning of evaluation period 124(75%) < 13 years; 42(25%) ≥ 13 years Social need level # 111(67%) lower;
45(27%) middle; 10(6%) high; CDC£ - clinical staging
at the end of the evaluation period
121(73%) clinical staging N,A,B 45(27%) clinical staging C CDC£ - immunological category
at the end of the evaluation period
29(18%) immunological category 1 67(40%) immunological category 2 70(42%) immunological category 3
Routine appointments during the evaluation period 48(29%) patients missed one or more times 118(71%) did not miss
Number of times of switched antiretroviral therapy (ART) after starting treatment
7(4%) patients were without ART 99(60%) patients switched ART < 5 times 60(36%) patients switched ART ≥ 5 times Adherence to ART: consultations recording lack of
adherence
133(80%) < 3 references 33(20%) ≥ 3 references Coinfection after starting treatment 26(16%) coinfected;
140(84%) not coinfected Number of medical specialties, except pediatrics,
during the evaluation period
144(87%) patients underwent less than 3 medical specialties
22(13%) underwent three or more medical specialties Most required specialties during the evaluation
period, except pediatrics
38(23%) neurology; 36( 22%) ophthalmology, 24(14%) otolaryngology, 22(13%) dermatology 20(12%) cardiology Social worker consultation during the evaluation
period.
26(16%) patients had consultation
140(84%) patients did not have consultation
# Social need level during evaluation period: Patients were classified in “high” level because were references in medical records of: guardian council, law judge, home support services or child institutionalization, suspected of sexual abuse, drugged clinic. Patients were classified in the “middle” level because were references to basic health unit, home visit and nongovernmental organization. Patients were classified in the “lower” level because there was none of the references already cited. £ CDC - clinical staging and immunological classification for HIV infection.
Similarly, the PELC-T score contrasts with systems that perform quality assessment by de-fining a pattern and comparing processes with the pattern, for example, accreditation systems such as the Joint Commission, certifications sys-tems such as ISO (International Organization for Standardization), and national accreditation programme for hospitals (for example DDKM
– Danish Healthcare Quality Programme19)
be-cause the PELC is not restricted to compare the processes with the pattern.
We have observed that seals of quality and their standards mostly attract the attention of health managers and doctors involved in man-agement, whereas professionals working directly in healthcare are drawn to scores representing
clinical and physiological aspects of each patient. Because PELC combines both approaches, it helps integrate these two groups of professionals in the efforts for quality improvement.
We observed that the HIV pediatric care quality standard created and used in this study, as the approach of the PELC method, has potential applicability in the practice of everyday health and high attractiveness for physicians directly attached to the patient. Each patient is assessed individually, with the inclusion of design ele-ments, process and results of clinical, social and organizational predictors of a quality goal (set in the research) to the patient care trajectory.
aúd
e C
ole
tiv
a,
23(5):1459-1470,
2018
with the clinical and social reality of the 166 pa-tients evaluated. Significantly, the fact stands out that one of the patients achieved a PELC T score of 97 points, near the maximum of 100 points, in-dicating the feasibility of the pediatric HIV care quality standard. Additionally, the value of the 3rd quartile PELC T score indicates that over 40 pa-tients showed degree of compliance greater than or equal to 75% of the maximum possible score.
The four epidemiological evidences found-ed in HIV pfound-ediatric research are similar to those
found in the literature20-23.
On key factors to treatment adherence and attendance to consultation in otolaryngology, several authors indicate that poor adherence to antiretroviral therapy is associated with failure in controlling viral replication, immune deteriora-tion, the risk of resistance to antiretroviral agents, thus becoming major challenge to systems geared
to the care of patients with HIV20-22.
In our interpretation, the need for consulta-tion in otolaryngology is a marker of disease se-verity, probably secondary to treatment failure. The prevalence of ENT manifestations in pediat-ric AIDS, particularly upper respiratory tract in-fections, is high, ranging in the literature between 50 and 100%, especially during the period prior to
the availability of therapy22. This challenge is
par-ticularly important in a scenario such as Brazil, where the National STD / AIDS, since its creation in 1986, mobilizes significant resources to ensure free and universal access to preventive measures and to antiretroviral therapy, with significant
im-pact on morbidity and pediatric mortality17.
Fault factors in routine consultations and
so-cial vulnerability are cited by several authors21,23.
Studies in pediatric cohorts suggest that the in-clusion of psychosocial interventions, care gratu-ity, psychotherapy, information and advice and support in relation to the caregiver are associat-ed with better retention in care and adherence to treatment.
We need to repeat the HIV pediatric research in other health services to see whether the same four factors are quality degree predictors. Identi-fying a small number of significant key variables associated with the quality level of individual care trajectories has many advantages, among them reducing monitoring costs of programs for specific diseases, and consequently, spending the available funds more rationally. This helps reduce disparities in the degree of conformity
among different populations, and advances to-wards more equity in healthcare.
The mere act of creating and disseminating the care quality standard instrument among doc-tors, nurses, social assistants and other health professionals already leads to a spontaneous self-assessment of possible omissions or flaws in their current practice. Afterwards, when actual scores of their patients are made available, they are further motivated to improve the quality lev-el of their work. In our HIV pediatric research, many suggestions for interventions arose among them in both these moments.
After the key variables having been identified, doctors use these evidences to decide which inter-ventions should be implemented, and for which groups of patients. Not all interventions need be applied to all patients. Time-consuming actions such as confirming the presence of patients in scheduled appointments, or actions involving additional cost, such as providing transportation for patients, could be implemented only for high risk patients, as indicated by the score.
The PELC method is well aligned with the ap-proach advocated by the WHO, partly inspired in the experience of the aviation industry, which has achieved very high levels of safety through stan-dardization. In particular, PELC addresses the issues of (1) practice standardization; (2) iden-tification of nonconformities, adverse events and near-misses; (3) development and implementa-tion of intervenimplementa-tions to increase quality of care and patient safety; and (4) implementation of a long-term quality level monitoring system.
PELC method is quite unique because, aim-ing to identify key variables and propose inter-ventions for quality level improvement, it scruti-nizes factors in organizational, clinical and social realms by epidemiologic and managerial meth-ods. In fact, the method can be regarded as a new research model on disease care guidelines and the resulting individual care trajectories.
After the HIV pediatric research – the first practical PELC application – we came to believe that PELC can actually be used in any kind of care, both for local and multicentric studies involving centres of technological innovation of universities and governments, provided that all parties agree upon a single care quality standard instrument.
C
amp
os ER
Collaborations
ER Campos, DC Moreira-Filho and MTN Silva worked on the conception, design, analysis, in-terpretation of data and approval of the article version to be published.
References
1. Kohn LT, Corrigan JM, Donaldson MS. To err is human:
building a safer health system. Washington: National
Academy Press; 2000.
2. Horstmann E, Brown J, Islam F, Buck J, Agins BD. Retaining HIV-infected patients in care: where are we? where do we go from here? Clin Infect Dis 2010; 50(5):752-761.
3. Gawande A. The checklist manifesto: how to get things
right. New York: Metropolitan Books; 2009.
4. Chassin MR, Loeb JM, Schmaltz SP, Wachter RM. Accountability measures – using measurement to promote quality improvement. N Engl J Med 2010; 363(7):683-688.
5. Campos ER. Método PELC - Método de planejamento
epidemiológico de linha de cuidado [thesis]. Campinas:
Unicamp; 2011.
6. Campos ER, Moreira-Filho DC, Silva MTN. Epide-miology and Policy: P1-299 - Method PELC: Method of epidemiologic planning for lines of care. J Epidemiol
Community Health 2011; 65(Supl. 1):A149-A150.
7. Ahrens W, Pigeot I. Handbook of epidemiology. Berlin: Springer-Verlaz; 2005.
8. Campbell DT, Stanley JC. Experimental and
quasi-ex-perimental designs for research. Boston: Houghton
Mif-flin Company; 1966.
9. Donabedian A. Evaluating the quality of medical care.
Milbank Q 2005; 83(4):691-729.
10. Langley JG, Moen R, Nolan MK, Nolan TW, Norman CL, Provost LP. The improvement guide: a practical
ap-proach to enhancing organizational performance. San
Francisco: Josey-Bass Publishers; 2009.
11. Brasil. Ministério da Saúde (MS). Diretrizes metodoló-gicas: elaboração de pareceres técnico-científicos. 2ª ed. rev. e ampl. Brasília: MS; 2009. [Série A. Normas e Ma-nuais Técnicos]
12. World Health Organization (WHO). World alliance for patient safety. Research for patient safety: better
knowl-edge for safer care. Geneva: WHO; 2008.
13. Donabedian A. The quality of care: how can it be as-sessed? JAMA 1988; 260(12):1743-1748.
14. Streiner DL, Norman GR. Health measurement scales: a
practical guide to their development and use. New York:
Oxford University Press; 2001.
15. Perkins AJ, Stump TE, Monahan PO, McHorney CA. Assessment of differential item functioning for demo-graphic comparisons in the MOS SF-36 health survey.
Qual Life Res 2006; 15(3):331-348.
16. Brasil. Ministério da Saúde (MS). TARV – Recomen-dações para terapia antirretroviral em crianças e ado-lescentes infectados pelo HIV. Brasília: MS; 2009. [Série Manuais nº 85].
17. Greco DB. The AIDS epidemic: social, scientific and economical impacts and perspectives. Estudos Avança-dos 2008; 22(64):73-94.
18. Knaus WA, Wagner DP, Draper EA, Zimmerman JE, Bergner M, Bastos PG, Sirio CA, Murphy DJ, Lotring T, Damiano A, Harrell Junior FE. The APACHE III prognostic system: risk prediction of hospital mor-tality for critically ill hospitalized adults. Chest 1991; 100(6):1619-1636.
19. Institut for Kvalitet og Akkreditering i S. Den Danske Kvalitetsmodel, Akkrediteringsstandarder for sygehuse, 1. version, 2009
20. Vreeman RC, Wiehe SE, Pearce EC, Nyandiko WM. A systematic review of pediatric adherence to antiretro-viral therapy in low- and middle-income countries.
Pediatr Infect Dis J 2008; 27(8):686-691.
21. Fetzer BC, Mupenda B, Lusiama J, Kitetele F, Golin C, Behets F. Barriers to and facilitators of adherence to pe-diatric antiretroviral therapy in a sub-saharan setting: insights from a qualitative study. AIDS Patient Care STDs 2011; 25(10):611-621.
22. Singh A, Georgalas C, Patel N, Papesch M. ENT presen-tations in children with HIV infection. Clin Otolaryn-gol Allied Sci 2003; 28(3):240-243.
23. Nachega JB, Millsc EJ, Schechterd M. Antiretroviral therapy adherence and retention in care in middle-in-come and low-inmiddle-in-come countries: current status of knowledge and research priorities. Current Opinion in
HIV and AIDS 2010; 5(1):70-77.
Artigo apresentado em 17/09/2015 Aprovado em 20/07/2016
Versão final apresentada em 22/07/2016 This is an Open Access article distributed under the terms of the Creative Commons Attribution License