http://dx.doi.org/10.1590/S1678-9946201860039
1Universidade do Sul de Santa Catarina,
Curso de Medicina, Palhoça, Santa Catarina, Brazil
2Universidade do Sul de Santa Catarina,
Programa de Pós-Graduação em Ciências da Saúde, Palhoça, Santa Catarina, Brazil
Correspondence to: João Ghizzo Filho
Universidade do Sul de Santa Catarina, Curso de Medicina, Cidade Universitária, CEP 88137-270, Palhoça, SC, Brazil Tel: +55 48 99996-9919
E-mail: aquilesjoao.joao@gmail.com
Received: 1 May 2018
Accepted: 7 June 2018
Temporal analysis of the relationship between leptospirosis, rainfall levels and seasonality, Santa Catarina, Brazil,
2005-2015
João Ghizzo Filho1,2, Nazaré Otília Nazário1, Paulo Fontoura Freitas1,
Gustavo de Araújo Pinto1, Aline Daiane Schlindwein2
ABSTRACT
The objective of the study is to analyze the temporal trend of leptospirosis incidence, according to rainfall levels in Santa Catarina, according to seasonality, from 2005 to 2015. This is an ecological study of time series, with date of leptospirosis, rainfall levels and population. The incidence rates of leptospirosis, relative excess of incidence, Pearson’s correlation coefficient (r) and an angular coefficient (β) were analyzed from the linear regression adjustment, with a 5% significance level. Distribution of leptospirosis cases, rainfall levels and cases reason/rainfall levels, stratified by month of occurrence were presented. There were 5,274 cases of leptospirosis, with the monthly average being 439 cases, ranging from 211 in September to 770 in January. The mean rate of leptospirosis was 7.03 per 100,000 habitants. The average rainfall level was 158.68 mm, with the lowest levels occurring in August, average of 124.9 mm, and the highest in January average of 213.20 mm. The positive correlation between leptospirosis rates and rainfall levels, during the period from January to December (r = 0.68, p = 0.023), indicates a positive temporal association between the amount of rainfall and the cases of the disease. The disease occurred all year round and presented a distinct seasonality from October to March.
KEYWORDS: Leptospirosis. Zoonosis. Temporal incidence.
INTRODUCTION
Leptospirosis is a zoonosis of world occurrence, worldwide distribution, with significant social, economic and health impact1. According to the Ministry of
Health (MS), the disease has great social and economic importance due to its high incidence and a significant percentage of hospitalizations, high hospital costs and loss of working days, as well as due to its lethality1,2.
It is also an important public health problem in Brazil, due to the high incidence in populations living in urban agglomerations without adequate sanitary infrastructure and with high rodent infestations3. These factors, associated with the rainy seasons
and floods, induce the leptospirosis spread and persistence in the environment and predispose to contact with contaminated water, which facilitates the occurrence of the disease outbreaks2-4.
Leptospirosis has endemic distribution in the country and becomes epidemic in rainy periods, with occurrence during all months of the year2 and average annual
incidence of the disease of 1,9/100,000 inhabitants per year1. According to the World
1/100,000 inhabitantsperyear, in localities with temperate climates, and from 10 to 100/100,000 inhabitants per year, in tropical climate countries5,6.
In Brazil, between 1996 and 2008, 45,028 cases of leptospirosis were notified and confirmed with the occurrence of 4,653 deaths. During this period, there were outbreaks related to natural disasters of great magnitude, for example, following the floods in the city of Rio de Janeiro in 1996, with 1,790 cases7; in Acre, in 2006, with 460 cases;
and, in Santa Catarina, in 2008, with 953 cases. Although leptospirosis in Brazil is a mandatory notification disease, as determined by the Ministerial Order no 1.461, dated from
19998, leptospirosis is significantly undernotified due to
variation in the clinical presentation, often confused with other endemic diseases6,9,10.
The human being, accidental and terminal host in the transmission chain of leptospirosis, is infected through direct contact with blood, tissues, animals organs, or indirect contact with water of soil contaminated by urine or other fluids of carrier animals11,12. The leptospira reaches
the bloodstream through the mucosa of the mouth, eyes or injured skin, but is able to cross the skin and the intact mucosa1,6,11.
The proliferation of leptospirosis cases and the disease aggravation are associated with the constant flooding of urban areas and houses, as well as the irregular areas occupation, with high occurrence of floods, lack of sanitation and garbage collection, which provides the rodents infestation3,13.
It is considered, therefore, that floods are the main facilitators of leptospirosis dispersion and that its incidence increases when there is greater rainfall3,13,variable in each
region of Brazil. Evidence points to a relationship between the rainfall increase and the increase in the leptospirosis incidence rates3,13.
In addition, the leptospirosis incidence is seasonal, usually with a peak in the summer and fall, in temperate climate countries; and during the rainy seasons, in tropical areas14. After the current climate changes, in both developed
and developing countries, leptospirosis is considered an emerging infectious disease due to the constant waves of natural disasters6,14.
The knowledge regarding the rain regime of a given region is important and contributes to decision-making in various strategic areas, mainly related to human occupation, which involves a lack of basic sanitation, large urban centers, high demographic density and needy communities. These favorable environmental conditions contribute to the increasing incidence of waterborne epidemics, with emphasis to leptospirosis8,15. It is important to study this
weather variable, which allows the prevention of several
disorders caused by rain and enables preventive actions planning, thereby reducing the morbidity caused by leptospirosis15,16.
The objective of this study was to analyze the leptospirosis behavior in accordance with the rainfall and the disease temporal evolution in the State of Santa Catarina, according to the seasonality in the period from 2005 to 2015.
MATERIAL AND METHODS
An ecological study was conducted by means of time-series analysis, based on data from patients’ notifications with leptospirosis in Santa Catarina State, in the period from 2005 to 2015.
The State, located in the Southern region of Brazil has 295 municipalities, with a territorial extension of 95,737,895 square kilometers, with inclusion of internal waters. The population is 6,819,190 inhabitants, representing 3.3% of the Brazilian population, according to data from the Brazilian Institute of Geography and Statistics (IBGE), to 201517. The majority of Santa Catarina’s population
lives in urban areas (84%), the population density is 65.27 inhabitants per square kilometer and the demographic growth is 1.6% per year17.
The Santa Catarina State territory is characterized by humid subtropical climate with hot summers, and also humid subtropical climate with mild summers17-19. Thus,
there is a variation of monthly rainfall in Santa Catarina State, the highest values occurring in the region of the North coast, between the months from October to March; and in a lesser extent on the South coast18. In the months from April
to September, higher rainfalls in the Western region of the State were observed18.
The outcome variable is represented by the number of monthly cases of leptospirosis, grouped into each of the specific months (January to December), for the period (2005-2015). The monthly cumulative incidence of leptospirosis for the State as a whole were calculated for each group of months, in the period, having as a numerator the sum of cases in each of the twelve monthly groups, divided by the population in the middle of the studied period (2010), calculated for 100,000 inhabitants. Adjustment for potential variations in the age structure and sex, upon comparing different periods, used the method of direct rates standardization, taking as a reference the population to the State of Santa Catarina in the year 2010. The number of cases of leptospirosis are presented, its monthly average and the rate of the disease in the period studied. It was chosen to present the non-standardized rates, whenever a significant correlation (r >0.90) was found when comparing the crude and standardized rates, thus retaining the original value of the rates, considered as more representative and interpretable.
During an initial exploratory phase of analysis, using the graphical display of the monthly trends throughout the year, we sought to detect the existence of distinct seasonal periods, taking as a reference the associations with rainfall rates, observed from month to month. At this stage of the analysis, the monthly evolution of the cases of leptospirosis, rainfall levels and the ratio of cases per unit of rainfall from January to December was calculated and displayed graphically, in search of seasonal patterns. The monthly variations of the cases of leptospirosis and rainfall levels over the period are shown graphically, correlations were calculated and presented (r) between rainfall and ratio of cases resulted by rainfall, in accordance with the leptospirosis rates.
The existence of variability patterns in the relationship between the amount of rain and new cases of detected leptospirosis, represented by two distinct seasonal periods, led to the exploitation of the stratified data by seasonal periods. Thus, the investigation of associations between exposure (rain) and outcome (leptospirosis) in the present analysis, in addition to the monthly evolution in the period as a whole, had as its central focus the existence of two distinct seasons (April to September and October to March).
First, the following parameters were presented: leptospirosis distribution cases, the rainfall indexes, the proportional contribution of leptospirosis cases, the proportional contribution of rainfall and the ratio of leptospirosis cases by rainfall index for the State of Santa Catarina, in the period of 2005-2015, stratified by month of occurrence. Having as objective to estimate the relative
excess in the incidence of diagnosis, to compare the different months in the period, ratios were calculated among monthly leptospirosis rates, taking as a reference the month with the lowest rate in the period (month of August). The probability of leptospirosis occurrence when comparing each of the months with that of reference is represented by the relative risk (RR). The same calculations were then performed and are stratified according to the two seasonality patterns (April to September and October to March).
Linear regression analysis of the association among leptospirosis cases and variations in rainfall levels was conducted for the period and the population as a whole, in accordance with the monthly seasonal period.
In the investigation of the temporal evolution in the monthly occurrence of leptospirosis, the monthly incidence rates of the disease represent the dependent variable, i.e., the outcome (y); and, the months in the studied period the independent variable (x). Thus, in the proposed model, monthly variations in the leptospirosis rates are supplied by the angular coefficient (beta), from the adjustment of linear regression, having as the dependent variable the months in the calendar year. The trend analysis applied the method of Prais-Winsten generalized linear regression (Gaynor and Kirkpatrick20), in which the regression parameters are
corrected for first-order self-correction. This technique allowed to estimate the Monthly Percentage Variations (MPV) as well as tendencies of decrease or stability in the rates represented by the angular regression coefficient.
Regarding the trends interpretation, in addition to the calculation of the beta coefficient (b) that estimates the increase in the units of outcome (cases/100,000) for each change in the unit of time (month), it was also used for the MPV rate estimate by adjusting the points of temporal series through the logarithmic transformation of the Y values i.e., it measures the straight monthly inclination that crosses the logarithm of each rate, providing additional benefits in the linear regression by the reduction in the heterogeneity of the residues variance from the regression obtained by the formula: MPV = [-1+10b1]*100%.
For each seasonal period, in addition to the leptospirosis rates, the magnitude of associations among months of occurrence and leptospirosis rate is presented, corresponding to the coefficient of correlation (r) and the proportion of variation in the disease occurrence, which can be explained by the independent variable (R2).
This study was based on ethical principles of Resolution 466/12 of the National Health Council, having been approved by the Institutional Ethics Comission under CAAE Nº 60174117.0.0000.5369.
RESULTS
In the period from 2005 to 2015, there were 5,274 cases of leptospirosis in the State of Santa Catarina, with monthly average in the period of 439 cases, with a variation of 211 cases, in the months of August, 770 cases in the months of January. The average rate of leptospirosis in the period studied (2005-2015) was 7.03 cases per 100,000 inhabitants. The average rainfall for the period was 158.68 mm, the lowest indices were detected in the months of August, with an average of 124.91 mm, while the highest occurred in the months of January, with an average of 213.20 mm.
Table 1 presents the monthly variation of leptospirosis rates, the rainfall indexes and the ratio between cases of leptospirosis and rainfall in the months from January to December, for the period studied (2005-2015). The leptospirosis rates reached their highest values in the months from December to March, with a reduction between April and August, returning to elevate, linearly, from the months of September and October, and returning to the highest levels in December. The rainfall indexes were higher in the months of leptospirosis peak rates (December to March), when compared to the remaining months of the period.
A variability pattern in rainfall volume and occurrence of leptospirosis cases defines two seasonal periods. The
lowest average rainfall (140.95 mm/month) and a lower number of diagnosed cases (1,620) were evidenced from April to September. From October to March, a higher average rainfall (176.41 mm/month) was detected as well as a higher number of leptospirosis cases (3,654). When comparing the two seasonal periods, the leptospirosis rates ranged, negatively, from 6.07 to 4.56/100,000, from April to September (24.9%), and positively, from 4.71 to 11.84 thousand, from October to March (an increase of 151.3%). The months of January totaled the highest number of leptospirosis cases (n=770) and the highest average in the monthly rainfall rates (213.20 mm), representing the largest proportional contribution in the number of leptospirosis cases (14.6%) and the highest average contributions in the rain volume (11.20%). The months of January and February accounted for almost 30% of the cases and 20% of rainfall in the period studied. Still, the highest differences concerning the incidence rates, comparing all the months, taking as reference the values of the month with the lowest rates (August), showed an incidence of leptospirosis to more than triple (RR>3.0; p<0.001) in the period from December to March. In the same way, December to March showed the highest ratio of leptospirosis cases generated for an average amount of rain, with approximately twice the ratio cases/precipitation index for any one of these months compared to the remainder months of the period. An average elevation was detected in leptospirosis cases from October until March, followed by a decline, from April on, corresponding to a period of decline until the beginning of August.
Table 1 - Monthly distribution of leptospirosis cases in accordance with the rainfall indices. Santa Catarina, Brazil, 2005-2015
Months Leptospirosis Cases rainfall indices
n (%) Rate RR (IC95%) Average (mm) (%) C/IP
January 770 (14.60) 12.32 3.65 (3.14-4.26) 213.20 (11.20) 3.61
February 737 (13.97) 11.79 3.49 (3.01-4.08) 167.18 (8.78) 4.41
March 740 (14.03) 11.84 3.50 (3.01-4.09) 160.68 (8.44) 4.61
April 379 (7.19) 6.07 1.80 (1.52-2.13) 130.86 (6.87) 2.90
May 265 (5.02) 4.24 1.25 (1.05-1.51) 130.57 (6.86) 2.03
June 268 (5.08) 4.29 1.27 (1.06-1.52) 137.81 (7.24) 1.94
July 212 (4.02) 3.39 1.01 (0.83-1.22) 133.58 (7.01) 1.59
August 211 (4.00) 3.38 1.00 124.91 (6.56) 1.69
September 285 (5.40) 4.56 1.35 (1.13-1.62) 188.02 (9.87) 1.52
October 294 (5.57) 4.71 1.39 (1.17-1.66) 189.77 (9.97) 1.55
November 373 (7.07) 5.97 1.77 (1.49-2.09) 160.66 (8.44) 2.32
December 740 (14.03) 11.84 3.50 (3.01-4.09) 167.02 (8.77) 4.43
The relationship between the average monthly variation in the number of cases and the rainfall indexes along the months can be identified in Figure 1. These results allowed to identify and use the stratification proposed of the seasonal periods for further analysis.
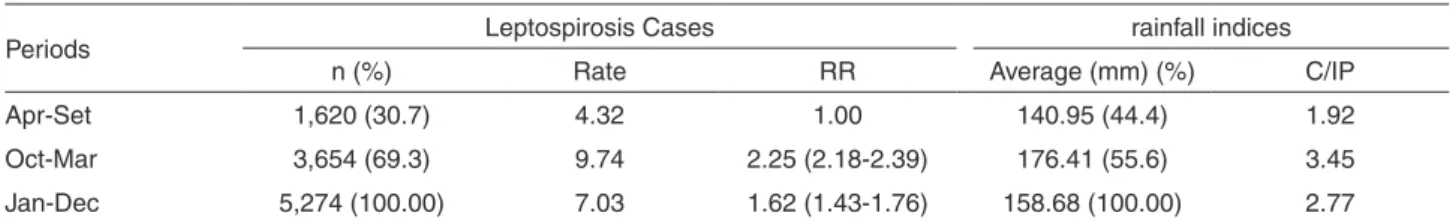
The seasonal distribution, to the Santa Catarina State, leptospirosis cases and the rainfall indexes are described in Table 2.
Between 2005 and 2015, in the period of leptospirosis increasing rates and the medium rainfall indexes (October to March), the set of these months contributed with almost 70% of all the leptospirosis cases and 55.6% of the rain. This period presented a mean incidence rate of leptospirosis higher than the double (RR=2.25; p<0.001) when compared to the months from April to September; and, an excess in cases of leptospirosis of over 60% when compared to the mean incidence in the total period (RR=1.62; p<0.001). The ratio of cases generated, in accordance with the medium increase in rainfall index, has also shown higher values for the period from October to March, compared to the months from April to September (average of 3.45 cases per average variation in the rainfall indexes versus 1.92 cases,
respectively). The relationship between the increment in the cumulative incidence of leptospirosis cases, along with an increase in the average rainfall, when comparing the two seasons showed a continuous and parallel evolution for the period from April to September. For the second period, from October to March, an exponential relationship between cumulative quantity of rain and increased generation of leptospirosis cases pointed to the cumulative effect of rainfall on the generation of cases in the specified period.
Figure 2 presents the monthly variation of leptospirosis rates, the rainfall indexes and the ratio between cases of leptospirosis and rainfall in the months from January to December, for the period studied (2005-2015).
The leptospirosis rates reached their highest indices in the months from January to March, dropping significantly from April to August, increasing linearly during the months of September/October and returning to the highest levels in December. The rainfall indexes are higher in the months of rates peak (October to March), compared to the remaining months (April to September), suggesting the existence of two seasonal periods. It is really important to notice, in the same figure, the increment parallel between the
Table 2 - Distribution of leptospirosis cases and the rainfall indexes in accordance with seasonal periods. Santa Catarina, Brazil, 2005-2015
Periods Leptospirosis Cases rainfall indices
n (%) Rate RR Average (mm) (%) C/IP
Apr-Set 1,620 (30.7) 4.32 1.00 140.95 (44.4) 1.92
Oct-Mar 3,654 (69.3) 9.74 2.25 (2.18-2.39) 176.41 (55.6) 3.45
Jan-Dec 5,274 (100.00) 7.03 1.62 (1.43-1.76) 158.68 (100.00) 2.77
N = number of cases; rate= leptospirosis cases / population of 2010 every 100,000 inhabitants; RR=relative risk; mm=millimeters; C/IP= leptospirosis cases /precipitation index; Apr-Set = April to September; Oct-Mar = October to March; Jan-Dec = January to December
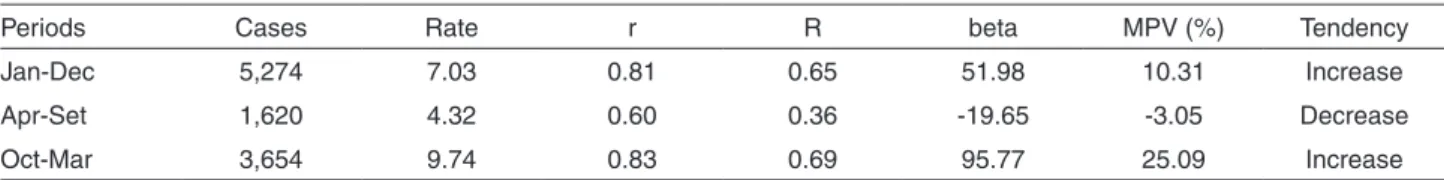
ratio of cases generated by rainfall and the increase in the leptospirosis rates, in the rainy period, pointing to a possible cumulative effect of rainfall levels in rates of disease, the pair of simple association between rainfall and leptospirosis. Finally, the linear regression in Table 3, upon investigating the association between cases of leptospirosis and variation of rainfall, according to the seasonal period, showed an exceedingly strong positive correlation between the seasonal variation of rainfall and the number of leptospirosis cases, in the total period (r=0.81) and in the period from October to March (r=0.83).
The explanatory power of the seasonal model (R2)
showed that, for the period from October to March, the increase in the amount of rain was associated with the increase in the number of generated leptospirosis cases (R2=0.69). The beta coefficient showed that, for the total
period, a mean increment was found of approximately 52 cases of leptospirosis/100,000 inhabitants for each increase in the unit of time (months), associated with the increase in rainfall levels. When stratifying by seasonal period, however, opposite behaviors were observed when comparing the two periods. While there was a mean increment of almost 96 cases per 100,000 inhabitants by an increase in the unit of time, from October to March,
considering the period from April to September, a negative relationship between the amount of rain and generation of leptospirosis cases was evidenced (beta= -19,65). The analysis of the total period pointed to an average monthly growth of 10.31% in the number of leptospirosis cases. The period from October to March showed a temporal trend with respect to the average variation,around 25% increase in leptospirosis cases every month. On the other hand, the period from April to September showed a temporal trend of monthly average drop around 3%.
DISCUSSION
The present study evaluated a continuous series of confirmed cases of leptospirosis for a period of 11 years (2005-2015), to investigate their relationship with the rainfall indexes in the same period. The incidence of the disease, along the months, showed the highest rates occurring in the periods with higher rainfall indexes.
Results showed an increase in the ratio between the number of cases according to the increase in the amount of rain, when comparing the two seasonal periods, in favor of the period with more rain (3.45 versus 1.92), suggesting a direct relationship between the leptospirosis incidence and rainfall indexes (in mm of rain) in the State.
However, even more evident in rainy periods, a positive correlation was found between the number of leptospirosis cases and the rainfall indexes, even in that period with low occurrence of rain, April to September (r=0.60). The occurrence of outbreaks of seasonal character is due to the environmental conditions of the regions of tropical and subtropical climate, the combination of high temperatures in periods of the year with the highest rainfall. Preliminary results showed evidence that the leptospirosis endemics does not have a homogeneous distribution, with lower incidence rates in the month of August (5.38/100,000 inhabitants) and the largest in the month of January (12.32/100,000 inhabitants).
A systematic review on the global morbidity21reported
that the annual leptospirosis incidence is 1.03 million cases throughout the world (95% CI 0.43-1.75), with incidence
Figure 2 - Monthly variation of leptospirosis rates, rainfall levels and the ratio between leptospirosis cases and rainfall levels. Santa Catarina, Brazil, 2005-2015
Table 3 - Linear regression of the association between leptospirosis cases and variations in rainfall, according to seasonal period. Santa Catarina, Brazil, 2005-2015
Periods Cases Rate r R beta MPV (%) Tendency
Jan-Dec 5,274 7.03 0.81 0.65 51.98 10.31 Increase
Apr-Set 1,620 4.32 0.60 0.36 -19.65 -3.05 Decrease
Oct-Mar 3,654 9.74 0.83 0.69 95.77 25.09 Increase
Rate: Leptospirosis cases/population of 2010 every 100,000 inhabitants; r = intraclass correlation; R2 = coefficient of determination;
rates presenting wide variation (from 0.1 to 975.0 cases per 100,000 inhabitants). In Brazil, a higher incidence of leptospirosis was found in the year 2011, with a rate of 2.55/100,000 inhabitants; geographically, the South region presented the highest rates (4.46/100,000), followed by North (2.27), Southeast (1.73), Northeast (1.34) and Midwest regions (0.39)7. In the study, the rate in this same
year was also high (11.14/100,000 inhabitants), probably related to floods in the State, at the time19.
In a temporal series on the incidence of infectious diseases in Brazilian cities22, it was identified that the annual
incidence of leptospirosis ranged from 2 to 3.5/100,000 inhabitants, between 2001 and 2015. A study conducted in Minas Gerais by Dutra et al.23 between 1998 to 2012
identified that the incidence rate of the disease ranged from 0.23 (2001) to 0.91/100,000 inhabitants (2003). In Rio, rates ranging from 3.05 (2007-2009) to 2.75/100,000 inhabitants (2010-2012)3were found. A study of the epidemiological
profile24 in the Sao Paulo State, between 2007-2011,
showed rates of 1.46 to 2.34/100,000 inhabitants. Basso et al.25 reported incidence rate from 2.5 to 3.9/100,000
inhabitants to the city of Porto Alegre and, for the State of Rio Grande do Sul, from 3.6 to 5.0/100,000 inhabitants, in the period from 2007 to 2011. In Santa Catarina (2016), the incidence rates show more current values of 5.09 cases per 100,000 inhabitants19, approximately. It is likely that
the similarity in the rates found between Rio Grande do Sul and Santa Catarina is associated to the existence of favorable aspects to the leptospirosis in both States, associated with socioeconomic and environmental conditions.
Difference in the results obtained from the trend curve in this study compared to Brazil as a whole, is probably due to differences in regional characteristics, resembling on the one hand those found in the States of Santa Catarina and Rio Grande do Sul, and on the other hand, differentiating the rates of incidence occurred in Sao Paulo and Rio de Janeiro. The monthly variation of the rainfall indexes in the present study, obtained by the daily averages of precipitation, allowed to identify the rainfall pattern throughout the year, with higher rates in the months from October to March (176.41 mm/month), when compared to the period from April to September (140.95 mm month), having its peak in the month of January (213.20/mm per month), and its lowest rates in the month of August (124.91 mm/month). Results of different studies in Brazil3,16,23,26,27 allow to compare
variations in average values of precipitation. Vasconcelos et al.16 in the State of Pernambuco observed that the highest
rainfall occurred during the months of April, May and June. Upon analyzing the rainfall in the city of Salvador, Talarico26 also identified the months of April, May and June
as those that present the greatest rainfall, but it was observed
the occurrence of precipitation rates in other months, demonstrating that there is no regular monthly distribution pattern of rainfall during the evaluated period. Lima et al.27,
observed in the city of Belem, in the period from 2006 to 2011, that the period of greatest rainfall occurred between the months of January and May.
However, Dutra et al.23, in Minas Gerais, in the period
from 1988 to 2012, observed that the rainy period occurred from October to March, similar to the pattern found for the State of Santa Catarina, in the current study. Guimarães et al.3 identified a close association between the high rainfall
indexes and the occurrence of floods, being that the period of rains occurred during the months from October to April, corroborating the findings of this study.
Results obtained by calculating the ratio of leptospirosis cases according to the rainfall makes the potentiating role of combination volume and persistence of rainfall, represented by the floods clear, in the spread of the disease, associated with seasonal periods. On the other hand, those periods of lower rain volume, a still high ratio of cases per precipitation indexcan be attributed to the soil waterproofing interfering with the water absorption, favoring the increase of flooding and, consequently, the occurrence of new cases of the disease.
A study by Coelho and Massad28showed that, after
exposure to contaminated water of flooding, the risk of contracting leptospirosis increased. It was observed that, for each supplementary 20 mm of monthly precipitation, there was an increase of 31.5% in hospitalizations for leptospirosis in the State of Sao Paulo. Still, it was possible to observe that the variation of the precipitation from 20 to 140 mm caused an increase from 16.6% to 142% in hospitalizations, respectively. Results of the current study support this relationship, showing it to be possible to predict, from meteorological variables, the relationship between rainfall and cases of the disease generated by the average amount of rainfall in different periods of the year.
Dutra et al.23,in a study conducted in the State of Minas
Gerais, found that the highest levels of precipitation were associated with leptospirosis outbreaks. In the same way that Guimarães et al.3 pointed to an increase in the Relative
Risk (RR) of leptospirosis in the period corresponding to the high rainfall, compared to the rest of the year. In the present study, these data were corroborated by the statistical significances found, showing an increase of more than 3 times (RR>3) during the period of the greatest rainfall.
From the results of the present study, it is possible to clearly define two seasonal periods, twice the number of leptospirosis cases took place from October to March, with an incidence rate of the disease in this period up to 9 cases per 100,000 inhabitants, compared to the rest of the period, from April to September, with an incidence of 4.32 cases per 100,000 inhabitants. On the other hand, upon examining the ratio of leptospirosis cases by precipitation index, a ratio of 3.45 cases per average variation in rainfall was found from October to March, while this ratio in the period from April to September was 1.92 cases. The seasonality found in the current study is similar to that found in the city of Rio de Janeiro3,in the State of Pernambuco16,in Minas Gerais23,
in Sao Paulo24,in the city of Salvador26,in the Autonomous
Region of Azores29 and in the municipalities of Baixada
Fluminense in RJ30.
Still, when comparing the two seasonal periods, in order to detect the absolute magnitude of the rainfall effect, the number of cases of leptospirosis generated in October-March, compared to April-September, an absolute excess was found in October-March, of 5.42 cases/100,000 inhabitants, comparing the incidence of leptospirosis in both periods. The etiological fraction, in turn, indicates that an excess of 55.6% in the incidence among those exposed to rainier seasonal period, could be attributed to the excess of rain during that period. Thus, more than half of the 3,654 cases generated during the period of increase in the rainy season (October- March), i.e., 2,032 cases of leptospirosis can be attributed to the increase in rainfall levels. The present study, upon investigating the seasonal leptospirosis variability, confirmed the assertion that correlates more rainy periods to the increase in the number of cases of leptospirosis.
When investigating the temporal trend of leptospirosis rates in accordance with variations in rainfall and the seasonality between April to September (4.32/100,000), the rates were lower compared to the period October to March (9.74/100,000), representing an increase in the leptospirosis incidence of 125% in the period studied. It was observed that, from October to March, a period of higher rainfall, there was a significant tendency of increase in the disease rates, while, in the period from April to September, the tendency was for stability. A strong positive correlation between the rain volume and the generation of cases was found for the period from October to March (r=0.83). The participation of rain in the generation of new cases in this period, with more than 2/3 of the variability in the leptospirosis rates (R2=0.69), explained by the increase in the rain volumes in that period, also pointing to the co-participation of other environmental factors, basic sanitation and disorganized urbanization, among others. The generation of approximately 1 case
per 1,000 inhabitants, representing more than the double compared to the remainder of the period, strengthens the study central hypothesis of a relationship between rainfall and the leptospirosis occurrence.
Gonçalves et al.31studied the leptospirosis temporal
distribution and risk factors, in Belem, State of Para. The general tendency expressed the decrease of the disease between 2007 to 2013, however the greatest notification of cases occurred in the first half of the years studied, related to floods. Souza et al.32 demonstrated, in agreement with
the data analyzed, that leptospirosis has a clear variation according to the rainfall. On the other hand, Pereira et al.33,
while studying the trend and seasonality of leptospirosis in Brazil (2008 to 2012), found that there was no growth of the disease throughout the series, but, when performing the seasonal decomposition, it became evident that the disease peaks coincide with periods of rain or flood.
This research allows to conclude that leptospirosis occurred throughout the year and showed clear seasonality.
REFERENCES
1. Brasil. Ministério da Saúde. Secretaria de Vigilância em Saúde. Departamento de Vigilância das Doenças Transmissíveis. Leptospirose: diagnóstico e manejo clínico. Brasília: Ministério da Saúde; 2014.
2. Souza VM, Arsky ML, Castro AP, Araújo WN. Anos potenciais de vida perdidos e custos hospitalares da leptospirose no Brasil. Rev Saude Publica. 2011;45:1001-8.
3. Guimarães RM, Cruz OG, Parreira VG, Mazoto ML, Vieira JD, Asmus CI. Análise temporal da relação entre leptospirose e ocorrência de inundações por chuvas no município do Rio de Janeiro, Brasil, 2007-2012. Cien Saude Colet. 2014;19:3683-92.
4. Lau CL, Smythe LD, Craig SB, Weinstein P. Climate change, flooding, urbanisation and leptospirosis: fuelling the fire? Trans R Soc Trop Med Hyg. 2010;104:631-8.
5. Organización Mundial de la Salud. Leptospirosis humana: guía para el diagnóstico, vigilancia y control. Rio de Janeiro: OMS; 2008. [cited 2018 Jun 6]. Available from: http://www.med. monash.edu.au/microbiology/staff/adler/guia-esp.pdf
6. Picardeau M. Diagnosis and epidemiology of leptospirosis. Med Mal Infect. 2013;43:1-9.
7. Oliveira TV, Marinho DP, Costa Neto C, Kligerman DC. Variáveis climáticas, condições de vida e saúde da população: a leptospirose no município do Rio de Janeiro de 1996 a 2009. Cien Saude Colet. 2012;17:1569-76.
epidemia, junto às Secretarias Municipais e Estaduais de Saúde e à Fundação Nacional de Saúde - FUNASA. Diário Oficial da União, Brasília, 23 Dez 1999. Seção 1:34. [cited 2018 Jun 14]. Available from: http://www2.camara.leg.br/legin/marg/ portar/1999/portaria-1461-22-dezembro-1999-370585-norma-ms.html
9. Diament D, Lomar AV, Brito T. Leptospiroses. In: Fogaccia R, editor. Tratado de infectologia. 5ª ed. rev. atual. São Paulo: Atheneu; 2015. p.1519-35.
10. Damasco PV, Menezes VM, Friedrich AW. Leptospirose. In: Tavares W, Marinho LA, editores. Rotinas de diagnóstico e tratamento das doenças infecciosas e parasitárias. 4ª ed. São Paulo: Atheneu; 2015. p.753-60.
11. Brasil. Ministério da Saúde. Secretaria de Vigilância em Saúde. Coordenação-Geral de Desenvolvimento da Epidemiologia em Serviços. Guia de vigilância em saúde. 2ª ed. Brasília; Ministério da Saúde; 2017. p.569-85. [cited 2018 Jun 14]. Available from: http://portalarquivos.saude.gov.br/images/ pdf/2017/outubro/06/Volume-Unico-2017.pdf
12. Vijayachari P, Sugunan AP, Sriram AN. Leptospirosis: an emerging global public health problem. J Biosci. 2008;33:557-69.
13. Pelissari DM, Elkhoury AN, Arsky ML, Nunes ML. Revisão sistemática dos fatores associados à leptospirose no Brasil, 2000-2009. Epidemiol Serv Saude. 2011;20:565-74.
14. Lehmann JS, Matthias MA, Vinetz JM, Fouts DE. Leptospiral pathogenomics. Pathogens. 2014;3:280-308.
15. Barcellos C, Monteiro AM, Corvalán C, Gurgel HC, Carvalho MS, Artaxo P, et al. Climatic and environmental changes and their effect on infectious diseases: scenarios and uncertainties for Brazil. Epidemiol Serv Saude. 2009;18:285-304.
16. Vasconcelos CH, Fonseca FR, Lise ML, Arsky ML. Fatores ambientais e socioeconômicos relacionados à distribuição de casos de leptospirose no Estado de Pernambuco, Brasil, 2001-2009. Cad Saude Colet. 2012;20:49-56.
17. Instituto Brasileiro de Geografia e Estatística. Santa Catarina. [cited 2018 June 7]. Available from: http://www.ibge.gov.br/ estadosat/perfil.php?sigla=sc
18. Coan BP, Back AJ, Bonetti AV. Precipitação mensal e anual provável no Estado de Santa Catarina. Rev Br Climatol. 2014;15:122-42.
19. Pandolfo C, Braga HJ, Massignan AM, Silva Júnior VP, Thomé VM, Vieira VF. Atlas climatológico do Estado de Santa Catarina. Florianópolis: Epagri; 2002.
20. Gaynor PE, Kirkpatrick RC. Introduction to time-series modeling and forecasting in business and economics. New York: McGraw-Hill; 1994.
21. Costa F, Hagan JE, Calcagno J, Kane M, Torgerson P, Martinez-Silveira MS, et al. Global morbidity and mortality of leptospirosis: a systematic review. Plos Negl Trop Dis. 2015;9:e0003898.
22. Segurado AC, Cassenote AJ, Luna EA. Saúde nas metrópoles - doenças infecciosas. Estud Av. 2016;30:29-49.
23. Dutra FR, Valadão RC, Confalonieri UE, Müller GV, Quadro MF. A influência da variabilidade da precipitação no padrão de distribuição dos casos de leptospirose em Minas Gerais, no período de 1998 - 2012. Hygeia. 2015;11:106-126.
24. Buzzar MR. Perfil epidemiológico da leptospirose no estado de São Paulo no período de 2007 a 2011. In: Anais da 2ª Conferência Internacional em Epidemiologia. São Paulo; Secretaria de Saúde; 2012.
25. Basso LA, Righi R. Casos de hepatite A e leptospirose no município de Porto Alegre – RS entre os anos de 2007 a 2011. Hygeia. 2015;11:66-84.
26. Talarico DC. Leptospirose e pluviosidade: uma análise na cidade de Salvador-BA. In: Jornada de Engenharia Sanitária e Ambiental. Salvador: JESAM/IFBA/UFBA; 2013.
27. Lima RJ, Abreu EM, Ramos FL, Santos RD, Santos DD, Santos FA, et al. Análise da distribuição espaço-temporal da leptospirose humana em Belém, Estado do Pará, Brasil. Rev Pan-Amaz Saúde. 2012;3:33-40.
28. Coelho MZ, Massad E. The impact of climate on Leptospirosis in São Paulo, Brazil. Int J Biometeorol. 2012;56:233-41.
29. Mottola C, Alho AM, Rafael T, Gonçalves T, Seixas R. Leptospirose em Portugal: situação actual e importância das medidas de controlo no contexto da saúde pública. REDVET. 2015;16:1-16.
30. Oliveira HH, Rodrigues MA, Santos IS, Francischetti CN. Perfil epidemiológico e socioeconômico da ocorrência de casos de leptospirose em municípios da Baixada Fluminense, Rio de Janeiro, Brasil. Encicl Biosf. 2016;13:1479-91.
31. Gonçalves NV, Araújo EN, Sousa Júnior AS, Miranda CS, Campos PS, Matos MW, et al. Distribuição espaço-temporal da leptospirose e fatores de risco em Belém, Pará, Brasil Cien Saude Colet. 2016;21:3947-55.
32. Souza AA, Ferreira FC, Rezende HD, Arruda JF, Eça PM. Variação sazonal e aspectos clínico-epidemiológicos da leptospirose humana na cidade de Itaperuna-RJ. Acta Biomed Brasiliensia. 2013;4:49-56.