151103-PD-2016 (9 páginas)
PROVA GRÁFICA
ONEN, H.1 AKDENIZ, M.1 FAROOQ, S.1 HUSSAIN, M.2* OZASLAN, C.3
Article
PLANTA DANINHA
* Corresponding author: <mubashiragr@gmail.com>
Received: November 18, 2016 Approved: January 9, 2017
Planta Daninha 2018; v36:e018172126
SOCIEDADE BRASILEIRA DA CIÊNCIA DAS PLANTAS DANINHAS
1 Department of Plant Protection, Gaziosmanpasa University, Tokat, Turkey; 2 Department of Agronomy, Bahauddin Zakariya University, Multan, Pakistan; 3 Department of Plant Protection, Dicle University, Diyarbakir, Turkey.
<http://www.sbcpd.org>
ISSN 0100-8358 (print)
1806-9681 (online)
W
EEDF
LORA OFC
ITRUSO
RCHARDS ANDF
ACTORSA
FFECTING ITSD
ISTRIBUTION INW
ESTERNM
EDITERRANEANR
EGION OFT
URKEYFlora de Plantas Daninhas em Pomares de Citros e Fatores que Afetam sua
Distribuição na Região Mediterrânea Ocidental da Turquia
ABSTRACT - Citrus is an important export commodity, mostly grown on Mediterranean and Aegean coasts of Turkey. Weeds are hidden foes impairing citrus productivity. Limited knowledge of weed distribution and factors affecting the distribution are among major hurdles in successful weed management. In this study, weed flora of citrus orchards and factors affecting its distributions in Mugla province of Turkey were determined. Sixty orchards were surveyed in spring and autumn seasons of 2010 and 2011. Data relating to frequency, coverage and density of weed species were recorded. Soil samples (0-30 cm depth) were collected and analyzed for physicochemical properties. Climatic variables, altitude and soil properties were correlated with weed flora. Sixty-eight weed species belonging to 30 families were documented. Higher number of weed species (54) was recorded in spring season compared with autumn (29 weed species). Annuals and therophytes were the most dominant growth and life forms, respectively. Canonical Correspondence Analysis (CCA) to correlate soil properties and weed vegetation data yielded three distinct groups dominated by phosphorus, sand and silt contents, which affected weed distribution. CCA to correlate vegetation data and weather attributes produced two distinct groups affected by altitude and precipitation. Generally, cosmopolitan weeds adapted to different ecosystems were observed during the survey. Keeping in view the spatial variability of soil and nature of weeds, site-specific/orchard-specific weed management practices are recommended to be opted for successful weed management.
Keywords: weeds, multivariate analysis, soil properties, weather.
RESUMO - Os citros são uma importante mercadoria de exportação, cultivados sobretudo na costa dos mares Mediterrâneo e Egeu, na Turquia. Por sua vez, as plantas daninhas são inimigos ocultos que prejudicam a produtividade dos citros. O conhecimento limitado sobre a distribuição de plantas daninhas e os fatores que afetam essa distribuição está entre os principais obstáculos ao manejo eficiente. Neste estudo, foram determinados a flora de plantas daninhas de pomares cítricos e os fatores que afetaram as respectivas distribuições na província de Mugla, na Turquia. Sessenta pomares foram pesquisados nas estações de primavera e outono de 2010 e 2011. Foram registrados dados relativos a frequência, cobertura e densidade de espécies de plantas daninhas. Amostras de solo (0 a 30 cm de profundidade) foram coletadas e analisadas quanto às propriedades físico-químicas. As variáveis climáticas, a altitude e as propriedades do solo foram correlacionadas com a flora das plantas daninhas. Foram documentadas 68 espécies de plantas, pertencentes a 30 famílias. Um número maior de espécies de plantas daninhas (54) foi registrado na primavera, em comparação com o outono Copyright: This is an open-access article
(29 espécies). Plantas anuais e terófitos foram as formas de crescimento e de vida prevalentes, respectivamente. A Análise de Correspondência Canônica (CCA), utilizada para correlacionar as propriedades do solo e os dados da flora das plantas daninhas, produziu três grupos distintos, dominados pelos conteúdos de fósforo, areia e limo, os quais afetaram a distribuição das plantas. A CCA usada para correlacionar dados da flora e atributos climáticos produziu dois grupos distintos, afetados pela altitude e precipitação. De modo geral, durante a pesquisa, foram observadas plantas daninhas cosmopolitas adaptadas a diferentes ecossistemas. Tendo em vista a variabilidade espacial do solo e a natureza das plantas daninhas, recomenda-se a escolha de práticas de manejo específicas para cada local/pomar, a fim de propiciar o manejo bem-sucedido delas.
Palavras-chave: plantas daninhas, análise multivariada, propriedades do solo, clima.
INTRODUCTION
Citrus is a tropical and sub–tropical fruit group which is extensively cultivated in various non-tropical zones such as the Mediterranean region (Cerdà et al., 2009; Shirgure, 2013). Irrigation is necessary in modern citrus production (Shirgure, 2013) to obtain higher yield and quality. Mediterranean regions experience a hot and dry summer; therefore, irrigation is also necessary for plant survival and high yield with good quality produce (Cerdà et al., 2009). Weeds reduce evaporation, conserve soil moisture in drier seasons and decrease soil erosion, hence they are often ignored in citrus orchards (Chen et al., 1999; Chen et al., 2002). Although weeds decrease evaporation, they also consume plenty of water, plant nutrients and compete with citrus plants, particularly in the Mediterranean region. Thus, citrus yield and quality are significantly affected by citrus–weed competition (Özer et al., 2001). In addition, many weed species serve as hosts of pests and diseases, hence weeds are also a source of pest and disease outbreaks (Holmes and Froud-Williams, 2005; Macharia et al., 2016).
Weeds spatially coincide with crops, deprive them from mineral nutrients, moisture, space and sunlight and disrupt many physiological processes which result in yield reduction (Bhatt and Singh, 2007). For this reason, they need to be managed for sustainable crop production (Buhler et al., 2000). Herbicide application and tillage practices for the purpose of weed management pose severe risks to agro-ecosystems, e.g., increased water pollution, development of herbicide resistance, decline in organic matter content of soil and increase in soil susceptibility to water and wind erosion. Therefore, site–specific management approaches are necessary to combat weeds and lower their detrimental impacts. Knowledge of weed distribution, dynamics of weed populations, nature of weeds and factors affecting their distribution is required for developing site-specific, sustainable and eco-friendly integrated weed management programs.
Weed communities at landscape scales are composed of numerous species, each with a distinct distribution pattern. Weed distribution patterns are the result of crop rotation, weed management practices, soil tillage, heterogeneity in climatic, soil and landscape conditions, availability of ground water, topography (Roschewitz et al., 2005; Boutin et al., 2008; Shahzad et al., 2016a,b), co-occurrence of weeds, weed–crop interactions (Borgy et al., 2012; Petit and Fried, 2012; Shahzad et al., 2016a), facilitation process or combination of some or all these factors (Cardina et al., 1997).
Weed community ecology studies are concentrated on the distribution pattern of weeds and factors affecting their distribution. Weed surveys are critical to determine these patterns at spatial and landscape scales (Rankins et al., 2005; Korres et al., 2015a, b). Therefore, the quantitative weed data collected through surveys are of great importance for assessing factors affecting weed distribution and development of integrated weed management approaches. In turn, multivariate analyses are useful for quantitative weed vegetation studies and are successfully applied to analyze occurrence and distribution of weed species as well as correlate the distribution patterns with several environmental factors (Dieleman et al., 2000a,b; Kenkel et al., 2002).
citrus production in the country. However, weed losses are generally misjudged and understudied by citrus growers and weed ecologists, respectively. Citrus growers in the Western Mediterranean region of Turkey employ conventional tillage practices for weed management (Akdeniz et al., 2015). However, sustainable and site–specific weed management approaches are needed to avoid the negative effects of excessive tillage on plant growth and sustain soil health.
There is limited information about citrus weed flora and factors affecting its distribution in the Western Mediterranean region of Turkey. Therefore, the present study was conducted to determine the weed flora prevailing in citrus orchards of the Mugla province (Western Mediterranean region of Turkey) and factors affecting its distribution in the region. The results will contribute to the development of site-specific, alternative weed management approaches for citrus orchards in the region.
MATERIALS AND METHODS
Study area
Surveys were conducted in five different districts of Mugla province which have intensive citrus plantations. Sixty (60) orchards were surveyed, and orchard locations were recorded using a Global Positioning System (GPS). The locations of surveyed orchards are represented in Figure 1.
Floristic and coverage data
Surveys were conducted in spring and autumn seasons of 2010 and 2011. Data on cover (%)
and density (plants m-2) were recorded for each observed weed species. Weed densities were
recorded using a 1 m × 1 m quadrate. The number of quadrates to be placed in a specific orchard was determined through preliminary observations and were as follows: three for orchard of less than 0.5 ha, five for 0.5-1.0 ha, and eight for > 1.0 ha. Coverage area of weeds was also visually assessed from each quadrate within the orchards. Surveys were conducted from 10 m inside of the orchard borders at different sites in diagonal method as suggested by Önen and Özer (2002).
Figure 1 - Surveyed locations within the Mugla province in Turkey; (A) geographic location of the surveyed region (B) map displaying the surveyed sites.
Data on coverage area and density from different sub-sampling sites of the same orchard were averaged to get the coverage and density for that specific orchard. Herbaria of recorded weed species were prepared and submitted to Department of Plant Protection, Gaziosmanpasa University, Tokat, Turkey. The recorded weed species were identified with the help of Flora of Turkey ( Davis et al., 1965-1989). Raunkiaer’s scheme was followed to classify the life form of all the recorded weeds (Raunkiaer, 1934). A scale was devised for easier interpretation of frequency of occurrence (1 to 4) and density (A to E) data. In the frequency of occurrence scale; 1 represents > 50%, 2 = 25-50%, 3 = 13-25% and 4 = <13% frequency of occurrence. Similarly, in the density scale; A represents >20, B =10-20, C = 1-10, D = 0.1-10 and E= <0.1 plants m–2.
Soil properties
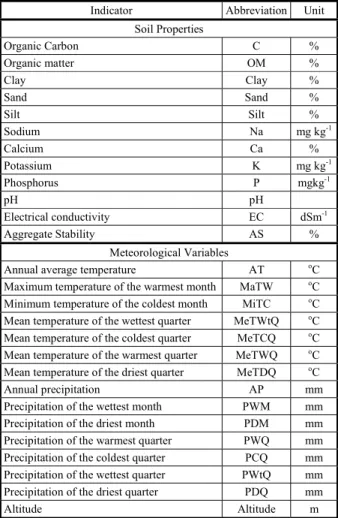
Soil samples were taken (0-30 cm depth) from each orchard to correlate weed distribution with soil physicochemical properties. Samples were taken from each sub-sampling site of an orchard and mixed to get a composite sample of approximate 1 kg weight. Soil samples were air-dried and sieved through 2 mm sieves for physicochemical analyses. The description, abbreviation and units of soil properties are given in Table 1.
Bouyoucos (1962) was followed to determine soil texture. Organic matter (OM) contents were determined by the Walkley and Black method (Nelson and Sommers, 1982). Organic carbon (C) was estimated from organic matter content by using a value of 1.72 as a conversion factor, based on the assumption that organic matter contains 58% carbon (Broadbent, 1953). Soil reaction (pH) and electrical conductivity (EC) were measured in a saturated paste (Rhoades, 1982). Allison and Moodie (1965) were followed to determine CaCO3. Major cations such as potassium (K), calcium
Table 1 - Description, abbreviations and units of the soil properties and meteorological variables
Indicator Abbreviation Unit
Soil Properties
Organic Carbon C %
Organic matter OM %
Clay Clay %
Sand Sand %
Silt Silt %
Sodium Na mg kg-1
Calcium Ca %
Potassium K mg kg-1
Phosphorus P mgkg-1
pH pH
Electrical conductivity EC dSm-1
Aggregate Stability AS %
Meteorological Variables
Annual average temperature AT oC
Maximum temperature of the warmest month MaTW oC
Minimum temperature of the coldest month MiTC oC
Mean temperature of the wettest quarter MeTWtQ oC
Mean temperature of the coldest quarter MeTCQ oC
Mean temperature of the warmest quarter MeTWQ oC
Mean temperature of the driest quarter MeTDQ oC
Annual precipitation AP mm
Precipitation of the wettest month PWM mm Precipitation of the driest month PDM mm Precipitation of the warmest quarter PWQ mm Precipitation of the coldest quarter PCQ mm Precipitation of the wettest quarter PWtQ mm Precipitation of the driest quarter PDQ mm
Altitude Altitude m
(Ca) and magnesium (Mg) were determined by inductively coupled plasma spectroscopy
(ICP) after extraction with 1.0 M NH4OAc
buffered at pH 7 (Thomas, 1982). Plant available phosphorus (P) concentration was analyzed by the Olsen method (Olsen and Sommers, 1982). Wet sieving method of Kemper and Rosenau (1986) was used to determine aggregate stability (AS) of soil samples.
Meteorological variables
Different bioclimatic variables (based on temperature and rainfall) were extracted for GPS locations of the orchards using the ArcGIS spatial analyst toolbox. Briefly, data of 18 Bioclim variables developed by Hijmans et al. (2005) were downloaded (from http:// www.worldclim.org/current) for current climate conditions. Meteorological variables were extracted for each orchard. A total of 14 indicators along with altitude were used to correlate with weed distribution. Abbreviation and units of the meteorological variables used are summarized in Table 1.
Statistical Analysis
minimum, maximum, mean, variance and standard deviation of soil and meteorological data; ii) principal component analysis (PCA) of soil and meteorological attributes was conducted to make data interpretation easier. Varimax rotation, with Kaiser Normalization was used in PCA; iii) spearman rank correlation was tested to correlate weed occurrence with soil properties and meteorological attributes separately and iv) a Canonical Correspondence Analysis (CCA) was conducted to correlate weed flora with soil properties and meteorological variables, separately. Species data for spring and autumn seasons were combined and only the species which had positive or negative correlations with soil properties or meteorological attributes were included in CCA. Significance of CCA axes was tested by a Monte Carlo test with 499 permutations. Arrow length was used to express the effect size of soil and meteorological variables in CCA (Leps and Smilauer, 2003). All statistical computations except CCA were performed on SPSS (IBM Corporation 2012). CCA was executed on the CANOCO statistical package (Microcomputer Power USA).
RESULTS AND DISCUSSION
Floristic features
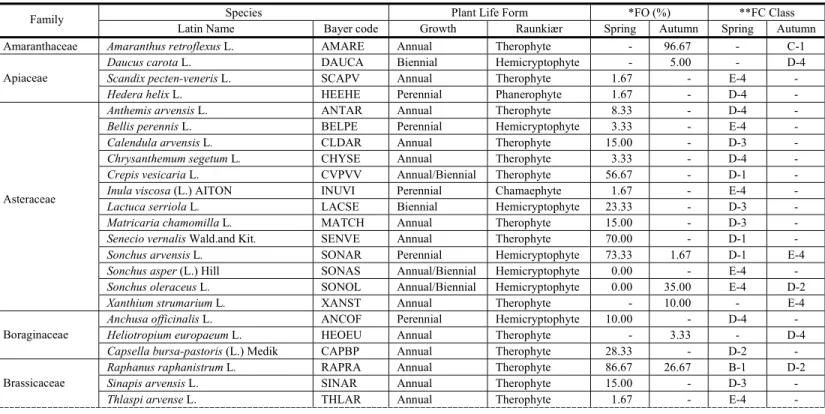
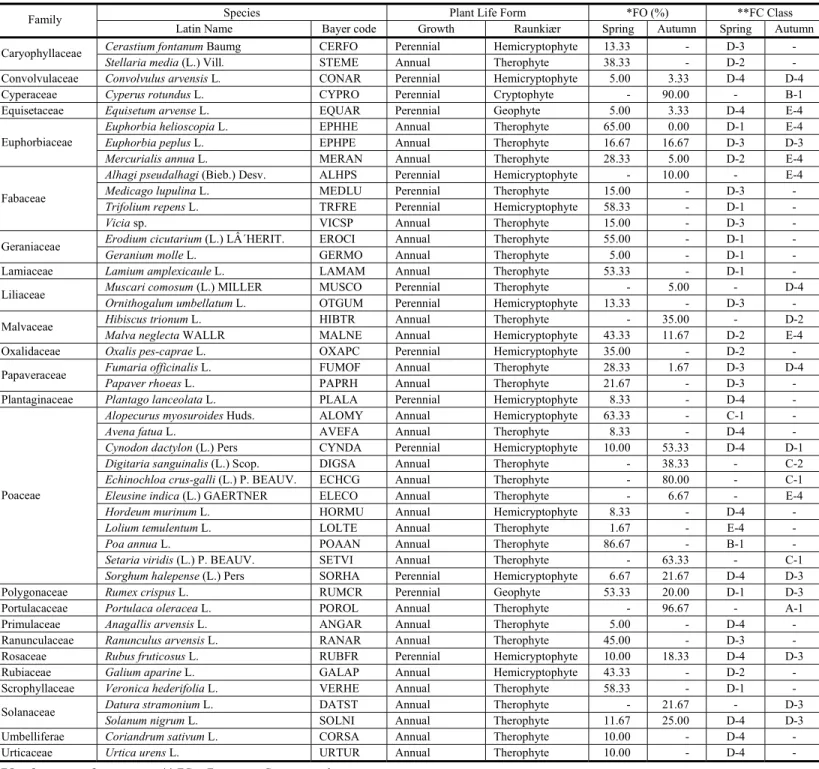
Sixty-eight weed species belonging to 30 different families were identified during the surveys (Table 2). The highest number of weed species (54) was recorded in spring season compared to autumn (29), whereas fifteen (15) species were commonly observed in both seasons. The highest number of identified weed species (19%) belonged to the Asteraceae followed by the Poaceae (Figure 2) family. Most of the plant families (17 out of 30) were represented by only one weed species. Forty-six of the identified weed species have annual growth, 20 were perennial and two weed species had a biennial nature (Table 2). Similarly, according to the Raunkiær’s system for plant life-form categories; therophytes were the predominant (42 of 68) life form, followed by hemicryptophytes (21) and geophytes (Table 2). The weeds most frequently observed during spring
season were; Poa annua and Raphanus raphanistrum with 87% frequency of occurrence, whereas
Portulaca oleracea and Amaranthus retroflexus were the species most frequently observed in the autumn season, with 97% frequency of occurrence (Table 2).
Table 2 - Life forms, frequency of occurrence, density, frequency, cover class and Bayer codes of recorded weed species
Species Plant Life Form *FO (%) **FC Class
Family
Latin Name Bayer code Growth Raunkiær Spring Autumn Spring Autumn
Amaranthaceae Amaranthus retroflexus L. AMARE Annual Therophyte - 96.67 - C-1
Daucus carota L. DAUCA Biennial Hemicryptophyte - 5.00 - D-4
Scandix pecten-veneris L. SCAPV Annual Therophyte 1.67 - E-4 - Apiaceae
Hedera helix L. HEEHE Perennial Phanerophyte 1.67 - D-4 -
Anthemis arvensis L. ANTAR Annual Therophyte 8.33 - D-4 -
Bellis perennis L. BELPE Perennial Hemicryptophyte 3.33 - E-4 -
Calendula arvensis L. CLDAR Annual Therophyte 15.00 - D-3 -
Chrysanthemum segetum L. CHYSE Annual Therophyte 3.33 - D-4 -
Crepis vesicaria L. CVPVV Annual/Biennial Therophyte 56.67 - D-1 -
Inula viscosa (L.) AITON INUVI Perennial Chamaephyte 1.67 - E-4 -
Lactuca serriola L. LACSE Biennial Hemicryptophyte 23.33 - D-3 -
Matricaria chamomilla L. MATCH Annual Therophyte 15.00 - D-3 -
Senecio vernalis Wald.and Kit. SENVE Annual Therophyte 70.00 - D-1 -
Sonchus arvensis L. SONAR Perennial Hemicryptophyte 73.33 1.67 D-1 E-4
Sonchus asper (L.) Hill SONAS Annual/Biennial Hemicryptophyte 0.00 - E-4 -
Sonchus oleraceus L. SONOL Annual/Biennial Hemicryptophyte 0.00 35.00 E-4 D-2 Asteraceae
Xanthium strumarium L. XANST Annual Therophyte - 10.00 - E-4
Anchusa officinalis L. ANCOF Perennial Hemicryptophyte 10.00 - D-4 -
Heliotropium europaeum L. HEOEU Annual Therophyte - 3.33 - D-4 Boraginaceae
Capsella bursa-pastoris (L.) Medik CAPBP Annual Therophyte 28.33 - D-2 -
Raphanus raphanistrum L. RAPRA Annual Therophyte 86.67 26.67 B-1 D-2
Sinapis arvensis L. SINAR Annual Therophyte 15.00 - D-3 - Brassicaceae
Thlaspi arvense L. THLAR Annual Therophyte 1.67 - E-4 -
Table 2, cont.
Species Plant Life Form *FO (%) **FC Class
Family
Latin Name Bayer code Growth Raunkiær Spring Autumn Spring Autumn
Cerastium fontanum Baumg CERFO Perennial Hemicryptophyte 13.33 - D-3 - Caryophyllaceae
Stellaria media (L.) Vill. STEME Annual Therophyte 38.33 - D-2 -
Convolvulaceae Convolvulus arvensis L. CONAR Perennial Hemicryptophyte 5.00 3.33 D-4 D-4
Cyperaceae Cyperus rotundus L. CYPRO Perennial Cryptophyte - 90.00 - B-1
Equisetaceae Equisetum arvense L. EQUAR Perennial Geophyte 5.00 3.33 D-4 E-4
Euphorbia helioscopia L. EPHHE Annual Therophyte 65.00 0.00 D-1 E-4
Euphorbia peplus L. EPHPE Annual Therophyte 16.67 16.67 D-3 D-3 Euphorbiaceae
Mercurialis annua L. MERAN Annual Therophyte 28.33 5.00 D-2 E-4
Alhagi pseudalhagi (Bieb.) Desv. ALHPS Perennial Hemicryptophyte - 10.00 - E-4
Medicago lupulina L. MEDLU Perennial Therophyte 15.00 - D-3 -
Trifolium repens L. TRFRE Perennial Hemicryptophyte 58.33 - D-1 - Fabaceae
Vicia sp. VICSP Annual Therophyte 15.00 - D-3 -
Erodium cicutarium (L.) L´HERIT. EROCI Annual Therophyte 55.00 - D-1 - Geraniaceae
Geranium molle L. GERMO Annual Therophyte 5.00 - D-1 -
Lamiaceae Lamium amplexicaule L. LAMAM Annual Therophyte 53.33 - D-1 -
Muscari comosum (L.) MILLER MUSCO Perennial Therophyte - 5.00 - D-4 Liliaceae
Ornithogalum umbellatum L. OTGUM Perennial Hemicryptophyte 13.33 - D-3 -
Hibiscus trionum L. HIBTR Annual Therophyte - 35.00 - D-2 Malvaceae
Malva neglecta WALLR MALNE Annual Hemicryptophyte 43.33 11.67 D-2 E-4
Oxalidaceae Oxalis pes-caprae L. OXAPC Perennial Hemicryptophyte 35.00 - D-2 -
Fumaria officinalis L. FUMOF Annual Therophyte 28.33 1.67 D-3 D-4 Papaveraceae
Papaver rhoeas L. PAPRH Annual Therophyte 21.67 - D-3 -
Plantaginaceae Plantago lanceolata L. PLALA Perennial Hemicryptophyte 8.33 - D-4 -
Alopecurus myosuroides Huds. ALOMY Annual Hemicryptophyte 63.33 - C-1 -
Avena fatua L. AVEFA Annual Therophyte 8.33 - D-4 -
Cynodon dactylon (L.) Pers CYNDA Perennial Hemicryptophyte 10.00 53.33 D-4 D-1
Digitaria sanguinalis (L.) Scop. DIGSA Annual Therophyte - 38.33 - C-2
Echinochloa crus-galli (L.) P. BEAUV. ECHCG Annual Therophyte - 80.00 - C-1
Eleusine indica (L.) GAERTNER ELECO Annual Therophyte - 6.67 - E-4
Hordeum murinum L. HORMU Annual Hemicryptophyte 8.33 - D-4 -
Lolium temulentumL. LOLTE Annual Therophyte 1.67 - E-4 -
Poa annua L. POAAN Annual Therophyte 86.67 - B-1 -
Setaria viridis (L.) P. BEAUV. SETVI Annual Therophyte - 63.33 - C-1 Poaceae
Sorghum halepense (L.) Pers SORHA Perennial Hemicryptophyte 6.67 21.67 D-4 D-3
Polygonaceae Rumex crispus L. RUMCR Perennial Geophyte 53.33 20.00 D-1 D-3
Portulacaceae Portulaca oleracea L. POROL Annual Therophyte - 96.67 - A-1
Primulaceae Anagallis arvensis L. ANGAR Annual Therophyte 5.00 - D-4 -
Ranunculaceae Ranunculus arvensis L. RANAR Annual Therophyte 45.00 - D-3 -
Rosaceae Rubus fruticosus L. RUBFR Perennial Hemicryptophyte 10.00 18.33 D-4 D-3
Rubiaceae Galium aparine L. GALAP Annual Hemicryptophyte 43.33 - D-2 -
Scrophyllaceae Veronica hederifolia L. VERHE Annual Therophyte 58.33 - D-1 -
Datura stramonium L. DATST Annual Therophyte - 21.67 - D-3 Solanaceae
Solanum nigrum L. SOLNI Annual Therophyte 11.67 25.00 D-4 D-3
Umbelliferae Coriandrum sativum L. CORSA Annual Therophyte 10.00 - D-4 -
Urticaceae Urtica urens L. URTUR Annual Therophyte 10.00 - D-4 -
* FO = frequency of occurrence, ** FC = Frequency-Cover, - = absent.
Species (%)
P
lan
t f
a
mil
ies
Figure 2 - Distribution (%) of the weeds found in different botanical families.
The variation in weed density and coverage areas can be explained by heterogeneity in soil properties and microclimatic conditions (Gaston et al., 2001; James et al., 2006). Spatial variation of soil properties is affected by inherent soil characteristics such as particle size distribution (sand, silt and clay content), ground water availability, topography and management practices (Alignier et al., 2012; Shehata et al., 2015). Large variation of sand, silt and clay contents of soils is an indication of parent material differences among soils of surveyed orchards. Dominant species P. oleracea and A. retroflexus have also been acknowledged as the most frequent weed species in citrus orchards of a neighbor (Antalya) province in the autumn season (Arikan et al.,
2015). The most frequent weeds of spring season were P. annua and R. raphanistrum. These
weeds prefer N and P rich soils with high moisture availability. They can also tolerate a variety of harsh environmental conditions; thus, they are successful in different regions (GISD, 2016).
Cultivation and weed management practices play a critical role in short distance spread and distribution of weed species (Yirefu and Tana, 2007). Weed management and cultivation practices which do not damage propagation organs, play a significant role in the dispersal of
perennial weed species. Abundance of perennial weeds such as Cyperus rotundus, Cynodon
dactylon, Trifolium repens, Sonchus arvensis, Sorghum halepense and Oxalis pes-caprae spreading with vegetative organs can be correlated with ineffective weed management options practiced in the region. The occurrence and adverse effects of the perennial weeds are well reported in the other citrus grown in Mediterranean regions (Brandes, 1991; Bensellam et al., 1997; Arikan et al., 2015).
Soil and meteorological features
varied from 15.9 to 53.4%). Attributes of particle size distribution (sand, silt and clay contents) are considered as inherent soil characteristics which are not changed by on-farm management practices over time (Herrick, 2000) and result largely from the parent material of soil. Similarly, there were also large variations in Ca, Na, K, P, pH, EC and aggregate stability. Altitude ranged from 1 m to 148 m, while there were slight variations in meteorological variables (Table 1).
PCA with varimax rotation and component extraction with eigenvalues ≥1.0 yielded 4 principal components (PC) collectively accounting for 77% variation in the soil attribute data. PC1 contained 6 soil properties (clay, sand, silt, CaCO3, K and P) with correlation coefficients ≥0.7 (Table 3). All soil properties in PC1 except for sand negatively affected the distribution of orchards in the scatter plot. PC2 was positively influenced by organic matter content. Third and fourth PCs
Table 3 - Factor loading of first four axis of Principal Component Analysis (PCA) made of soil properties data of
surveyed orchards
PC1 PC2 PC3 PC4
C -0.5369 0.8080 0.0917 0.0214
OM -0.5369 0.8080 0.0917 0.0214
Clay -0.8884 -0.1192 0.0326 0.0691
Sand 0.9271 0.1044 -0.1278 0.2122
Silt -0.7114 -0.0448 0.1683 -0.4251
Na -0.5269 -0.1121 0.4266 0.2856
CaCO3 -0.8411 -0.1737 0.0444 0.1099
K -0.8106 0.0260 -0.3969 0.1567
P 0.1615 0.0377 0.5508 0.6705
pH -0.2038 -0.4135 0.6297 -0.3598
EC -0.7427 -0.2807 -0.3778 0.1199
AS -0.3581 -0.4194 -0.1811 0.3836
Eigenvalue 5.1208 1.8035 1.2793 1.0901
Variability (%) 42.6735 15.0291 10.6608 9.0843 Cumulative (%) 42.6735 57.7026 68.3633 77.4477
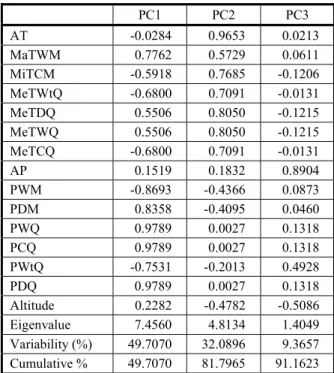
Table 4 - Factor loading of first three axis of Principal Component Analysis (PCA) made of meteorological data of
surveyed orchards
PC1 PC2 PC3
AT -0.0284 0.9653 0.0213
MaTWM 0.7762 0.5729 0.0611
MiTCM -0.5918 0.7685 -0.1206
MeTWtQ -0.6800 0.7091 -0.0131
MeTDQ 0.5506 0.8050 -0.1215
MeTWQ 0.5506 0.8050 -0.1215
MeTCQ -0.6800 0.7091 -0.0131
AP 0.1519 0.1832 0.8904
PWM -0.8693 -0.4366 0.0873
PDM 0.8358 -0.4095 0.0460
PWQ 0.9789 0.0027 0.1318
PCQ 0.9789 0.0027 0.1318
PWtQ -0.7531 -0.2013 0.4928
PDQ 0.9789 0.0027 0.1318
Altitude 0.2282 -0.4782 -0.5086
Eigenvalue 7.4560 4.8134 1.4049
Variability (%) 49.7070 32.0896 9.3657
Cumulative % 49.7070 81.7965 91.1623
contained none of the soil properties with correlation coefficient ≥0.7. However, pH and P were the most influential soil attributes with correlation coefficients ≥0.6 on the third and fourth PC, respectively (Table 3). Scatter plot of the first two principal components segregated orchards in three distinct groups: i) organic matter rich soils; ii) sand and relatively P rich soils and iii) silt, clay, K, CaCO3, EC, pH rich soils with relatively higher Na and aggregate stability (Figure 1). There were large variations in some of the soil characteristics even if collected from two adjacent orchards. The results suggest that all soil properties except aggregate stability and Na content might have influenced the distribution of weeds.
PCA of meteorological attributes resulted in three principal components with eigenvalues
≥1.0 accounting for 91% variation in the data. The first PC generally contained precipitation and some temperature parameters with correlation coefficients ≥0.7. The second PC contained temperature attributes, whereas the third PC contained only annual precipitation (Table 4). The scatter plot of the first two axis of PCA yielded two distinct groups of the surveyed orchards on the basis of temperature and rainfall. The orchards of the first group had similar temperature parameters while the second group consisted of orchards with similar parameters of precipitation and altitude (Figure 2).
Correlation of weed density and soil properties
correlated with P content followed by clay (7 species), sand and K (6 species), CaCO3 and EC (5 species). The remaining soil properties except aggregate stability (AS) were correlated with 3 weed species whereas AS was correlated with only two weeds. The correlation between soil properties and weed species indicated that the soil properties had significant impact on the distribution of the observed weeds.
Correlation of weed density and meteorological variables
Correlation test between weed species and meteorological variables indicated significant positive or negative correlations of 18 and 9 weed species observed in spring and autumn seasons, respectively. The meteorological variables having the highest correlations with weed species were annual average temperature (AT), precipitation of the driest month (PDm), precipitation of the wettest quarter (PWtQ), precipitation of the coldest quarter (PCQ), precipitation of the driest quarter (PDQ) and altitude (each of the indicators was correlated with 8 weed species), whereas annual precipitation (AP) was correlated with only 3 weed species. The correlation between weed species and meteorological indicators suggested that climatic variables also had a significant effect on the distribution of weed communities of the surveyed orchards.
Correlation between weed vegetation and soil properties/weather attributes
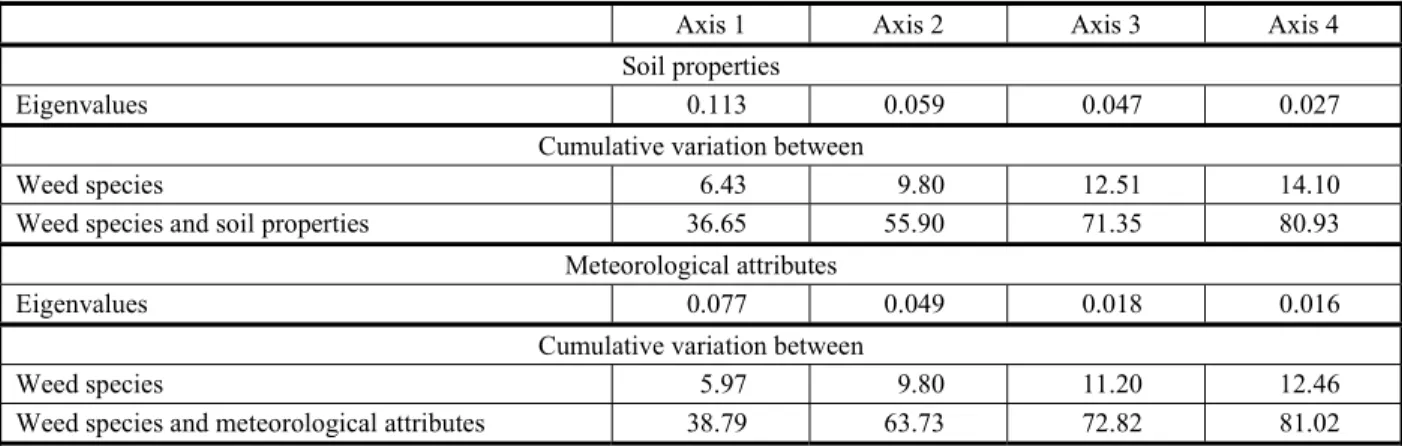
CCA for assessment of the relationship between soil properties and weed species resulted in 81% cumulative variation in the first four axes. The first two axis of the CCA ordination collectively accounted for 56% of the total variation (Table 5). Three distinct groups of weed species were observed as a result of CCA; each one was correlated with different soil attributes. Sand, silt and P contents had the strongest effect on weed distribution. The first group was composed of the species positively correlated with P and OM. The second group in the ordination diagram consisted of the species which prefer light soils, whereas the third group of the weed communities was composed of the species which prefer medium to heavy soils, rich in K and with high pH and Na concentration (Figure 3).
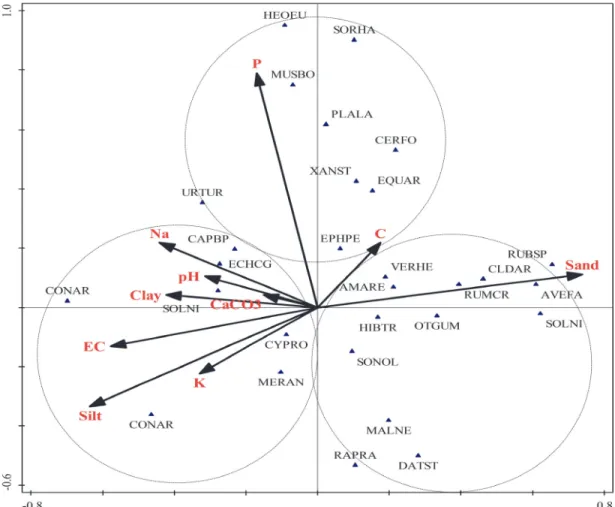
CCA on weed species and meteorological indicators accounted for 81% variation in the first four axes while the first two axes contributed to 64% of variation (Table 5). Ordination diagram segregated the weed communities into two groups; one negatively correlated with temperature and positively correlated with PDM and altitude. The second group was composed of the species that were negatively correlated with precipitation features (Figure 4). Most of the weed species were almost equally affected by all the meteorological variables.
Distribution and establishment of weed communities are affected by several factors including soil properties and weather attributes (Fried et al., 2008; Pinke et al., 2010; Lousade et al., 2013). Preference of a weed species for a particular soil property may increase or decrease density on different soils which are poor or rich in that particular soil property, respectively.
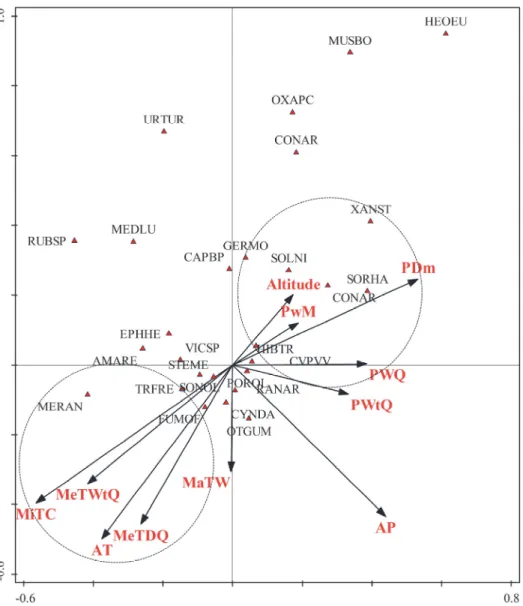
Table 5 - Eigenvalues and variation explained by CCA for correlation among weed species and soil properties, and weed species and meteorological attributes
Axis 1 Axis 2 Axis 3 Axis 4
Soil properties
Eigenvalues 0.113 0.059 0.047 0.027
Cumulative variation between
Weed species 6.43 9.80 12.51 14.10
Weed species and soil properties 36.65 55.90 71.35 80.93
Meteorological attributes
Eigenvalues 0.077 0.049 0.018 0.016
Cumulative variation between
Weed species 5.97 9.80 11.20 12.46
The arrows represent effect size. The names of weed species are given as Bayer codes. Complete names and Bayer codes of the species are given in Table 2. Abbreviations of the soil properties are also represented in Table 1.
Figure 3 - CCA ordination diagram representing the correlation between weed species and soil properties.
Patchy distribution of weeds in arable fields and orchards is due to preference of weeds for a particular soil property (Otto et al., 2007). CCA explained 81% of variation in the region, indicating that some other factors also influence weed distribution. The ignored factors might possibly be weed management practices, variation in tillage, irrigation, fertilization and other agricultural practices employed by farmers. The allelopathic effect of weed species on one another might be another ignored aspect in the current study as some weeds have an inhibiting effect on the germination of other weeds (Farooq et al., 2011; Jabran et al., 2015; Shahzad et al., 2016a). Phosphorus, sand and silt contents were the most influential soil variables which affected weed distribution. Phosphorus is an essential nutrient for plant growth and can strongly affect growth
and biomass accumulation. The correlation of weeds such as S. halepense, Muscari comosum,
Plantago lanceolata, Heliotropium europaeum, Cerastium fontanum and Xanthium strumarium etc. with P indicate that these weeds prefer P rich soils for their establishment and spread. Higher weed coverage and density on P rich soils have also been reported by Iwara et al. (2011). Although
significant correlation between C. rotundus density and high P contents has been reported by
Shiratsuchi et al. (2005); there was higher affinity for K contents than P contents in the present study.
There was a higher number of weeds on the soils with higher sand contents. Avena fatua,
Rubus spp., Rumex crispus and Convolvulus arvensis were observed on the sandy soils, whereas
The arrows represent effect size. The names of the weed species are given as Bayer codes. Complete names and Bayer codes of the species are given in Table 2. Abbreviations of the weather attributes are also represented in Table 1.
Figure 4 - CCA ordination diagram representing the correlation between weed species and weather attributes.
CCA on weed vegetation data and meteorological variables explained 81% of variation in the surveyed region. Annual temperature and annual precipitation were the most significant variables which influenced weed distribution. Altitude was also correlated with some weed species. Temperature and rainfall have been considered as the main determinants of weed boundaries (Tanaka et al., 2010; Belnap et al., 2016). Different plant species and weeds have distinct soil and climatic requirements and both factors can strongly mediate the distribution patterns at different spatial and landscape scales (Udoh et al., 2007). Overall, there was no indicator that the weed species strictly adhered to a specific weather attribute. The cosmopolitan nature of the weeds and agronomic practices such as irrigation and fertilizer application etc. might be responsible for the results of the present study.
conditions, especially rainfall and temperature, on-farm management practices such as irrigation, fertilization, weed management practices (herbicides, tillage etc.) must be taken into account for site-specific weed management. Furthermore, alternative and eco-friendly weed management options such as allelopathy should also be considered for future weed management programs.
ACKNOWLEDGEMENT
This study was funded by the Scientific Research Projects Council of Gaziosmanpasa University under grant number BAP-2009/05.
REFERENCES
Akdeniz M. et al. Problems in Weed management and Solutions Opted by Citrus Growers in Mugla Province of Turkey. J Bahri
Dagdas Crop Res. 2015;4(2):38-49. (In Turkish)
Alignier A., Bretagnolle V., Petit S. Spatial patterns of weeds along a gradient of landscape complexity. Basic Appl Ecol.
2012;13(4):328-37.
Allison L.E., Moodie C.D. Carbonate. In: Black, C.A. editor. Methods of soil analysis. Madison: American Society of Agronomy, Crop Science Society of America and Soil Science Society of America, 1965. p.1379-400.
Arikan L. et al. Determination of prevalence and densities of weeds observed in citrus orchards of Antalya province. Turk J Weed Sci. 2015;18(2):12-22. (In Turkish)
Belnap J. et al. Soil moisture and biogeochemical factors influence the distribution of annual Bromus species, In: Germino M.J., Chambers J.C., Brown C.S. editors. Exotic brome-grasses in arid and semiarid ecosystems of the western US. Springer International Publishing, 2016. p.227-56.
Bensellam E.H., Bouhach M., Taleb A. Study of weeds in citrus orchard of Gharb region of Morocco. Weed Res. 1997;37:201-10 Bhatt M.D., Singh S.P. Soil seed bank dynamics of weed flora in upland and lowland paddy cultivation areas of far western Nepal.
Sci World. 2007;5:54-9.
Borgy B. et al. Non–random distribution of weed species abundance in arable fields. Weed Res. 2012;52:383-9.
Boutin C., Baril A., Martin P.A. Plant diversity in crop fields and woody hedgerows of organic and conventional farms in contrasting landscapes. Agric Ecosyst Environ. 2008;123:185-93.
Bouyoucos G.J. Hydrometer method improved for making particle size analysis of soils. Agron J. 1962;54:464-5. Brandes D. Sociology and ecology of Oxalis pes–caprae L. in the Mediterranean region with special attention to Malta.
Phytocoenologia. 1991;19:285-306.
Broadbent F.E. The soil organic fractions. Adv Agron. 1953;5:153-83.
Buhler D.D., Liebman M., Obrycki J.J. Theoretical and practical challenges to an IPM approach to weed management. Weed Sci.
2000;48:274-80.
Cardina J., Johnson G.A., Sparrow D.H. The nature and consequence of weed spatial distribution. Weed Sci. 1997;45:364-73. Cerdà A., Morera A.G., Bodí M.B. Soil and water losses from new citrus orchards growing on sloped soils in the western Mediterranean basin. Earth Surf Process Landf. 2009;34:1822-30.
Chen X. et al. Ecological role of weeds conserved in orchard in red soil hilly area during hot-dry season. Chinese J Ecol.
2002;22:38-42.
Chen X. et al. Approach to weed diversity conservation and its effects of soil conservation. Chinese J Weed Sci. 1999;(4):5-8. (In Chinese with English abstract).
Dieleman J.A. et al. Identifying associations among site properties and weed species abundance. I. Multivariate analysis. Weed Sci. 2000a;48:567-75.
Dieleman J.A. et al. Identifying associations among site properties and weed species abundance. II. Hypothesis generation. Weed Sci. 2000b;48:576-87.
Farooq M. et al. The role of allelopathy in agricultural pest management. Pest Manage Sci. 2011;67:493-506.
Fried G., Norton L.R., Reboud X. Environmental and management factors determining weed species composition and diversity in France. Agric Ecosyst Environ. 2008;128:68-76.
Gaston L.A. et al. Spatial variability of soil properties and weed populations in the Mississippi Delta. Soil Sci Soc Am J.
2001;65:449-59.
Global Invasive Species Database – GISD. Species profile: Poa annua. (accessed on: 29 Apr. 2016). Available at: http:// www.iucngisd.org/gisd/species.php?sc=1418
Heneidy S.Z., Bidak L.M. Multipurpose plant species in Bisha, Asir region, southwestern Saudi Arabia. J King Saud Uni Sci.
2001;13:11-26.
Herrick J.E. Soil quality: an indicator of sustainable land management? Appl Soil Ecol. 2000;15(1):75-83.
Hijmans R.J. et al. Very high resolution interpolated climate surfaces for global land areas. Int J Climatol. 2005;25:1965-78. Holmes R.J., Froud-Williams R.J. Post-dispersal weed seed predation by avian and non–avian predators. Agric Ecosyst Environ.
2005;105:23-7.
Iwara A.I. et al. Influence of soil physico–chemical properties on the distribution of woody tree/shrub species in South–Southern Nigeria. J Agric Sci. 2011;2:69-75.
Jabran K. et al. Allelopathy for weed control in agricultural systems. Crop Prot. 2015;72:57-65.
James J.J. et al. Influence of resource pulses and perennial neighbors on the establishment of an invasive annual grass in the Mojave Desert. J Arid Environ. 2006;67:528-34.
Kemper W., Rosenau R. Aggregate stability and size distribution. In: Klute A., editor. Methods of soil analysis; Physical and mineralogical methods. Madison: Society of Agronomy and Soil Science Society of America, 1986. Pt.1. p.425-42. (Agronomy Monograph, 9).
Kenkel N.C. et al. Multivariate analysis in weed science research. Weed Sci. 2002;50:281-92.
Korres N.E. et al. Distribution of arable weed populations along eastern Arkansas Mississippi Delta roadsides: occurrence, distribution, and favored growth habitats. Weed Technol. 2015a;29:587-95.
Korres N.E. et al. Distribution of arable weed populations along eastern Arkansas-Mississippi Delta roadsides: factors affecting weed occurrence. Weed Technol. 2015b;29:596-604.
Leps J., Smilauer P. Multivariate analysis of ecological data using CANOCO. Cambridge: Cambridge University Press, 2003. Lousada L.L. et al. Correlation of soil properties with weed occurrence in sugarcane areas. Planta Daninha. 2013;31:765-75. Macharia I. et al. Weed species in tomato production and their role as alternate hosts of Tomato spotted wilt virus and its vector
Frankliniella occidentalis. Ann Appl Biol. 2016;169:224-35.
Nelson D.W., Sommers L.E. Total carbon, organic carbon, and organic matter. In: Page A.L., Miller R.H., Keeney D.R., editors.
Methods of Soil Analysis; Chemical and microbiological properties.Madison: American Society of Agronomy, 1982. Pt 2.
p.539-79. (Agronomy Monograph, 9).
Olsen S.L., Sommers L.E. Phosphorus. In: Page A.L., Miller R.H., Keeney D.R., editors. Methods of soil analysis; Chemical and microbiological properties. Madison: American Society of Agronomy, 1982. Pt 2. p.403-27. (Agronomy Monograph, 9).
Otto S. et al. A modelling approach using seedbank and soil properties to predict the relative weed density in organic fields of an Italian pre alpine valley. Weed Res. 2007;47:311-26.
Özer Z. et al. Some important weeds of turkey (Definition and Chemical Management). Tokat: Gaziosmanpasa University, Faculty of Agriculture Publications, 1999. (Publications, 38, Book, 16) (In Turkish)
Özer Z. et al. Herboloji (Weed Science). Tokat: Gaziosmanpasa University, Faculty of Agriculture Publications 2001. (Publications, 20, Series, 10)
Petit S., Fried G. Patterns of weed co–occurrence at the field and landscape level. J Veg Sci. 2012;23:1137-47.
Pinke G., Pál R., Botta-Dukát Z. Effects of environmental factors on weed species composition of cereal and stubble fields in western Hungary. Cent Eur J Biol. 2010;5(2):283-92.
Rankins A.Jr. et al. Survey of soybean weeds in Mississippi. Weed Technol. 2005;19:492-8.
Raunkiaer C. The life-forms of plants and statistical plant geography. Oxford: University Press, 1934.
Rhoades J.D. Cation exchange capacity. In: Page A.L., Miller R.H., Keeney D.R., editors. Methods of soil analysis. Madison: American Society of Agronomy, 1982. Pt. 2. p.149-57. (Agronomy Monograph, 9).
Roschewitz I. et al. The effects of landscape complexity on arable weed species diversity in organic and conventional farming. J
Appl Ecol. 2005;42:873-82.
Sans F.X., Masalles R.M. Phenological patterns in an arable land weed community related to disturbance. Weed Res.
1995;35:321-32.
Shahzad M. et al. Impact of different crop rotations and tillage systems on weed infestation and productivity of bread wheat.
Crop Prot. 2016b;89:161-9.
Shahzad M., Farooq M., Hussain M. Weed spectrum in different wheat-based cropping systems under conservation and conventional tillage practices in Punjab, Pakistan. Soil Till Res. 2016a;163:71-9.
Shehata H.S., Galal T.M. Factors affecting the distribution and associated species of Malva parviflora in the Nile Delta, Egypt.
Weed Biol Manage. 2015;15:42-52.
Shiratsuchi L.S., Fontes J.R.A., Resende A.V. Correlação da distribuição espacial do banco de sementes de plantas daninhas com a fertilidade dos solos. Planta Daninha. 2005;23:429-36,
Shirgure P.S. Research review on Irrigation scheduling and water requirement in citrus. Sci J Rev. 2013;2:113-21.
Sperry J.S., Hacke U.G. Desert shrub water relations with respect to soil characteristics and plant functional type. Funct Ecol. 2002;16:367-78.
Tanaka S., Miura R., Tominaga T. Small scale heterogeneity in the soil environment influences the distribution of lawn grass and weeds. Weed Biol Manag. 2010;10:209-18.
Thomas G.W. Exchangeable cations. In: Page A.L., Miller R.H., Keeney D.R. editors. Methods of soil analysis. Madison: American Society of Agronomy, 1982. Pt. 2. p.159-65. (Agronomy Monograph, 9).
Udoh B.T., Ogunkunle A.O., Ndaeyo N.U. Influence of soil series and physico–chemical properties on weed flora distribution at moor plantation Ibadan, southwestern Nigeria. J Agric Soc Sci. 2007;3:55-8.
Yirefu F., Tana T. Qualitative and quantitative assessment of weeds in the sugarcane plantations of Wonji-Shewa and Matahara.