Licenciado sob uma Licença Creative Commons DO): http://dx.doi.org/ . / - . . .AO
[T]
Electromyographic normalization of vastus lateralis and biceps
femoris co-contraction during gait of elderly females
[)]
Normalização eletromiográi ca da co-contração do vasto
lateral e bíceps femoral durante a marcha de idosas
[A]Katy Andrade Monteiro Zacaron[a, b], João Marcos Domingues Dias[b, c], Mariana Asmar Alencar[b, d], Luane Landim de Almeida[e], Carlos Alberto Mourão-Júnior[a], Rosângela Correa Dias[b, c]*
[a] Universidade Federal de Juiz de Fora UFJF , Juiz de Fora, MG, Brazil [b] Universidade Federal de Minas Gerais UFMG , Belo (orizonte, MG, Brazil [c] Universidade Federal de São Paulo UN)FESP , São Paulo, SP, Brazil
[d] Universidade Fundação Mineira de Educação e Cultura FUMEC , Belo (orizonte, MG, Brazil [e] Faculdade de Ciências Médicas e da Saúde de Juiz de Fora FCMS/JF , Juiz de Fora, MG, Brazil
[R]
Abstract
Introduction: Analyze muscle co-contraction using electromyographic signals, which are normalized to
compare individuals, muscles and studies. Maximum voluntary isometric contraction MV)C and peak elec-trical activity PEA during movement are the most widely used forms of normalization. Objective: Compare
inter-subject variability and investigate the association between the co-contraction indices of the vastus lateralis and biceps femoris during gait, normalized by MV)C and PEA. Methods: Thirty elderly women, aged . ± . years took part. Electrical muscle activity during MV)C and gait was recorded using a Biopac MP electromyograph. MV)C was performed in a Biodex isokinetic dynamometer. For normalization, the signals were divided by the Root Mean Square values of MV)C and PEA of gait. Results: The coef icient
of variation of non-normalized data was . %, and those normalized by PEA and MV)C were . % and
*KAMZ: MS, e-mail: katy.andrade@u jf.edu.br JMDD: PhD, e-mail: [email protected]
788
. % respectively. Linear regression analysis resulted in a prediction model: PEA = . + . x MV)C. The goodness of it of the regression model was statistically signi icant p= . . The con idence interval % C) for the intercept was between . and . and for MV)C between . and . . Conclusions: The data
normalized by PEA showed less variation than those normalized by MV)C. A % variation in data normal-ized by MV)C resulted in a % variation in data normalnormal-ized by PEA, while variation in normalization by MV)C accounts for % of the variation in normalization by PEA and vice versa.
Keywords: Muscle Contraction. )sometric Contraction. Reproducibility of Results. Muscle Strength
Dynamometer. Electromyography.
Resumo
Introdução: Analisa-se co-contração muscular através dos sinais eletromiográϔicos, os quais são normalizados para permitir comparação entre indivíduos, músculos e estudos. A contração voluntária máxima isométrica (CVMi) e o pico da atividade elétrica (PAE) durante o ato motor são as formas de normalização mais utilizadas. Objetivos: Comparar a variabilidade inter-sujeitos e investigar a associação entre os índices de co-contração, do vasto lateral e bíceps femoral durante a marcha, normalizados pela CVMi e PAE. Métodos: Participaram 30 idosas, idade 70,33 ± 3,69 anos. A atividade elétrica dos músculos durante a CVMi e na marcha foi registrada pelo eletromiógrafo Biopac MP100. A CVMi foi realizada no dinamômetro isocinético Biodex. Para normaliza-ção, os sinais foram divididos pelos valores do Root Mean Square da CVMi e pelo PAE da marcha. Resultados: O coeϔiciente de variação dos dados não normalizados foi 69,3%, e dos normalizados pelo PAE e CVMi foram 30,4% e 48,9% respectivamente. A análise de regressão linear produziu o modelo de predição: PAE = 0,04 + 0,16 x CVMi. O ajuste do modelo de regressão foi estatisticamente signiϔicante (p=0,02). O intervalo de conϔiança (IC95%) para o intercepto foi de 0,02 a 0,29 e para a CVMi foi de 0,03 a 0,06. Conclusão: Os dados normaliza-dos pelo PAE apresentaram menor variação que os normalizanormaliza-dos pela CVMi. Uma variação de 100% nos danormaliza-dos normalizados pela CVMi resulta em 16% de variação nos dados normalizados pelo PAE, enquanto a variação da normalização pela CVMi é responsável por 17% de variação da normalização pelo PAE e vice-versa.
Palavras-chave: Contração Muscular. Contração Isométrica. Reprodutibilidade dos Testes. Dinamômetro de Força Muscular. Eletromiograϔia.
Introduction
Muscle co-contraction is the simultaneous con-traction of two or more antagonist muscles around a joint - . This phenomenon has been used to qualitatively and quantitatively assess human motor behavior in different situations such as gait, reach, jump and stability disorders , .
Advancing age prompts greater muscle co-con-traction. One possible explanation for this inding is that co-contraction is a form of compensation for the reduction in muscle strength and atrophy of muscle
ibers that accompany aging , .
Surface electromyography EMG , an ef icient tool to assess muscle activity, is also used for quantita-tive and qualitaquantita-tive evaluation of the co-contraction. The signal captured and recorded by this instrument corresponds to the sum of action potentials of motor
units generated by voluntary and re lex muscle ac-tion, captured by electrodes placed on the surface of muscles - .
One of the greatest obstacles to using this tech-nique is the natural variability of electrical signals between individuals and muscles. Normalization, involving the expression of EMG data in relation to percentage of a reference value during a standardized and reproducible condition , , , is a prereq-uisite for reducing the intrinsic and extrinsic factors that contribute to signal variability. This procedure makes it possible to compare EMG data between individuals, muscles, different collection days and different studies , - .
and thoroughly reviewed , - . Of these, the most frequently investigated are maximum voluntary isometric contraction MV)C , and peak elec-trical activity PEA during the speci ic motor act.
MV)C, the most widely used in research , , , , , is the normalization method suggested by the guide entitled Surface Electromyography for the Non-)nvasive Assessment of Muscles SEN)AM . )t allows us to determine the percentage of muscle ac-tivation in relation to its maximum capacity %
, . (owever, MV)C depends on the maximum recruitment of all the motor units which, in turn, de-pends on a number of factors, such as the individual’s training level, ability to activate the muscle , , understanding, motivation and pain level , , . Furthermore, MV)C is performed in a condition of isometry, while dynamic activities encompass cycles of concentric and eccentric activations that require specialized equipment, and prolonged collection times , , , - .
For this reason, recent years have seen consider-able investment in incorporating MV)C normalization as the predominant, with a number of studies pub-lished on alternative models to MV)C normalization in dynamic activities, including average or submaxi-mal activations during speci ic dynamic activities ,
- , , , , , , , submaximal isometric contractions , as well as maximal and isokinetic submaximal contractions , , .
By contrast, normalization by peak electrical activity PEA during the speci ic motor act has been suggested by some investigators as an alternative for normalizing electromyographic signals during analysis of a dynamic event , - . Normalization by PEA also reduces collection time and makes normalization possible in studies with children and populations unable to per-form MV)C owing to cognitive impairment, neurological or musculoskeletal disease , , .
Given the importance of measuring co-contraction in the study of human movement and establishing uniformity in the procedures used in electromyo-graphic studies, it is necessary to determine the asso-ciation between different normalization techniques, in order to con irm the comparisons made between studies using different techniques. Therefore, this study aimed to compare inter-subject variability be-tween co-contraction indices of the vastus lateralis
VL and biceps femoris BF muscles, normalized by MV)C and PEA, during gait in the elderly, and investi-gate the association between these indices.
Methods
This cross-sectional exploratory study was ap-proved by the research ethics committee of the Federal University of Minas Gerais protocol no.
/ .
Sample
This is a non-probability convenience sample in which sampling size was not calculated. Sampling criteria were accepting to take part and meeting in-clusion and exin-clusion criteria. A total of commu-nity-dwelling elderly women, aged between and
years, and able to walk without an assistive gait device, participated in the study. They were recruited from the Physical Education in the Elderly Project Projeto Educação Física na a idade conducted at the School of Physical Education, Physical Therapy and Occupational Therapy of the Federal University of Minas Gerais UFMG . All participants met the fol-lowing inclusion criteria: age greater than or equal to
years, absence of acute neurological or rheumatic diseases, no history of hip or knee surgery, absence of cognitive impairment that compromises under-standing of the tests, hip range of motion of at least
º, º knee lexion and º extension and absence of lower limb pain.
All participants gave their informed consent to take part in the study.
Instrumentation
An MP WSW electromyograph Biopac Systems®, Goleta, California was used to monitor the electrical activity of vastus lateralis VL muscles, consisting of the knee extensors , , , and bi-ceps femoris BF , consisting of the knee lexors ,
. This device has two ampli iers connected to a microcomputer. The ampli iers have inlet impedance of mega Ohms MΩ and a Common Mode Rejection capacity of MΩ. Two active surface electrodes Ag/AgCl – . mm diameter - TSD- A - Biopac System , with bipolar con iguration were placed cm between the detection surfaces.
790
Data Reduction
Acqknowledge® software Biopac Systems. Goleta, California was used to process and analyze electro-myographic activity. Electroelectro-myographic signals were collected at (z with (z high-pass ilters and (z low-pass ilters , , , , then recti ied and iltered Butterworth - linear envelope with a
(z low-pass , .
The signals were normalized in two ways: by the Root Mean Square obtained in MV)C and PEA of the same muscle and participant. The mean co-con-traction value was obtained using a speci ic program in MATLAB®, proposed by Fonseca et al. , where the common area between the muscle activity curves of the muscle groups that were in simultaneous con-traction was identi ied and quanti ied. This area was obtained by overlapping the electromyographic activ-ity proportion curves of the muscles tested.
Statistical Analysis
Normal distribution of the variables was tested and con irmed by the Kolmogorov-Smirnov test.
Descriptive statistical analysis of anthropometric, demographic and co-contraction variables was con-ducted. )n the case of co-contraction, coef icients of variation CV were also calculated.
To investigate the association between co-contraction normalized by MV)C and PEA, the data were plotted on a dispersion diagram in order to verify the existence of a tendency to correlation. Based on the tendency to linear-ity observed, a liner model simple regression was it to estimate the possibility of prediction. )n this model, nor-malization by PEA was considered the dependent vari-able and by MV)C the independent varivari-able. Analysis of residues was carried out after all the conditions required for regression analysis were met. The coef icient of de-termination R was also calculated to check the extent to which variation in normalization by MV)C explains the variation in normalization found by PEA.
A signi icance level of p < . was adopted. Analyses were performed using the GraphPad Prism
. statistical package.
Results
Of the elderly assessed, did not take part in the study for the following reasons: presence of Procedure
The participants were instructed to appear for testing, conducted on a single day, with clean skin, free of oil or moisturizers.
To characterize the sample, subjects were as-sessed for anthropometric and clinical aspects including age, body weight, height, body mass in-dex and physical activity level, according to the American College of Sports Medicine ACSM , which considers as active those who engage in moderate physical activity for at least minutes on most days of the week. To warm up, participants pedaled a stationary bicycle Ergo–Fit , Baujahr, for minutes at a comfortable speed . After participants’ skin was cleaned using cot-ton soaked in alcohol, the active surface electrode pairs were placed in accordance with Criswell . The grounding electrode was placed on the head of the ipsilateral fibula . The data were collected only on the dominant lower limb, defined as that which the individual uses to kick a ball.
To familiarize the subjects, they were asked to walk comfortably at a normal self-selected speed for a distance of m, in a straight line on a flat even surface. After familiarization, electrical muscle ac-tivity was collected during gait using EMG.
)mmediately following collection of muscle ac-tivity, participants were seated on the isokinetic dynamometer for MV)C tests of the VL and BF with their trunk, pelvis and thighs stabilized and legs dangling, with a distance of cm between the edge of the chair and popliteal fossa of cm. The rotational axis of the device was aligned with the lateral epicondyle of the femur and the arm of the lever fixed above the lateral malleolus. To obtain data for normalization of the electromyo-graphic signals, subjects underwent MVC of the VL and BF muscles, in the isometric mode of the dynamometer, with the knee flexed at and °, respectively. Four -second VL contractions were performed minute apart. The first of these was submaximal, aimed at familiarization. After min-utes, the same procedure was conducted for BF muscles. Repetitions were monitored using EMG and, of the three maximal contractions, that which generated the greatest electromyographic activity of each muscle was analyzed.
goodness of it of the regression model was statis-tically signi icant p = . . The con idence level
% C) for the intercept was from . to . and for MV)C from . to . . These results sug-gest that an increase of unit in MV)C corresponds to a rise of . in PEA, that is, a % variation in MV)C corresponds to only % in PEA. These data are consistent with the coef icient of determination found R = % . The dispersion diagram, straight line of regression and the respective % con idence intervals are presented in Figure .
Figure 2 - Dispersion diagram and straight line of regression (with the respective 95% confidence intervals) howing the level of co-contraction normalized by peak electrical activity (PEA) and maximum voluntary isometric contraction (MVIC) (n = 30) in gait.
Note: Study data.
Discussion
Given that an absence of adequate familiarization can cause a to % loss of MV)C capacity , par-ticular care was taken to familiarize the volunteers, eliminating inadequate data.
Since the objective was to collect maximal elec-trical muscle activity during MV)C, the position ad-opted in this study aimed at exposing the muscles tested to a condition of shortened active insuf iciency, such that the muscle recruited the maximum num-ber of motor units to generate MV)C , ensuring an electromyographic recording that revealed the maximum possible contraction. Rutherford et al. , however, in a study aimed at verifying the existence of a difference in the amplitude of electrical activity during a series of maximal contractions at various neurological disease , acute rheumatic disease
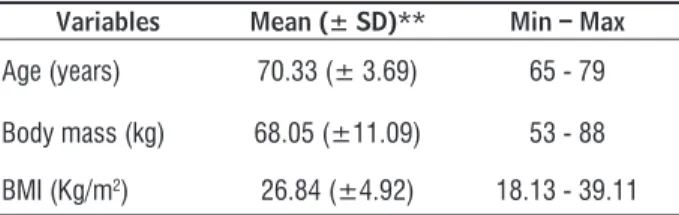
, previous hip surgery , previous knee sur-gery , and presence of cognitive impairment that compromises the tests . Thus, the inal sample consisted of elderly women. The anthropometric aspects of the participants are described in table .
Table 1 - Anthropometric aspects of the sample (n = 30) Variables Mean (± SD)** Min – Max
Age (years) 70.33 (± 3.69) 65 - 79
Body mass (kg) 68.05 (±11.09) 53 - 88
BMI (Kg/m2) 26.84 (±4.92) 18.13 - 39.11
Note: SD: standard deviation; BMI: body mass index. Source: Study data.
According to the ACSM, . % of the partici-pants were classi ied as active and . % seden-tary. Electromyographic data showed no outliers. Descriptive statistical analysis mean ± SD and CV of non-normalized co-contraction were . ± . CV = . % . Normalization by PEA and MV)C were . ± . CV = . % and . ± . CV = . % , respectively. The CV results are illustrated in Figure , which shows that the variation in data normalized by PEA was visibly lower than that pro-duced by normalization using MV)C.
Figure 1 - Variations in vastus lateralis and biceps femoris co-contraction levels during gait, normalized by peak electri-cal activity (PEA) and maximal voluntary isometric contrac-tion (MVIC) (n = 30).
Note: Study data.
792
knee angles and body positions, concluded that the greatest VL activation occurred at an amplitude of º knee lexion in the sitting position or º knee lexion in the supine position. The same authors con-cluded that the highest FB activation occurred at an angle of º knee lexion in the supine position. The study, however, did not assess positions that placed muscles in shortened active insuf iciency. Therefore, the choice of angle and position for MV)C may cause a methodological error, requiring further studies to determine the best position for maximum electrical activation of each muscle.
Given that inter-subject CV is inversely related to reproducibility, this index has been widely used in studies on the normalization of EMG data, and as a criterion for selecting a particular normalization method , - , , , . The inter-subject CV values of the present study showed that both forms of normalization reduced the variation in data when compared with non-normalized data. (owever, nor-malization by PEA exhibited a lower CV than that of MV)C. These results are in line with those reported in a number of studies showing less inter-subject variability with normalization by PEA compared with MV)C or other normalization methods - , , . This led some authors to consider PEA more appropriate in representing data , while oth-ers report that a lower CV is not necessarily good, since variability is necessary to identify differences . Moreover, even though PEA is a viable method for normalizing EMG data of patients with pain and neurological disorders, it tends to produce an elec-tromyographic pattern that may infer unreal group homogeneity by removing real biological variations in EMG iles during various activities, including gait
, , , , .
Furthermore, since PEA is obtained during the task under study, it does not provide the researcher or specialist with the required degree of muscle ac-tivation during gait or some other task, in relation to what the muscle is capable of generating , - . The only methods with the potential to reveal this information are normalization by maximal volun-tary isometric or isokinetic contractions , , ,
, but both have exhibited higher CV in studies, primarily the latter , . Although the former conserves the natural biological variability of EMG
data, it can cause discomfort, in addition to depend-ing on psychological factors , , and training of individuals , . Because of this dif iculty in controlling and monitoring the participant`s exertion, it might not generate the maximum activity possible. This will result in higher EMG values than those nor-malized by PEA and also impacts the CV, which is signi icantly affected by the way in which MV)C is processed , , .
The prediction model generated by linear regression showed that a % variation in data normalized by MV)C results in only a % variation in data normalized by PEA, and that the variation in normalization by MV)C accounts for only % of the variation in normalization by PEA and vice versa. These indings demonstrate the need for caution when comparing studies that used dif-ferent techniques to normalize data , .
No studies were found that clearly described the prediction models used for data normalization. Therefore, it was not possible to compare these re-sults. Nevertheless, we suggest that to make com-parisons between EMG data from VL and FB co-contraction normalized by MV)C during gait and those normalized by PEA, conversion must irst be performed using the prediction model obtained.
Conclusions
References
. Nardo FD, Mengarelli A, Maranesi E, Burattini L, Fio-retti S. Assessment of the ankle muscle co-contrac-tion during normal gait: A surface electromyography study. J Electromyogr Kinesiol. ; : - . . Lametti DR, (oule G, Ostry DJ. Control of
move-ment variability and the regulation of limb imped-ance. J Neurophysiol. ; : - .
. Fonseca ST, Silva PLP, Ocarino JM, Ursine PGS. Análise de um método eletromiográ ico para quanti icação de co-contração muscular. Rev Bras Cien e Mov.
; : - .
. Fallah-Yakhdani (R, Abbasi-Bafghi (, Meijer OG, Bruijn SM, van den Dikkenberg N, Benedetti MG, et al. Determinants of co-contraction during walking before and after arthroplasty for knee osteoarthritis. Clin Biomech. ; : - .
. Lee ((, Lin CW, Wu (W, Wu TC, Lin CF. Changes in biomechanics and muscle activation in injured ballet dancers during a jump-land task with turnout. J Sports
Sci. ; : - .
. Wang Y, Watanabe K, Asaka T. Age effects on multi-muscle modes during voluntary body sway. Res Sports
Med. ; : - .
. Nelson-Wong E, Appell R, McKay M, Nawaz (, Roth J, Sigler R, et al. )ncreased fall risk is associated with elevated co-contraction about the ankle during static balance challenges in older adults. Eur J Appl Physiol.
; : - .
. Merletti R, Aventaggiato M, Botter A, (olobar A, Marateb (, Vieira TM. Advances in surface EMG re-cent progress in detection and processing techniques. Crit Rev Biomed Eng. ; : - .
. Kellis E, Katis A. (amstring antagonist moment es-timation using clinically applicable models: Muscle dependency and synergy effects. J Electromyogr Ki-nesiol. ; : - .
. (ermens (J, Freriks B, Disselhorst-Klug C, Rau G. De-velopment of recommendations for SEMG sensors and sensor placement procedures. J Electromyogr Kinesiol. ; : - .
. Standards for reporting EMG. J Electromyogr Kinesiol. ; :)))-)V.
. Albertus-Kajee Y, Tucker R, Derman W, Lambert M. Alternative methods of normalising EMG during cy-cling. J Electromyogr Kinesiol. ; : - . . . Criswell E. Cram´s introduction to surface
electro-myography. nd ed. Ontario Canada : Aspen; . . Lehman GJ, McGill SM. The importance of normaliza-tion in the interpretanormaliza-tion of surface electromyogra-phy: a proof of principle. J Manipulative Physiol Ther.
; : - .
. Rutherford DJ, (ubley-Kozey CL, Stanish WD. Maximal voluntary isometric contraction exercises: a meth-odological investigation in moderate knee osteoar-thritis. J Electromyogr Kinesiol. ; : - . . Balshaw TG, (unter AM. Evaluation of
electromyogra-phy normalisation methods for the back squat. J Elec-tromyogr Kinesiol. ; : - .
. Bolgla LA, Uhl TL. Reliability of electromyographic normalization methods for evaluating the hip mus-culature. J Electromyogr Kinesiol. ; : - . . Albertus-Kajee Y, Tucker R, Derman W, Lamberts
RP, Lambert M). Alternative methods of normalis-ing EMG durnormalis-ing runnnormalis-ing. J Electromyogr Kinesiol.
; : - .
. Ball N, Sucurr J. An assessment of the reliability and standardisation of tests used to elicit reference mus-cular actions for electromyographical normaliza-tion. J Electromyogr Kinesiol. ; : - . . Norcross MF, Blackburn JT, Goerger BM. Reliability
and interpretation of single leg stance and maximum voluntary isometric contraction methods of electro-myography normalization. J Electromyogr Kinesiol.
; : - .
. Nishijima Y, Kato T, Yoshizawa M, Miyashita M, )ida (. Application of the segment weight dynamic move-ment method to the normalization of gait EMG am-plitude. J Electromyogr Kinesiol. ; : - . . Murley GS, Menz (B, Landorf KB, Bird AR.
Reliabil-ity of lower limb electromyography during over-ground walking: a comparison of maximal- and sub-maximal normalisation techniques. J Biomech.
794
. Kuznestsov S, Popov DV, Borovik AS, Vinogradova OL. Wavelet analysis of m. vastus lateralis surface EMG activity in incremental test till exhaustion using bi-cycle and knee extension exercises. Fiziol Cheloveka.
; : - .
. Rota S, Rogowski ), Champely S, (autier C. Reliability of EMG normalisation methods for upper-limb mus-cles. J Sports Scien. ; : - .
. Whaley M(, Brubaker P(, Otto RM, Armstrong LE. ACSM Guidelines for exercise testing and prescrip-tion. th ed. Philadelphia: Lippincott Williams & Wilkins; .
. Law LF, Krishnan C, Avin K. Modeling nonlinear errors in surface electromyography due to baseline noise: a new methodology. J Biomech. ; : - . . McDonald AC, Sanei K, Keir PJ. The effect of high pass
iltering and non-linear normalization on the EMG-force relationship during sub-maximal inger exer-tions. J Electromyogr Kinesiol. ; : - . . Anderson KG, Behm DG. Maintenance of EMG activity
and loss of force output with instability. J Strength Cond Res. ; : - .
Received in / /
Recebido em 20/05/2015
Approved in / /
Aprovado em 16/12/2015
. Chapman AR, Vicenzino B, Blanch P, Knox JJ, (odges PW. )ntramuscular ine-wire electromyography dur-ing cycldur-ing: repeatability, normalisation and a com-parison to surface electromyography. J Electromyogr Kinesiol. ; : - .
. Farina D, Cescon C, Merletti R. )n luence of anatomical, physical, and detection-system parameters on surface EMG. Biol Cybern. ; : - .
. (unter AM, St Clair GA, Lambert M, Noakes TD. Electromyographic EMG normalization method for cycle fatigue protocols. Med Sci Sports Exerc.
; : - .
. Burden A, Bartlett R. Normalisation of EMG ampli-tude: an evaluation and comparison of old and new methods. Med Eng Phys. ; : - . . Kollmitzer J, Ebenbichler GR, Kopf A. Reliability of
surface electromyographic measurements. Clin Neu-rophysiol. ; : - .
. (a SM, Cynn (S, Kwon OY, Park KN, Kim GM. A reli-ability of electromyographic normalization methods for the infraspinatus muscle in healthy subjects. J (um Kinet. ; : - .
. Branco VR, Negrão Filho RF, Padovani CR, Azevedo FM, Alvez N, Carvalho AC. Relação entre a tensão aplicada e a sensação de desconforto nos músculos isquiotibiais durante o alongamento. Rev Bras Fisioter.
; : - .
. Clarys JP. Electromyography in sports and occupa-tional settings: an update of its limits and possibilities.
Ergonomics. ; : - .
. Burden A. (ow should we normalize electromyo-grams obtained from healthy participants? What we have learned from over years of research. J Elec-tromyogr Kinesiol. ; : - .
. Burden AM, Trew M, Baltzopoulos V. Normalisation of gait EMGs: a re-examination. J Electromyogr Kinesiol.
; : - .