Inoculum production and evaluation of temperature and leaf wetness for
Passalora
sojina
inoculation in soybean
Juliane Nicolodi Camera
1, Carolina Cardoso Deuner
2; Valéria Cecília Ghissi
1, Erlei Melo Reis
3, Jana Koefender
41Postgraduate student in Agronomy at University of Passo Fundo, Passo Fundo, Rio Grande do Sul, 99052-900, Brazil. [email protected]. br; 2Professor at University of Passo Fundo, Passo Fundo, Rio Grande do Sul, 99052-900, Brazil. 3Researcher at OR Seeds, Passo Fundo, Rio Grande do Sul, 99050-380, Brazil. [email protected]; 4Professor at University of Cruz Alta, Cruz Alta, Rio Grande do Sul, 98020-290, Brazil. [email protected].
Autor para correspondência. Carolina Cardoso Deuner ([email protected]). Data de chegada: 30/08/2016. Aceito para publicação em: 11/04/2017.
10.1590/0100-5405/168573
ABSTRACT
The objective of this study was to develop a methodology for inoculum production and inoculation of Passalorasojina in soybean to assess the reaction to frogeye leaf spot. Thus, sporulation of fungal races was quantified in five substrates under two light regimes. The temperature and the leaf wetness period that resulted in greater infection efficiency were also determined. Petri dishes containing the culture media Oat Flour Agar (OFA), Tomato Juice (FTJ), V8 agar juice (V8), Infant Food (IF) and Potato Sucrose Agar (PSA) plus isolates of P. sojinaraces 23, 24 and 25 were subjected to 12-h
Camera, J.N.; Deuner, C.C.; Ghissi, V.C.; Reis, E.M.; Koefender, J. Inoculum production and evaluation of temperature and leaf wetness for Passalora sojina inoculation in soybean. Summa Phytopathologica, v.44, n.2, p.122-126, 2018.
photoperiod and 24-h continuous dark. Inoculated plants were incubated at temperatures of 15, 20, 25, 30 and 35 ºC and leaf wetness periods of 12, 24, 36, 48 and 72 hours. Experimental design was completely randomized with five replicates. There was interaction among isolate, culture medium and photoperiod. The highest sporulation (conidia/cm2) was obtained in the
culture media FTJ (race 23) and V8 (races 24 and 25) under 12-h photoperiod. The optimum temperature for the disease development was 27oC under 72 hours
of continuous leaf wetness. Keywords: sporulation, frogeye leaf spot, leaf wetness, infection critical period.
Frogeye leaf spot caused by Passalora sojina (Hara) H. D. Shin & U. Braun (syn. Cercospora sojina Hara) is among the important fungal diseases that reduce the yield of soybean [Glycine max (L.) Merrill] (22). The use of resistant cultivars is the most effective and profitable control method (13). Therefore, an easy and reproducible methodology needs to be developed in order to assess the reaction of soybean genotypes to P. sojina.
The objectives of this study were to evaluate a methodology for inoculum production and to detect the optimum temperature and leaf wetness period for plant inoculation with P. sojina. Therefore, the most suitable medium and light exposure regime for the fungus sporulation were also determined, as well as the optimal temperature and the leaf wetness duration that result in the highest disease intensity.
MATERIAL AND METHODS
Sporulation of Passalora sojina in different culture media and light exposure
The races 23, 24 and 25 of P. sojina used in this study were provided by Embrapa Soybean. Race 23 was isolated from soybean cultivar Doko (Niquelândia-GO), race 24 from soybean cultivar BRS 28 (Santa Filomena-PI) and race 25 from soybean cultivar Cariri (Balsas-MA). The following culture media were assessed for fungal sporulation: 1) oat flour agar (OFA) (8); 2) flavored tomato juice (FTJ) - 200 mL tomato juice Super Bom®; 16 g agar; 3.2 g CaCO3, 0.2 g streptomycin and 800 mL distilled water (21); 3) V8 juice agar (V8) (21); 4) infant food (IF) (2); and 5) potato sucrose agar (PSA) (1). After preparation, O objetivo desse trabalho foi desenvolver uma metodologia para produção
de inóculo e inoculação de Passalora sojina em soja visando avaliar a reação à mancha foliar “olho-de-rã”. Para isso foi quantificada a esporulação de raças do fungo em cinco substratos, sob dois regimes luminosos. Também foi determinada a temperatura e duração do período de molhamento foliar que resultasse na maior eficiência da infecção. Placas de Petri com os meios de cultura Farinha de Aveia Ágar (FAA), Suco de Tomate Temperado (STT), Suco V8 ágar (V8), Alimento Infantil (AI) e Batata Sacarose Ágar (BSA) contendo isolados das raças de P.
Camera, J.N.; Deuner, C.C.; Ghissi, V.C.; Reis, E.M.; Koefender, J. Produção de inóculo e avaliação de temperatura e molhamento para inoculação de Passalora sojina em soja. Summa Phytopathologica, v.44, n.2, p.122-126, 2018.
Palavras-chave: esporulação, mancha foliar “olho-de-rã”, molhamento foliar, período crítico à infecção.
RESUMO
sojina 23, 24 e 25 foram submetidas aos fotoperíodos de 12 h e 24 h de escuro contínuo. Plantas inoculadas foram incubadas a temperaturas de 15, 20, 25, 30 e 35 ºC e períodos de molhamento foliar de 12, 24, 36, 48 e 72 h. O delineamento experimental foi inteiramente casualizado com cinco repetições. Houve interação entre isolado, meio de cultura e fotoperíodo. A maior esporulação (conídio/cm2)
foi obtida no meio de cultura STT (raça 23) e no meio V8 (raças 24 e 25), sob fotoperíodo de 12 h. A temperatura ótima para o desenvolvimento da doença foi de 27 o
the media were autoclaved at 121 ºC for 20 minutes and poured into 9.0cm-diameter plastic Petri dishes. Then, a 4.68mm-diameter mycelial disk containing the fungus from the monosporic isolation was placed onto the media and grown for 25 days under 12-h photoperiod and 24-h continuous dark. After this period, sporulation was quantified by using a hemocytometer-type Neubauer chamber (1), where the number of conidia cm-2 was calculated.
The experiment was carried out in a completely randomized design, triple factorial arrangement 3x5x2 (P. sojina races x culture media x light regimes), and five replicates. Data were subjected to analysis of variance and means were compared according to Tukey’s test at 5%.
Interaction between temperature and leaf wetness period on frogeye leaf spot intensity
Interactions between the temperatures 15, 20, 25, 30 and 35 ºC and the leaf wetness periods 12, 24, 36, 48, 60 and 72 hours were assessed. Each temperature consisted in an experiment and the different leaf wetness periods consisted in the treatments.
Monosporic culture of P. sojina race 25 was multiplied in V8 agar (21) at 25 ºC and 12-h photoperiod. By using a hemocytometer-type Neubauer chamber (1), a conidial suspension 4x10⁴
mL-1
was inoculated. The susceptible cultivar Don Mario 7.0i was grown in pots in a growth chamber at 25 ºC and 12-h photoperiod. The plants were inoculated in V3 – when the second trifoliolate leaf was fully developed (7) by spraying the conidial suspension. Plants in five pots were sprayed with water alone and kept under the same environment as a control treatment. At the end of each wetness period, the plants were dried by using an electric fan and kept at 25 ºC and 12-h photoperiod
Fifteen days after inoculation, the disease intensity was assessed, considering: I) leaf area severity: the percentage of necrosed leaf area in relation to the total leaf area, assigning scores from 0 to 100% (6); II) lesion number per leaflet: in the leaflets, where the affected leaf area was quantified and the number of lesions was counted; and III) lesion diameter per leaflet: the diameter of four lesions per leaflet was quantified with a digital caliper.
The mean values of leaf area severity, the diameter and the number of lesions per leaflet, as well as temperature data, underwent regression analysis. Temperature data and leaf wetness followed the quadratic polynomial equation Y = X2
B1 - B2 + B3 X, where Y = dependent variable (leaf area severity, diameter and number of injuries per leaflet), X = independent variable (temperature), B1 = estimated variable, B2 = parameter related to the initial inoculum, and B3 = disease progression rate. The means of all leaf wetness periods were calculated for the graphs of temperature variables and the average of all temperatures was calculated for the graphs of leaf wetness period.
The experiment was conducted in randomized design with five replicates, in which each temperature consisted in an experiment. The obtained data were subjected to analysis of variance and regression (19).
RESULTS AND DISCUSSION
Sporulation of Passalora sojina in different culture media and light regimes
Regarding the number of conidia cm-2, there was significant interaction among the three factors. For the interaction between races and culture media, race 23 showed the largest number of conidia cm-2 in the FTJ substratum and the smallest number of conidia in OFA. As to race 24, the highest value was obtained in V8, while the lowest
means were found in PSA and OFA, which were statistically similar. Considering race 25, the largest number of conidia was produced in V8 and was statistically superior to the others, whereas the smallest number of conidia was determined in PSA. Regardless of the culture medium, race 25 was statistically superior to the other races for the produced number of conidia cm-2, and there was no significant difference between races 23 and 25 in PSA. The lowest fungal sporulation was found in IF and OFA for races 23 and 24, in V8 for race 23, and in PSA and FTJ for race 24 (Table 1).
The largest number of conidia cm-2
was produced under 12-h photoperiod. Race 25 showed the highest value, regardless of the light regime, and was statistically superior to the other races. The 12-h photoperiod was statistically superior to continuous darkness for the number of conidia cm-2, which was statistically superior in V8 than in the other media, followed by FTJ (Table 1).
Table 1. Sporulation (conidia cm-2) of races 23, 24 and 25 of Passalora sojina under different light regimes in different culture media. UPF, Passo Fundo/ RS. 2011
Races Continuous dark 12-h Photoperiod 2
23 B 137.8 c1 A 6462.2 b
24 B 540.0 b A 6734.8 b
25 B 1061.5 a A 15805.8 a
CV % 9.90
Culture Media Continuous dark 12-h Photoperiod 2
AI B 206.14 c1 A 10894.96 c
STT B 720.46 b A 14653.44 b
BSA B 7.218 c A 2158.15 d
V8 B 1196.63 a A 18271.60 a
FAA B 768.63 ab A 2360.10 d
CV % 8.76
1
Means followed by the same lowercase letters in the column and capital letters on the line did not differ according to Tukey’s test at 5% error probability. 2 12-h
Photoperiod: 12 h light and 12 h dark. 3
Means followed by the same lowercase letters in the column and capital letters on the line did not differ according to Tukey’s test at 5% error probability. 4
Oat flour agar (OFA); Flavored Tomato Juice (FTJ); V8 agar juice (V8); Infant Food (IF); Potato sucrose agar (PSA).
As regards substrata, Hanada et al. (9) showed that the greatest sporulation of Paracercospora fijiensis (Morelet) Deighton was
verified in V8 juice agar under 12-h photoperiod and sequential light
exposure. These authors reported that there was no fungal sporulation in the dark for the majority of the tested culture media. Similarly, Brunelli et al. (3) found that V8 and FTJ media and 12-h photoperiod showed higher induction of sporulation, resulting in the production of 22.4x10⁴
and 28.62x10⁴
conidia.mL-1
, respectively. The results obtained in the present study indicate that the media V8 and STT (which is a
modification of V8) increased P. sojina sporulation. OFA substratum did not show satisfactory sporulation and was the second best substrate for the fungus growth. V8 and tomato extract (variation of V8) media
Races IF4
FTJ PSA V8 OFA
23 B 4,208.8 b3 A 8,402.8 b D 1,026.3 a C 2,418.1 c E 444.1 b
24 B 4,227.8 b C 3,414.8 c D 677.7 b A 9,255.0 b D 411.7 b 25 C 8,214.9 a B 11,243.1 a E 1,344.0 a A 17,529.1
a
D 3837.2 a
have the highest nutritional value and the greatest concentration of complex carbohydrates. V8 medium has been reported as an inductor of sporulation for several Cercospora spp. (9). Tomato extract agar was indicated by Queiroz & Menezes (16) as capable of inducing Cercospora nicotianae Ellis & Everh sporulation. Comparing V8 and FTJ, the latter seemed to be more useful from the practical point of
view, since it is easily obtained in the market.
One characteristics of Cercospora species is the slow growth and the scarcity of sporulation in artificial media (3). For other Cercospora spp., there are reports indicating the positive effect of light exposure on sporulation in regimes alternated with dark periods. This was reported for Cercospora arachidicola Hori isolates by Moraes & Salgado
y = -0.0002x2+ 0.0078x - 0.0686
R² = 0.39
0 1 2 3 4
15 20 25 30 35
A ff ect ed l ea fl et a rea (% ) Temperature (˚C) 24 hours
y = -0.0004x2+ 0.0204x - 0.1805 R² = 0.4194
0 1 2 3 4 5 6 7
15 20 25 30 35
N u m b er o f l es io n Temperature (˚C) 24 hours
y = -0.0003x2+ 0.0144x - 0.1299
R² = 0.5218
0 0.5 1 1.5
15 20 25 30 35
D ia me te r o f l e si o n s (mm) Temperature (˚C) 24 hours
y = -0.0009x2+ 0.0413x - 0.3922
R² = 0.8177
0 1 2 3 4
15 20 25 30 35
A ff ect ed l ea fl et a rea (% ) Temperature (˚C) 36 hours
y = -0.0035x2+ 0.1877x - 1.9416 R² = 0.4116
0 1 2 3 4
15 20 25 30 35
A ff ect ed l ea fl et a rea (% ) Temperature (˚C) 48 hours
y = -0.0053x2+ 0.3249x - 3.428
R² = 0.831
0 1 2 3 4
0 5 10 15 20 25 30 35
A ff ect ed l ea fl et a rea (% ) Temperature (˚C) 60 hours
y = -0.0136x2+ 0.753x - 7.6688
R² = 0.6923
0 1 2 3 4
15 20 25 30 35
A ff ect ed l ea fl et a rea (% ) Temperature (˚C) 72 hours
y = -0.0012x2+ 0.0592x - 0.5577 R² = 0.8307
0 1 2 3 4 5 6 7
15 20 25 30 35
N u m b er o f l es io n Temperature (˚C) 36 hours
y = -0.0064x2+ 0.3548x - 3.7224
R² = 0.302
0 1 2 3 4 5 6 7
15 20 25 30 35
N u m b er o f l es io n Temperature (˚C) 48 hours
y = -0.0118x2+ 0.731x - 7.8384
R² = 0.7199
0 1 2 3 4 5 6 7
15 20 25 30 35
N u m b er o f l es io n Temperature (˚C) 60 hours
y = -0.0223x2+ 1.2567x - 12.849
R² = 0.7155
0 1 2 3 4 5 6 7
15 20 25 30 35
N u m b er o f l es io n Temperature (˚C) 72 hours
y = -0.0009x2+ 0.0438x - 0.4162 R² = 0.6791
0 0.5 1 1.5
15 20 25 30 35
D ia me te r o f l es io n s (mm) Temperature (˚C) 36 hours
y = -0.0016x2+ 0.0812x - 0.8215
R² = 0.5202
0 0.5 1 1.5
15 20 25 30 35
D ia me te r o f l e si o n s (mm) Temperature (˚C) 48 hours
y = -0.001x2+ 0.0708x - 0.7303
R² = 0.9346
0 0.5 1 1.5
15 20 25 30 35
D ia me te r o f l es io n s (mm) Temperature (˚C) 60 hours
y = -0.0034x2+ 0.1943x - 1.9496
R² = 0.8132
0 0.5 1 1.5
15 20 25 30 35
D ia me te r o f l es io n s (mm) Temperature (˚C) 72 hours
y = 0,0002x2 - 0,0109x + 0,134 R² = 0,8326
0 0.5 1 1.5 2 2.5 3 3.5
0 12 24 36 48 60 72
A ff ect ed l ea fl et a rea (% )
Leaf wetness (hours) 15˚C
y = 0.0003x2- 0.0188x + 0.231
R² = 0.827
0 1 2 3 4 5 6 7
0 12 24 36 48 60 72
N u m b er o f l es io n
Leaf wetness (hours) 15˚C
y = 5E-05x2- 0.0031x + 0.036
R² = 0.9494
0 0.5 1 1.5 2 2.5 3 3.5
0 12 24 36 48 60 72
D ia me te r o f l es io n s (mm)
Leaf wetness (hours) 15˚C
y = 0,0002x2 - 0,0109x + 0,134 R² = 0,8326
0 0.5 1 1.5 2 2.5 3 3.5
0 12 24 36 48 60 72
A ff ect ed l ea fl et a rea (% )
Leaf wetness (hours) 20˚C
y = 0.0004x2- 0.019x + 0.221
R² = 0.9771
0 1 2 3 4 5 6 7
0 12 24 36 48 60 72
N u m b er o f l es io n
Leaf wetness (hours) 20˚C
y = 9E-05x2- 0.001x + 0.007
R² = 0.8835
0 0.5 1 1.5 2 2.5 3 3.5
0 12 24 36 48 60 72
D ia me te r o f l es io n s (mm)
Leaf wetness (hours) 20˚C
y = 0,0002x2 - 0,0109x + 0,134 R² = 0,8326
0 0.5 1 1.5 2 2.5 3 3.5
0 12 24 36 48 60 72
A ff ect ed l ea fl et a rea (% )
Leaf wetness (hours) 25˚C
y = 0,0002x2 - 0,0109x + 0,134 R² = 0,8326
0 0.5 1 1.5 2 2.5 3 3.5
0 12 24 36 48 60 72
A ff ect ed l ea fl et a rea (% )
Leaf wetness (hours) 30˚C
y = 0.0007x2- 0.0348x + 0.326
R² = 0.8898
0 0.5 1 1.5 2 2.5 3 3.5
0 12 24 36 48 60 72
A ff ect ed l ea fl et a rea (% )
Leaf wetness (hours) 35˚C
y = 0.003x2- 0.1495x + 1.56 R² = 0.9772
0 1 2 3 4 5 6 7
0 12 24 36 48 60 72
N u m b er o f l es io n
Leaf wetness (hours) 25˚C
y = 0.0016x2- 0.0248x - 0.225
R² = 0.945
0 1 2 3 4 5 6 7
0 12 24 36 48 60 72
N u m b er o f l es io n
Leaf wetness (hours) 30˚C
y = 0.0015x2- 0.0716x + 0.691
R² = 0.8945
0 1 2 3 4 5 6 7
0 12 24 36 48 60 72
N u m b er o f l es io n
Leaf wetness (hours) 35˚C
y = 0.0004x2- 0.0202x + 0.237
R² = 0.9182
0 0.5 1 1.5 2 2.5 3 3.5
0 12 24 36 48 60 72
D ia me te r o f l es io n s (mm)
Leaf wetness (hours) 25˚C
y = 0.0002x2- 0.0011x - 0.045
R² = 0.9415
0 0.5 1 1.5 2 2.5 3 3.5
0 12 24 36 48 60 72
D ia me te r o f l es io n s (mm)
Leaf wetness (hours) 30˚C
y = 0.0003x2- 0.0156x + 0.154
R² = 0.9205
0 0.5 1 1.5 2 2.5 3 3.5
0 12 24 36 48 60 72
D ia me te r o f l e si o n s (mm)
Leaf wetness (hours) 35˚C
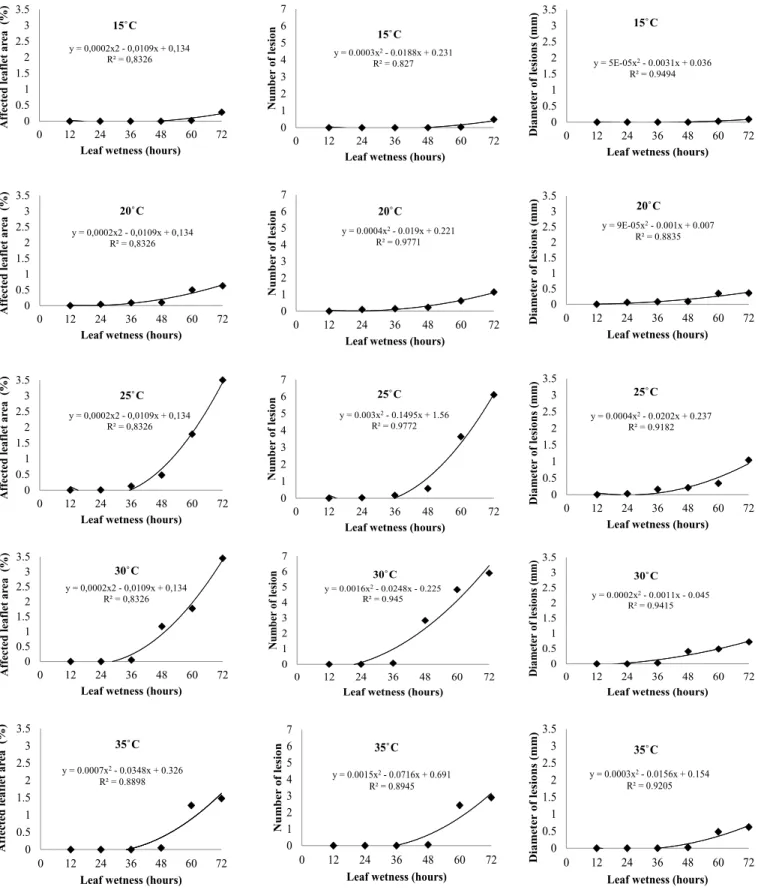
Figure 2. Quadratic polynomial model of frogeye leaf spot variables versus leaf wetness for each temperature level. Affected leaflet area (%), number of lesions per leaflet and diameter of lesions per leaflet (mm) for frogeye leaf spot in soybean cultivar Mario 7.0i.
(14) and for Cercospora kikuchii (MATSUMOTO & TOMOYASU) Gardner] by Dela-Cueva et al. (5). Partial inhibition of sporulation under continuous dark conditions was observed by Kilpatrick & Johnson (10) for C. nicotianae Ellis & Everh, by Stavely & Nimmo (20) for
Interaction between temperature and leaf wetness period on frogeye leaf spot intensity in soybean
The disease did not occur with 12 hours of leaf wetness, regardless of the temperature. The optimum temperature was determined for affected leaf area, number of lesions and diameter, considering 27 ºC, 28 ºC and 27 ºC, respectively (Figure 1). Both temperature and leaf wetness duration influenced the intensity of frogeye leaf spot. As regards temperature, when soybean plants were subjected to 15 oC, the disease was observed only with 60 hours leaf wetness, at 20 and 25 oC with 24 hours, at 30 oC with 36 hours and at 35 oC with 48 hours (Figure 2). Considering leaf wetness period, the disease intensity increased with the increase in the leaf wetness period; however, during 12 h the disease was not detected and the highest intensity was detected with 72h (Figure 2).
The relevance of studying the interaction between temperature and leaf wetness is explained by Zadoks & Schein (23), who support the idea that different intensities of a determined disease can be obtained by using different temperatures and leaf wetness periods, and such interaction is important for the disease occurrence and intensity. The critical period is related to the hours during which the environmental conditions are favorable to infection, in order to allow germination, penetration and establishment of the parasite in the host. Each pathosystem has its own critical infection period (17).
In in vitro studies, the optimum temperature for P. sojina spore germination was 25o
C (4). The infection and the development of in vivo disease symptoms were favorable at temperatures between 25 and 30°C, and relative humidity higher than 90%, once under such conditions sporulation may occur within 48 hours after the first onset of symptoms. Similarly, according to this same author, conidia can germinate on the leaf surface one hour after inoculation, in the presence of water and at 25 and 30°C, developing lesions from 8 to 12 days after inoculation. In this study, both the temperature and the leaf wetness period affected frogeye leaf spot intensity at 27.3ºC. In studies with the same pathosystem, Phillips (15) verified that the optimal temperature for mycelial development of P. sojina was 25o
C, and the pathogen development was limited at > 32 oC.
Considering leaf wetness period, Kudo (11), working with this same fungus, proved that the disease intensity was found with 72 h leaf wetness, but Veiga (22) reported that 48 h leaf wetness resulted in P. sojina infection in soybean. Scandiani et al. (18) found data similar to that of Kudo (11) for leaf wetness at 26 °C, aiming at the selection of soybean genotypes; under such conditions, they observed symptoms on the eighth day after inoculation.
These data can be useful in selection studies of soybean genotypes for genetic breeding programs.
There is an interaction among Cercospora sojina race, culture medium and photoperiod.
The highest sporulation of P. sojina is verified in flavored tomato juice agar and V8 juice agar. The best light regime for sporulation is 12-h photoperiod.
The optimum temperature for the occurrence of frogeye leaf spot is 27 o
C, at which the disease intensity increases linearly as the wetness leaf period increases, and the highest intensity of the disease is verified in the period of 72 hours.
REFERENCES
01. Alfenas, A.C.; Mafia, R.G. Métodos em fitopatologia. Viçosa: Editora UFV, 2007. 382p.
02. Almeida, A.M.R.; Yamashita, J. Crescimento e esporulação de Corynespora cassiicola (Berk. & Curt.) Wei em diferentes meios de cultura. Fitopatologia Brasileira, Brasília, DF, v.1, p.203-206, 1976.
03. Brunelli, K.R.; Fazza, A.C.; Sobrinho, C.A.; Camargo, L.E.A. Efeito do meio de cultura e do regime de luz na esporulação de Cercospora zeae-maydis.
Summa Phytopathologica, Botucatu, v.32, n.1 , p.92-94, 2006.
04. Cruz, M.F.A.; Prestes, A.M.; Maciel, J.L.N. Esporulação de Pyricula-ria grisea em diferentes meios de cultura e regimes de luz. Ciência Rural, Santa Maria, v.39, p.1562-1564, 2009. DOI: 10.1590/ S0103-84782009000500040.
05. Delacueva, F.M.; Natural, M.P.; Hautea, R.A. Cultural requirements for ma -ximum conidial production of Cercospora kikuchii, the cause of purple seed stain of soybean. Philippine Phytopathology, Manila, v.31, p.20-26, 1995.
06. Distéfano, S.G. Evaluación de cultivares de soja frente a “mancha ojo de rana” (Cercospora sojina Hara). Buenos Aires, 2010. Disponível em: <http://www.coopmontemaiz.com.ar/Imagenes/Agro_inta.pdf >. Acesso em : 23 jan. 2012.
07. Fehr, W.R.; Caviness, C.E. Stages of soybean development. Ames: Iowa State University, 1977. 12p.
08. Fernandez, M.R. Manual para laboratório de fitopatologia. Passo Fundo: Embrapa-CNTP, 1993. 128p.
09. Hanada, R.E. Gasparotto, L.; Pereira, J.C.R. Esporulação de Mycosphaerella fijiensis em diferentes meios de cultura. Fitopatologia Brasileira, Brasília, v.27, p.170-173, 2002.
10. Kilpatrick, R.A.; Johnson, H.W. Sporulation of Cercosporaspecies on carrot leaf decoction agar. Phytopathology, Saint Paul, v.46, p.180-181, 1956. 11. Kudo, A.S.; Blum, L.E.B.; Lima, M.A. Aerobiologia de Cercospora kikuchii.
Ciência Rural, Cidade, v.41, n.10, p.1682-1688, 2011. Disponível em: <http://repositorio.unb.br/bitstream/10482/12446/1/ARTIGO_Aerobiolo-giaCercosporaKikuchii.pdf>. Acesso em: 29 out. 2015.
12. Mesquini, R.M. Componentes monocíclicos e quantificação de danos no patossistema Corynespora cassiicola -soja 2012. 92f. Dissertação (Mestrado em Fitopatologia) – Escola Superior de Agricultura “Luiz de Queiroz”, Universidade de São Paulo, 2013.
13. Mian, R.; Bond, J.; Joobeur, T.; Mengistu, A.; Wiebold, W.; Shannon, G.;
Wrather, A. Identification of soybean genotypes resistant to Cercospora
sojina by field screening and molecular markers. Plant Disease, Saint Paul, v.93, p.408–411, 2009. DOI: 10.1094/ PDIS-93-4-0408.
14. Moraes, S.; Salgado, C.L. Influência da luz sobre a esporulação de Cercos-pora arachidicola Hori. Summa Phytopathologica, Botucatu, v.4, n.2, p.128-135, 1997.
15. Phillips, O.V. Frogeye leaf spot. In: Hartman, G.L.; Sinclair, J.B.; Rupe, J.C. Compendium of soybean diseases. Saint Paul: APS Press, 1999. p. 20-21.
16. Queiroz, F.M.; Menezes, M. Efeito de meios de cultura e do regime de luz na esporulação de Cercospora nicotianae. Fitopatologia Brasileira, Lavras, v.18, p.545-547, 2009.
17. Reis, E.M.; Wordell Filho, J.A. Previsão de doenças de plantas. In: Reis, E.M (Ed.). Previsão de doenças de plantas. Passo Fundo: Editora UPF, 2004. p.65-99.
18. Scandiani, M.M.; Ferrari, B.; Formento, N.; Luque, A.; Carmona, M.; Tartabini, M.; Ferri, M. Evaluación de la resistencia y susceptibilidad de genotipos de soja (Glycine max) a la mancha ojo de rana (Cercospora sojina). Revista Análisis de Semillas v.4, n.14, p.67-72, 2010. Disponível em: <http://www.minagri.gob.ar/site/agricultura/roya_soja/07=infor-mes/01_Informes/_archivo/090000-Informes%20campa%C3%B1as%20 2009-2010/000000-Evaluaci%C3%B3n%20de%20la%20Resistencia%20 y%20Suceptibilidad%20de%20Genotipos%20de%20Soja%20a%20 MOR%20N%20Formento.pdf> . Acesso em: 23 fev. 2015.
19. Statsoft, Inc. Statistica: data analysis software system. Version 6. Tulsa, 2001.
20. Stavely, J.R.; Nimmo, J.A. Effects of temperature upon growth and spo -rulation of Cercospora nicotianae. Phytopathology, Saint Paul , v.59, p.496-498, 1969.
21. Tuite, J. Plant pathological methods: fungi and bacterial. 5.ed. Minneap-olis: Burgess Publishing Company, 1969. 239p.
22. Veiga, P.; Kimati, H. Influência de meios de cultura e regime luminoso na esporulação de Cercospora sojina Hara. Revista Centro Ciências Rurais, Cascavel, v.4, p.159-164, 1974.
23. Zadoks, J.C.; Schein, R.D. Epidemiology and plant disease management.