http://dx.doi.org/10.1590/1678-4499.0179
Estimating leaf area of modern soybean cultivars
by a non-destructive method
Gean Leonardo Richter; Alencar Junior Zanon; Nereu Augusto Streck (*); Jerson Vanderlei Carús Guedes; Bruno Kräulich; Thiago Schmitz Marques da Rocha; José Eduardo Minussi Winck; Jossana Ceolin Cera
Universidade Federal de Santa Maria (UFSM), Departamento de Fitotecnia, Av. Roraima, 1000, 97105-900 Santa Maria (RS), Brasil. (*) Corresponding author: [email protected]
Received: Jun. 4, 2014; Accepted: Aug. 21, 2014
Abstract
The objective of this study was to determine an empirical mathematical model to estimate leaf area of different soybean cultivars from leaf dimensions, with emphasis on modern and currently used soybean cultivars in the Rio Grande do Sul State. A field experiment was conducted at Santa Maria during three growing seasons (2010/2011, 2012/2013 and 2013/2014) and 13 soybean cultivars (NS 4823 RR, BMX Energia RR, Igra RA 518 RR, BMX Turbo RR, NA 5909 RG, TMG 7161 RR Inox, TEC 5936IPRO, IAS 5, BMX Potência RR, Fepagro 36 RR, BRS 246 RR, Bragg and CD 219 RR). Twenty leaves of each cultivar were used to calibrate the model and another 50 leaves were used to test its predictive ability as independent data. The model is based on the length (L) and the largest width (W) of the central leaflet of the trifoliate leaf. The relationship between leaf area and the linear dimensions of the central leaflet was fitted to a linear model for each cultivar as well as to a generalized model for all cultivars. The predictive ability of the equations was evaluated with the statistics root mean square error, BIAS, modified index of agreement and r coefficient. The results indicate that the non-destructive method, based on linear dimensions of the central leaflet, is appropriate to estimate the area of individual leaves in soybean and the general equation LA = 2.0185.(L.W) can be used for several modern soybean cultivars.
Key words: Glycine max, leaf area index, mathematical models, linear dimensions.
Estimativa da área de folhas de cultivares antigas e modernas de soja por método não
destrutivo
Resumo
O objetivo do trabalho foi determinar um modelo matemático empírico que estime a área de folhas em cultivares de soja a partir de dimensões lineares da folha, com ênfase para cultivares modernas e recentemente em uso por agricultores no Rio Grande do Sul. Para isso, foi realizado um experimento de campo em Santa Maria com 13 cultivares (NS 4823 RR, BMX Energia RR, Igra RA 518 RR, BMX Turbo RR, NA 5909 RG, TMG 7161 RR Inox, TEC 5936IPRO, IAS 5, BMX Potência RR, Fepagro 36 RR, BRS 246 RR, Bragg e CD 219 RR) durante três anos agrícolas (2010/2011, 2012/2013 e 2013/2014). Foram coletadas 20 folhas de cada cultivar para a calibração do modelo e outras 50 folhas para testar a capacidade preditiva do mesmo, nas quais foi medido o comprimento (C) e a maior largura (L) de cada folíolo central dos trifólios. A partir da relação entre área da folha e as dimensões lineares do folíolo central foi ajustado um modelo linear para cada cultivar e um modelo geral para todas as cultivares. A capacidade preditiva das equações foi avaliada pelas estatísticas raiz quadrada média do erro, BIAS, índice de concordância modificado e coeficiente r. Os resultados indicam que o método não destrutivo, baseado nas dimensões lineares do folíolo central, é apropriado para a estimativa da área de folhas individuais em soja e que a equação geral AF = 2,0185.(C.L) pode ser utilizada para várias cultivares modernas de soja.
Palavras-chave: Glycine max, índice de área foliar, modelos matemáticos, dimensões lineares.
1. INTRODUCTION
Soybean (Glycine max), Fabaceae family, is the major source of vegetable oil in the world (Streck et al., 2008). Given the economic importance for Brazil and for the Rio Grande do Sul State and the high speed with which new soybean cultivars are released annually, basic studies
that can assist extension workers and consultants to better understand issues related to growth and development of these new cultivars should be performed steadily (Vernetti and Vernetti Junior, 2009). Determining leaf area is important in assessing the photosynthetic efficiency of
Crop Production and Management |
plants, in determining biotic and abiotic crop damage, in growth analysis studies and for being a great determinant of commercial crop yield (Setiyono et al., 2008).
Methods to determine the leaf area can be either destructive or non-destructive (Marshall, 1968). The methods requiring removal of leaves or other structures from the plant are called destructive or laboratory methods, whose disadvantages include the non-applicability in studies with limited number of samples. Conversely, with non-destructive methods, the measurements are carried out on plants without destructive sampling, preserving their integrity and enabling measurements on the same plant throughout the development cycle (Adami et al., 2008; Bakhshandeh et al., 2011).
Among the non-destructive methods stand out those in which the actual leaf area is estimated from linear measurements of the leaf blade taken directly on leaves of plants (Fagundes et al., 2009; Maldaner et al., 2009; Wiersma and Bailey, 1975). Fontes and Araújo (2007) observed that the use of the length and width of leaves in mathematical models to estimate leaf area is an alternative that combines accuracy and low cost, eliminating the need for sophisticated equipment or time-consuming geometric reconstruction, and no need to collect the leaves. After determining the length and width of leaves, a linear regression is fitted between these two variables to estimate a ratio between the actual area and the product of the length by the width. From this ratio, called the shape factor, one can estimate the area of any other leaf of the species, from the product of their linear dimensions (length and maximum width) (Fagundes et al., 2009).
In soybean, previous studies have determined models to estimate leaf area from linear dimensions of the leaf (Bakhshandeh et al., 2011; Wiersma and Bailey, 1975). With the introduction of new soybean cultivars in southern Brazil, with indeterminate growth habit, early maturity (Meotti et al., 2012; Vernutti and Vernutti Junior, 2009), maturity groups ranging between 4.5 and 7.5 and a lower leaf area index (Guedes et al., 2010) compared with cultivars of determinate growth habit and medium and long cycles (Tian et al., 2010), there is a need to revisit the nondestructive models available in the literature to estimate leaf area in soybean.
The objective of this study was to determine an empirical mathematical model to estimate leaf area in soybean cultivars from linear dimensions of the leaf, with emphasis on modern and currently used cultivars in the Rio Grande do Sul State.
2. MATERIAL AND METHODS
A field experiment was conducted at the Plant Science Department, Federal University of Santa Maria, Santa Maria, Rio Grande do Sul State (RS) (29°43’S, 53°43’W
95m), located in the Central Depression region of the State. According to Köppen, the climate is Cfa, humid subtropical with hot summer and no dry season (Kuinchtner and Buriol, 2001). We used thirteen soybean cultivars, listed in table 1, which were selected to represent different maturity groups, growth habits and leaf shape (Figure 1). Of the thirteen cultivars, two are old (Bragg and IAS 5) that were grown in the 60s, 70s and 80s in the Rio Grande do Sul State (Rubin and Santos, 1996), and the other eleven cultivars are currently being grown in the State, mainly since 2005.
Sowing was performed on two dates (December 10th, 2010 and January 8th, 2011) during the 2010/2011 growing season, four sowing dates in 2012/2013 growing season (September 22th, 2012, November 3th, 2012, December 1th, 2012 and February 6th, 2013) and two sowing dates in 2013/2014 growing season (September 27th, 2013 and November 15th, 2013). The experimental design was a randomized block with four replications. Each block consisted of 13 rows, 3m long, spaced at 0.45m, with a plant density of 30 plants m–2. Each row was composed of a cultivar and considered a plot. The fertilization at sowing, seed inoculation with Bradyrhizobium japonicum, seed treatment with fungicide and insecticide and control of pests and diseases during the growing season were performed according to the technical recommendations for the crop. Weed control was accomplished by hand hoeing in order to avoid competition for water, light and nutrients. Irrigation was performed whenever necessary, by sprinkling in 2010/2011 and by drip in 2012/2013 to prevent plants from water stress.
In order to estimate the equations that relate the individual leaf area with linear dimensions, we collected 20 leaves of various sizes, from different portions within the plant, throughout the development cycle of each cultivar, on the two sowing dates of the 2010/2011 growing season for eleven cultivars (NS 4823 RR, BMX Energia RR, Igra RA 518 RR, BMX Turbo RR, NA 5909 RG, IAS 5, BMX
Table 1. Soybean cultivars and respective maturity group and growth habit used in the field experiment. Santa Maria (RS), 2014
Cultivar Maturity group Growth habit
NS 4823 RR 4.8 Indeterminate
BMX Energia RR 5.3 Indeterminate
Igra RA 518 RR 5.7 Semi-Determinate
BMX Turbo RR 5.8 Indeterminate
NA 5909 RG 5.9 Indeterminate
TMG 7161 RR Inox 5.9 Indeterminate
TEC 5936IPRO 5.9 Indeterminate
IAS 5 6.3 Determinate
BMX Potência RR 6.7 Indeterminate
Fepagro 36 RR 7.1 Determinate
BRS 246 RR 7.2 Determinate
Bragg 7.3 Determinate
G.L. Richter et al.
Potência RR, Fepagro 36 RR, BRS 246 RR, Bragg and CD 219 RR). For the cultivars TMG 7161 RR Inox e TEC 5936IPRO, twenty leaves were collected in the sowing September 27th, 2013.
After this, we measured the length and maximum width of the central leaflet of the trifoliate leaf. Then, each leaf was digitized on a scanner at 300dpi. We calculated the area of each leaf (LA) with the aid of Quant 1.0.1 software. From the relationship between leaf area and its linear dimensions, we fit a linear model considering the product of its linear dimensions (length x width) (Equation 1):
LA = a.(L.W) (1)
where LA is the leaf area (cm2), L is the leaf length (cm), W is the maximum width of the leaf (cm), a is the slope or shape factor. The slope (a) was estimated by linear regression, forcing the regression line to cross the origin (intercept equal to zero) using the Table Curve software. We opted to force the regression line through the origin because it is biologically more correct than statistically estimating an intercept coefficient, since without linear dimensions there should be no leaf area. Also, once new soybean cultivars are released annually, we estimated a general equation for all cultivars, using data from all cultivars for calibration.
During the 2012/2013growing season, we collected a total of 50 leaves of eleven cultivars in the four sowing dates,
and in the second sowing date of the 2013/2014 growing season we collected 50 leaves of the cultivars TMG 7161 RR Inox and TEC 5936IPRO, to test the predictive ability of specific equations of each cultivar and the general equation with independent data.
The performance of the cultivar-specific equations and the general equation was evaluated using the statistics: root mean square error (RMSE) - equation 2 (Janssen and Heuberger, 1995), modified index of agreement (d1) - equation 3 (Willmott et al., 1985), BIAS index - equation (4) (Leite and Andrade, 2002), and the correlation coefficient (r) - equation 5.
RMSE = [∑ (Si - Oi)2 /n]0.5 (2)
d1 = 1 - [∑ |Si – Oi|] / [∑ (|Si - Ō|)+(|Oi - Ō|)] (3)
BIAS = (∑Si -∑Oi) /∑Oi (4)
r = ∑ (Oi - Ō) (Si - S) / {[∑ (Oi - Ō)2][ ∑(Si - S)2]}0.5 (5) In equations 2, 3, 4 and 5, Si represents the values of estimated LA (cm²/leaf), Oi the values of observed LA (cm²/ leaf) and n is the number of observations.
RMSE expresses the magnitude of the error produced by the model, so the closer to zero is the best the model (Janssen and Heuberger, 1995). The index d1 (Willmott et al.,
1985) is a modification of the index d originally proposed by Willmott (1981) as the quadratic function used in the original equation can result in higher values of this index and this change tends to result in a more rigorous index (Willmott et al., 1985). The values of the d1 index range from zero (0), for no agreement, to 1, for perfect agreement. The BIAS index expresses the average deviation of the estimated values from the observed ones, thus indicating
the tendency of the model to overestimate or underestimate the estimated values and therefore the closer to zero, the smaller the magnitude of the systematic error of the model (Leite and Andrade, 2002). The correlation coefficient (r) indicates the degree of dispersion and association of the simulated data in relation to observed data and the closer to unity, the higher the correlation between simulated and observed data.
G.L. Richter et al.
In the sowing dates September 22th, 2012, November 3th, 2012, we tagged four plants of each cultivar, except for the cultivars TMG 7161 RR Inox and TEC 5936IPRO. Every two weeks, measurements were taken for length and width of the central leaflet of all leaves on the main stem of each plant. Leaf area was calculated from the cultivar-specific equations and also by the general equation. Green leaf area index (LAI) was calculated by adding up
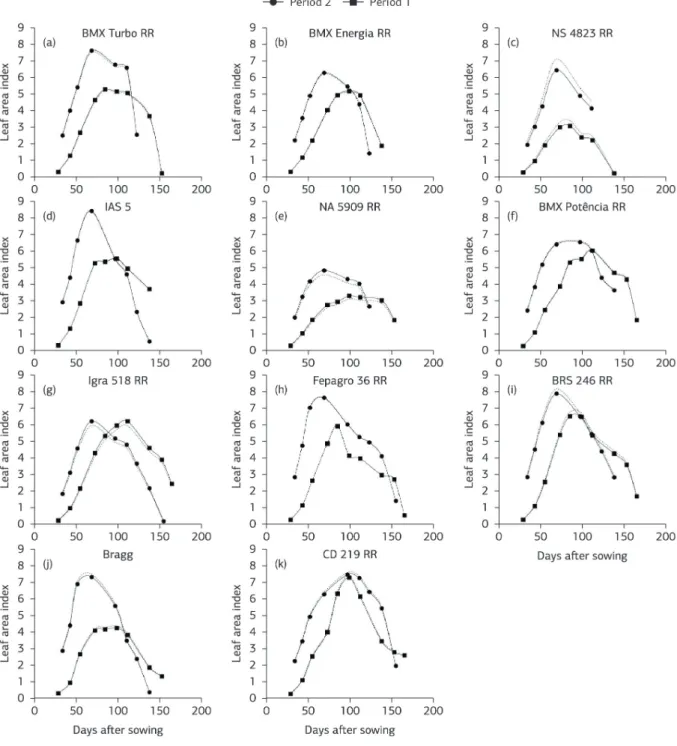
the individual leaf areas and dividing by the ground area occupied by a plant, in the same unit area. To assess the precision of the general equation in relation to the cultivar-specific equation, we made figures showing the evolution of leaf area index throughout the developmental cycle of the eleven cultivars, with the application of the general equation and its comparison with the cultivar-specific equations.
G.L. Richter et al.
3. RESULTS AND DISCUSSION
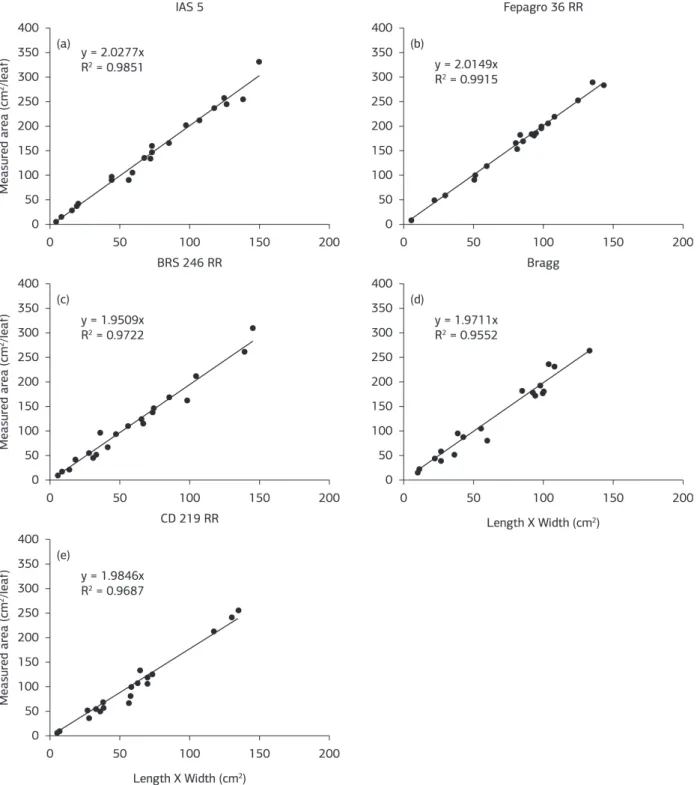
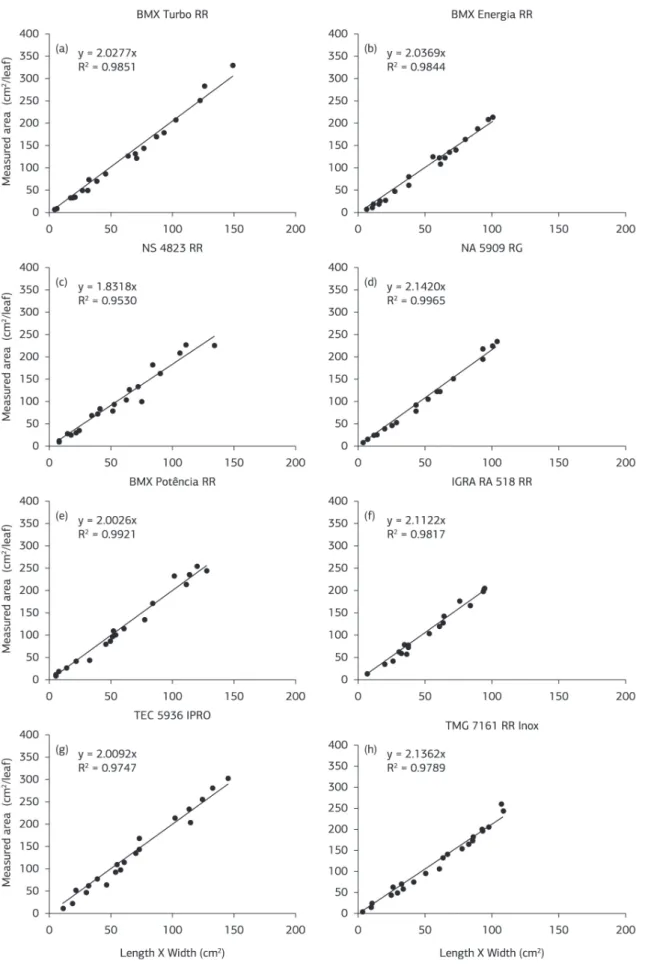
Figures 2 and 3 show the individual leaf area vs. the product of length x width used in the calibration, the equations to estimate the area of individual trifoliate (LA, cm²) and the coefficient of determination (r²) of thirteen soybean cultivars. The coefficients of determination were high (r² ≥ 0.95) (Figures 2 and 3), indicating that the estimation of leaf area in soybean by the method of linear dimensions is suitable for all soybean cultivars used in the experiment.
The slope of the linear regression, which is the shape factor to estimate leaf area, ranged from 1.8318 to 2.1420 in the thirteen cultivars. A small variation in the shape coefficients for this set of cultivars indicates a potential for using a general equation for the thirteen cultivars. Based on this, we fitted a general equation for all cultivars: LA = 2.0185xLxW (R² = 0.9747).
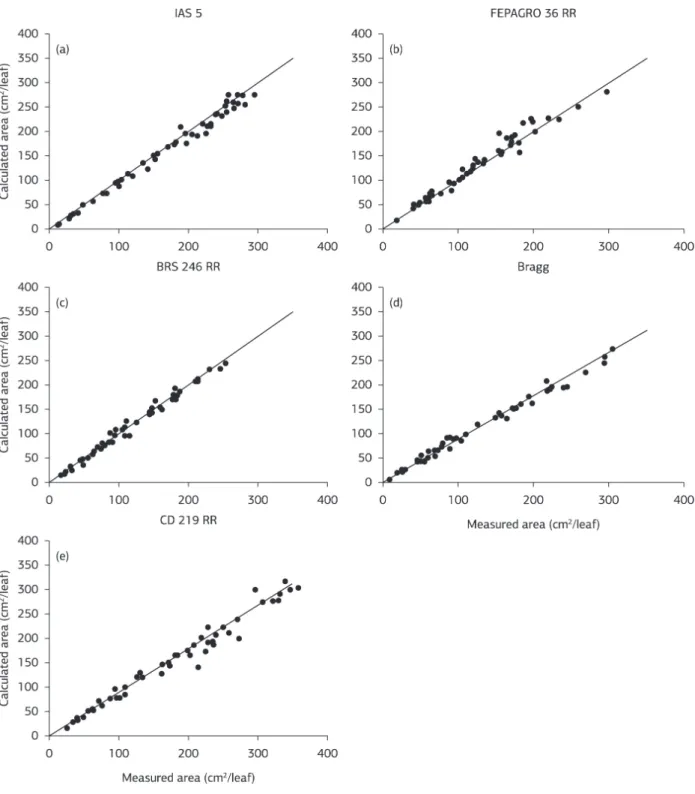
The 1:1 plots with the performance of specific cultivar equations are shown in figures 4 and 5, and the statistics
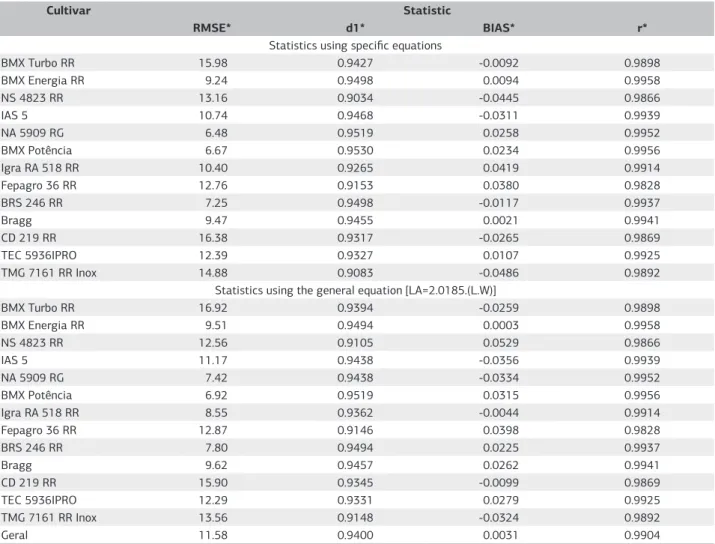
of the performance of cultivar-specific equations and the general equation are listed in table 2. The visual analysis of data dispersion around the line 1:1 in figures 5 and 6 indicates excellent predictive ability in a wide range of leaf size. RMSE values with the cultivar-specific equation ranged from 6.48 to 16.92, and are smaller than those found in studies with snap beans of 12.56-39.94 (Toebe et al., 2012) and close to the values with soybean crop of 7.33-9.22 (Bakhshandeh et al., 2011). These results indicate high predictive ability of cultivar-specific equations and the general equation. The other statistics (d1, BIAS and r)
confirm the high predictive ability of the individual equations (Table 2).
Comparing the statistics (RMSE, d1, BIAS and r)
evaluating the performance of cultivar-specific equations with the statistics of the general equation, the estimation error is similar (Table 2). For the cultivars Igra RA 518 RR, CD 219 RR and TMG 7161 RR Inox, the four statistics indicate better performance using the general equation. The better performance of the general
Table 2. Statistics of the predictive ability of the equations to estimate leaf area (LA) of soybean from linear dimensions of length (L) and width (W) of the central leaflet with independent data
Cultivar Statistic
RMSE* d1* BIAS* r*
Statistics using specific equations
BMX Turbo RR 15.98 0.9427 -0.0092 0.9898
BMX Energia RR 9.24 0.9498 0.0094 0.9958
NS 4823 RR 13.16 0.9034 -0.0445 0.9866
IAS 5 10.74 0.9468 -0.0311 0.9939
NA 5909 RG 6.48 0.9519 0.0258 0.9952
BMX Potência 6.67 0.9530 0.0234 0.9956
Igra RA 518 RR 10.40 0.9265 0.0419 0.9914
Fepagro 36 RR 12.76 0.9153 0.0380 0.9828
BRS 246 RR 7.25 0.9498 -0.0117 0.9937
Bragg 9.47 0.9455 0.0021 0.9941
CD 219 RR 16.38 0.9317 -0.0265 0.9869
TEC 5936IPRO 12.39 0.9327 0.0107 0.9925
TMG 7161 RR Inox 14.88 0.9083 -0.0486 0.9892
Statistics using the general equation [LA=2.0185.(L.W)]
BMX Turbo RR 16.92 0.9394 -0.0259 0.9898
BMX Energia RR 9.51 0.9494 0.0003 0.9958
NS 4823 RR 12.56 0.9105 0.0529 0.9866
IAS 5 11.17 0.9438 -0.0356 0.9939
NA 5909 RG 7.42 0.9438 -0.0334 0.9952
BMX Potência 6.92 0.9519 0.0315 0.9956
Igra RA 518 RR 8.55 0.9362 -0.0044 0.9914
Fepagro 36 RR 12.87 0.9146 0.0398 0.9828
BRS 246 RR 7.80 0.9494 0.0225 0.9937
Bragg 9.62 0.9457 0.0262 0.9941
CD 219 RR 15.90 0.9345 -0.0099 0.9869
TEC 5936IPRO 12.29 0.9331 0.0279 0.9925
TMG 7161 RR Inox 13.56 0.9148 -0.0324 0.9892
Geral 11.58 0.9400 0.0031 0.9904
G.L. Richter et al.
equation was also observed for cultivars NS 4823 RR and TEC5936IPRO with the statistics RMSE and d1. These results indicate the possibility of using a general equation for more than one cultivar, despite the range of leaf shape among cultivars (Figure 1). This is important, because new cultivars are released every year, but as the leaf shape of these cultivars are likely to be similar to the leaf shape of the cultivars used in this study, it will not be necessary to estimate the coefficient of the general equation so often,
corroborating the results found by Bakhshandeh et al. (2011) and Wiersma and Bailey (1975) for soybean crops and by Aquino et al. (2011) for sunflower crop.
Comparing the general equation with cultivar-specific equations (Figure 6), the difference in estimating the evolution of leaf area index is small, and varied according to the cultivar. The largest differences were in LAI maximum values, especially in the cultivar NA 5909 RR (4.86 with the specific equation and 4.58 with the general equation,
figure 6e) and in the cultivar NS 4823 RR (6.45 with the specific equation and 7.11 with the general equation, figure 6c). In the cultivars BMX Turbo RR, BMX Energia RR, IAS 5, BMX Potência RR, Fepagro 36 RR, Bragg and CD 219 RR, the variation in LAI using cultivar-specific equations and the general equation was neglegible (Figures 6a,b,d,f,h,j, and l).
The use of linear dimensions to estimate the individual leaf area has the disadvantage of requiring manpower to perform the measurements. In soybean, the leaves, except the first one (which is a simple or unifoliate leaf,) are trifoliate. Thus, the need to measure the three leaflets increases by three times the time to measure a leaf, compared to single leaf species, such as maize. Nevertheless, our results indicate that, as others conducted for soybean crop (Bakhshandeh et al., 2011; Wiersma and Bailey, 1975), measuring linear dimensions of only one leaflet (the central one) is enough to achieve a good estimate of the area of the three leaflets.
4. CONCLUSION
The nondestructive method using the linear dimensions of the central leaflet is suitable for estimating the individual leaf area in soybean. The general equation LA = 2.0185. (L.W) may be used for several modern soybean cultivars that are currently used in the Rio Grande do Sul State, without loss of accuracy.
REFERENCES
ADAMI, M.; HASTENREITER, F.A.; FLUMIGNAN, D.L.; FARIA, R.T. Estimativa de área de folíolos de soja usando imagens digitais e dimensões foliares. Bragantia, v.67, p.1053-1058, 2008. http:// dx.doi.org/10.1590/S0006-87052008000400030
AQUINO, L.A.; JÚNIOR V.C.S.; GUERRA, J.V.S.; COSTA M.M. Estimativa da área foliar do girassol por método não destrutivo. Bragantia, v.70, p.832-836, 2011. http://dx.doi.org/10.1590/S0006-87052011000400015
BAKHSHANDEH, E.; KAMKAR, B.; TSIALTAS, J.T. Application of linear models for estimation of leaf area in soybean [Glycine max
(L.) Merr]. Photosynthetica, v.49, p.405-416, 2011. http://dx.doi. org/10.1007/s11099-011-0048-5
FAGUNDES, J.D.; STRECK, N.A.; KRUSE, N.D. Estimativa da área foliar de Aspilia montevidensis (Spreng.) Kuntze utilizando dimensões lineares. Revista Ceres, v.56 p.266-273, 2009.
FONTES, P.C.R.; ARAÚJO, C. Adubação nitrogenada de hortaliças: princípios e práticas com o tomateiro. Viçosa: UFV, 2007. 148p.
GUEDES, J.V.C.; STECCA, C.S.; RODRIGUES, R.B.; BIGOLIN, M. Nova dinâmica. Cultivar Grandes Culturas, v.12, p.24-26, 2010.
JANSSEN, P.H.M.; HEUBERGER, P.S.C. Calibration of process-oriented models. Ecological Modelling, v.83, p.55-56, 1995.
KUINCHTNER, A.; BURIOL, G.A. Clima do Estado do Rio Grande do Sul segundo a classificação climática de Köppen e Thornthwaite. Disciplinarum Scientia, v.2, p.171-182, 2001.
LEITE, H.G.; ANDRADE, V.C.L. Um método para condução de inventários florestais sem o uso de equações volumétricas. Revista Árvore, v.26, p.321-328, 2002.
MALDANER, I.C.; HELDWEIN, A.B.; LOOSE, L.H.; LUCAS, D.D.P.; GUSE, F.I.; BORTOLUZZI, M.P. Modelos de determinação não-destrutiva da área foliar em girassol. Ciência Rural, v.39, p.1356-1361, 2009. http://dx.doi.org/10.1590/S0103-84782009000500008
MARSHALL, J.K. Methods of leaf area measurement of large and small leaf samples. Photosynthetica, v.2, p.41-47, 1968.
MEOTTI, G.V.; BENIN, G.; SILVA, R.R.; BECHE, E.; MUNARO, L.B. Épocas de semeadura e desempenho agronômico de cultivares de soja. Pesquisa Agropecuária Brasileira, v.47, p.14-21, 2012.
RUBIN, S.A.L; SANTOS, O.S. Progresso do melhoramento genético da soja no estado do Rio Grande do Sul: i. Rendimento de grãos. Pesquisa Agropecuária Gaúcha, v.2, p.139-147, 1996.
SETIYONO, T.D.; WEISS, A.; SPECHT, J.K.; CASSMAN, K.G.; DOBERMANN, A. Leaf area index simulation in soybean grown under near-optimal conditions. Field Crops Research, v.108, p.82-92, 2008.
STRECK, N.A.; PAULA, G.M.; CAMERA, C.; MENEZES, N.L.; LAGO, I. Estimativa do plastocrono em cultivares de soja. Bragantia, v.67, p.67-73, 2008. http://dx.doi.org/10.1590/S0006-87052008000100008
TIAN, Z.; WANG, X.; LEE, R.; LI Y.; SPECHT, J.E.; NELSON, R.L.; MCCLEAN, P.E.; QIU, L.; MA, J. Artificial selection for determinate growth habit in soybean. Proceedings of the National Academy of Sciences of the United States of America, v.107, p.8563-8568, 2010.
TOEBE, M.; CARGNELUTTI FILHO, A.; LOOSE, L.H.; HELDWEIN, A.B.; ZANON, A.Z. Área foliar de feijão-vagem
(Phaseolus vulgaris L.) em função de dimensões foliares. Semina: Ciências
Agrárias, v.33, p.2491-2500, 2012. http://dx.doi.org/10.5433/1679-0359.2012v33n6Supl1p2491
VERNETTI, F.J.; VERNETTI JUNIOR, F.J. Genética da soja: caracteres qualitativos e diversidade genética. Brasília: Embrapa Informação Tecnológica, 2009. 221p.
WILLMOTT, C.J. On the validation of models. Physical Geography, v.2, p.184-194, 1981.
WILLMOTT, C.J.; ACKLESON, S.G.; DAVIS, J.J.; FEDDEMA, K.M.; KLINK, D.R. Statistics for the evaluation and comparison of models. Journal of Geophysical Research, v.90, p.8995-9005, 1985. http://dx.doi.org/10.1029/JC090iC05p08995
Er
ratum
http://dx.doi.org/10.1590/1678-4499.er7402
Erratum
Bragantia, v.73, n.4, p.416, 2014.
In the article “Estimating leaf area of modern soybean cultivars by a non-destructive method” authored by Gean Leonardo Richter; Alencar Zanon Júnior; Nereu Augusto Streck; Jerson Vanderlei Carús Guedes; Bruno Kräulich; Thiago Scmitz Marques da Rocha; José Eduardo Minussi Winck; Jossana Ceolin Cera.
Pag. 416
Where you read:
Thiago Scmitz Marques da Rocha You should read: