DOI: 10.5935/2359-4802.20180001
ORIGINAL ARTICLE
Mailing Address: José Antônio Caldas Teixeira •
Rua Presidente João Pessoa, 248. Postal Code: 24220-331, Icaraí, Niterói, RJ – Brazil. E-mail: [email protected], [email protected]
Study with a Portable Gas Analyzer of the 6-Minute Walk Test in Heart Failure with
Normal Ejection Fraction
José Antônio Caldas Teixeira,1 Leandro Rocha Messias,1 Kátia Pedreira Dias,1 Washington Luiz Batista da Costa,1
Roberto Macedo Cascon,2 Sandra Marina Ribeiro de Miranda,1 Pedro Soares Teixeira,3 Juliana Grael Jorge,4
Antonio Claudio Lucas da Nobrega,1 Denizar V. Araujo5
Universidade Federal Fluminense (UFF),1 Clínica Fit Center,2 Complexo Hospitalar de Niterói,3 Serviço de Arritmia da Rede Dor,4 Universidade do Estado
do Rio de Janeiro,5 Rio de Janeiro, RJ – Brazil
Manuscript received February 06, 2017, revised manuscript June 01, 2017, accepted July 31, 2017
Abstract
Background:Few studies have used portable gas analyzers during the 6-minute walk test (6MWT) in patients with heart failure and normal ejection fraction (HFNEF).
Objectives: To analyze the kinetics of hemodynamic, ventilatory, and metabolic variables in patients with HFNEF during the T6m using a portable gas analyzer.
Methods: Prospective, analytical study with an intentional, non-probabilistic, convenience sample. In total, 24 patients with HFNEF and past hospital admissions due to a clinical diagnosis of heart failure (HF) were included using the 2007 criteria established by the European Society of Cardiology. Three assessments were performed: 6MWT familiarization, 6MWT with the portable gas analyzer, and cardiopulmonary exercise test (CPET).
Results: The heart rates (HRs) and the peak VO2 at the end of the 6MWT corresponded to 85.7% and 86.45% of the values obtained during the CPET. The final HRs after the T6m were equivalent to those obtained at the CPET anaerobic threshold (AT), with relative VO2 values at the end of the 6MWT above the VO2 of the CPET AT. There was no difference between the maximum respiratory quotient (RQ) values in these two tests, which were both above 1.0. The VE/VO2 slope descended initially and then ascended significantly after the fifth minute of the test, estimating the identification of the AT.
Conclusions: In patients with HFNEF, the 6MWT represents an almost maximum effort, and is performed above the CPET AT and 85% above the maximum HR and the CPET peak VO2, with a maximum RQ similar to that in the CPET. (Int J Cardiovasc Sci. 2018;31(2)143-151)
Keywords:Heart Failure; Blood Gas Analysis; Stroke Volume; Exercise; Walk Test.
Introduction
Heart failure (HF) evokes the image of a dilated heart with reduced systolic function and ejection fraction (HF with reduced ejection fraction, HFREF).
However, the study by Burkhoff et al.1 has shown that a
large proportion of patients with HF symptoms has an ejection fraction within the normal range, and are then classified as having HF with normal ejection fraction
(HFNEF).2,3 The limited tolerance to physical effort in
HF is often the first and main clinical characteristic
of the disease.4 In the identification of this exercise
intolerance, the 6-minute walk test (6MWT) has been used as an instrument to evaluate the progression after
different interventions.5
Only a few studies have been conducted using portable gas analyzers to describe and analyze the behavior of variables in the 6MWT and possible characteristics or markers that may help guide the therapy and improve the
The aim of this study was to describe and analyze the kinetic behavior at each minute of hemodynamic, ventilatory, and metabolic variables in patients with HFNEF during the 6MWT using a portable gas analyzer, and to compare the findings with those obtained during a cardiopulmonary exercise test (CPET).
Methods
Prospective, analytical study with a non-probabilistic, intentional, and convenience sample, as set by the
adopted criteria, carried out at the Hospital Universitário
Antônio Pedro (HUAP) of the Universidade Federal Fluminense (UFF) between March 2010 and July 2013. The study project was approved by the Ethics Research Committee at HUAP under the number 152A/2010, and all participants signed an informed consent form.
The inclusion criteria adopted to characterize HFNEF
were those described by Paulus et al.,11 in addition to
the following factors: (A) complaints suggestive of HF (dyspnea, fatigue, and/or edema); (B) report of prior hospitalization due to decompensated heart disease, but at the moment of the test presenting with a functional class II to III according to the New York Heart Association (NYHA); (c) age > 18 years; (d) disease duration greater than 6 months; (e) use of medication; and (F) stable disease.
The exclusion criteria adopted were: (A) chronic obstructive pulmonary disease (COPD) based on clinical criteria, (B) functional class IV or other criteria
contraindicating the CPET,12 and (C) participation in
supervised cardiac rehabilitation programs.
The patients were instructed to maintain the current medications. The tests comprised three moments: conventional 6MWT (6MWT1), 6MWT coupled to a portable gas analyzer (6MWT2), and CPET on a treadmill. Due to a matter related to the hospital's flow, some patients were first assigned randomly to the 6MWT and others to the CPET.
The 6MWT was performed in a hallway with an extension of 30 meters. The first 6MWT (6MWT1) had a learning effect as objective, as recommended in the
literature.6 The second 6MWT (6MWT2) was performed
at least 3 days and no more than 3 weeks after the first, when the patients repeated the 6MWT, but this time they were connected to a portable gas analyzer. The maximum interval between the 6MWT and the CPET was also 3 weeks. Both the 6MWT and the CPET were scheduled by the same evaluator and applied by the same team to
avoid application variability.
We used for the assessments the metabolic analyzer MedGraphics (MGC) VO2000 (Imbrasport, Porto Alegre, RS, Brazil), the system Ergo PC Elite 13, and
the treadmill Centurion 300 (MicroMed, Brasília, DF,
Brazil). The gas analyzer was calibrated before each test by the autocalibration system in a ventilated environment. The biological control of the calibration was performed monthly and the control by the equipment's representative (CAEL, Rio de Janeiro, RJ, Brazil) was conducted every 3 months.
In the CPET, each patient underwent a 2-minute baseline collection followed by a 1-minute warm-up at 1 km/h and 0º slope before starting the ramp protocol. In order to analyze and assess the CPET variables,
we used the software ErgoPCElite for Windows 13W
(MicroMed, Brasília, DF, Brazil). The perceived exertion (PE), assessed by the Borg scale (variation 0-10), and the hemodynamic and electrocardiographic variables were recorded at every minute. During the recovery phase, the patient remained seated. Two referees analyzed the report of the test to obtain the following information:
VE/VCO2 slope value, presence of oscillatory breathing
(OB), and establishment of the ventilatory threshold I, referred from now on as the anaerobic threshold (AT). In order to determine the AT, we used the curves of the
ventilatory equivalents of the VO2 and VCO2, in addition
to the curves of VO2 and VCO2 expired fractions, as
recommended by the CPET guideline of the American
Heart Association(AHA).13
The evaluations were performed while the patients maintained the use of their usual medications, during the same time of the day, and at least 2 hours after the
last meal. Peak VO2 was defined as the highest VO2
value obtained up to the final 30 seconds or 10 seconds into the immediate recovery. In order to determine
the occurrence of OB and the value of the VE/VCO2
slope, we followed the AHA guideline13 and the
recommendations by Guazzi et al.14 Since spirometry
was not performed, the ventilatory reserve was not considered in the analysis. Only one CPET was
performed, as recommended by Scott et al.15
The maximum estimated heart rate (HR) was obtained
using the formula by Tanaka et al.16 and was used to
calculate the chronotropic index.
During the 6MWT, we recorded the HR (Polar monitor, model T31, Oulu, Finland) at each minute, along with the PE according to the Borg scale and the
capillary O2 saturation using a pulse oximeter (Onyx,
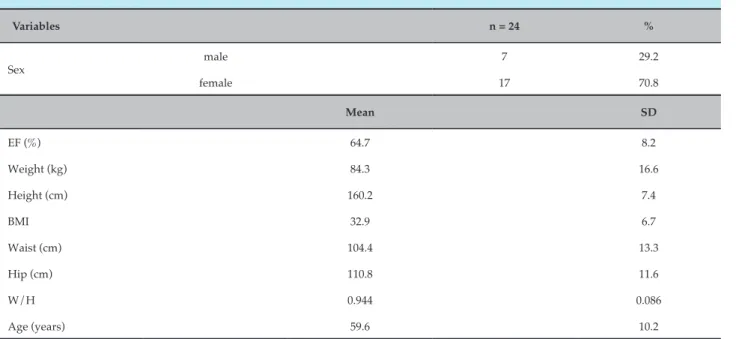
Table 1 – Clinical characteristics of the study population
Variables n = 24 %
Sex
male 7 29.2
female 17 70.8
Mean SD
EF (%) 64.7 8.2
Weight (kg) 84.3 16.6
Height (cm) 160.2 7.4
BMI 32.9 6.7
Waist (cm) 104.4 13.3
Hip (cm) 110.8 11.6
W/H 0.944 0.086
Age (years) 59.6 10.2
Abbreviations: EF: ejection fraction; BMI: body mass index; W/H: waist-to-hip ratio; SD: standard deviation. In order to analyze the gases expired during the 6MWT
and obtain the values of the variables, we used the same
VO2000in a portable mode connected wirelessly to a
computer. We used the software Aerograph, version 4.3
(Imbrasport, Porto Alegre, RS, Brazil), which organized
the data for later analysis.
During the 6MWT, the patient connected to the gas analyzer remained seated for 4 minutes and 30 seconds. After the values of the variables were collected during this resting period, the patient stood up for 30 seconds before initiating the 6MWT, which was performed according to
the guidelines of the American Thoracic Society (ATS).5
All patients completed the 6 minutes of walk. The gas analysis ended after the fifth minute of recovery. The maximum blood pressure (BP) considered in the analysis was the one obtained immediately after the
effort, i.e., after the sixth minute of the walk when
the patient sat down and the BP was then measured between 30-40 seconds during recovery.
Statistical analysis
The numerical data are expressed as mean ± standard deviation (SD) since all the variables included had an approximately normal distribution (p value of the Kolmogorov-Smirnov test > 0.05). Categorical data are expressed as frequency (n) and percentage (%).
The variation of the hemodynamic, metabolic, and ventilatory measurements between the tests (assessments) CPET and 6MWT were analyzed by
Student's t test for paired samples.
A descriptive graphic analysis was performed, presenting the mean and SD values of the measurements
obtained at each minute of the variables HR and VO2,
indicating, for each one of these variables, the maximum CPET values and values equivalent to the AT.
In order to evaluate the correlation levels between the
6MWT distance and the peak VO2 and CPET peak VO2,
we used Pearson's correlation coefficient (r).
We adopted a significance level of 5%. The statistical analysis was performed using the software SAS 6.11 (SAS Institute, Inc., Cary, NC, USA).
Results
Most patients (70.8%) used beta-blockers. The profile of the medications used by the patients showed the usual therapeutic approach for hypertension: beta-blockers, angiotensin-converting enzyme inhibitors (25.0%) or angiotensin receptor blockers (54.1%), calcium channel blockers (37.5%), thiazides (29.1%), and vasodilators (48.5%).
A stratification of the patients according to the results
of the CEPT and following the classification by Weber17
showed a higher percentage of patients categorized as class B (30.4%).
The patients had a mean E/E' of 15.9 ± 4.3, which
fulfilled one of the criteria for diagnosis of HFNEF.11
The mean walked distance was 419.2 ± 76.5 meters during the 6MWT1 and 446.2 ± 67.7 meters during the 6MWT2, with a significant difference between both groups (p = 0.002).
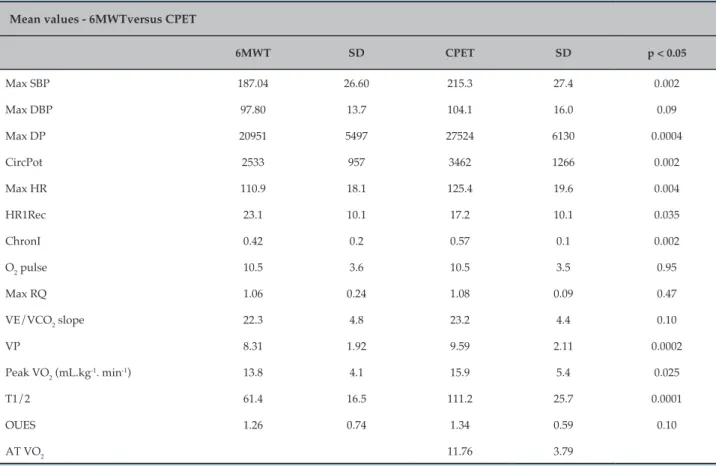
Table 2 shows the maximum values of the variables obtained in the 6MWT2 and in the CPET. There was no difference between the maximum respiratory quotient (RQ) values of the two tests, and their maximum values were greater than 1.0. The results showed increased values at the end of the 6MWT2 (1.04), and of 22 patients who underwent the 6MWT2, 11 had
an RQ ≥ 1.0 (50% of the group). Of these 11 patients, 7 obtained an RQ ≥ 1.10 (31.8% of the sample).
Since BP measurement during the 6MWT was not feasible, BP was only measured in the baseline condition and immediately after the 6MWT. Considering that prior spirometry was not performed, other ventilatory parameters were not assessed.
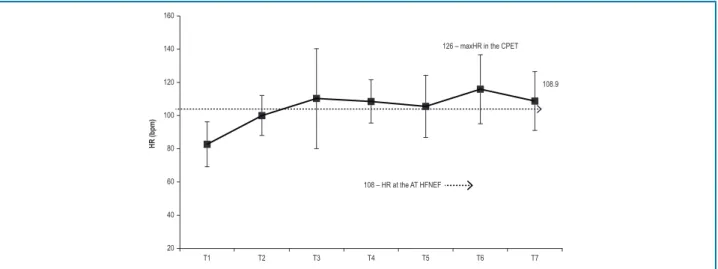
The longitudinal analysis of the HR during the 6MWT2 showed that the group reached stable HR values after the second minute of the 6MWT2 (T3). The maximum HR
Table 2 – Maximum variables obtained in the 6-minute walk test (6MWT) and the cardiopulmonary exercise test (CPET) (n = 22)
Mean values - 6MWTversus CPET
6MWT SD CPET SD p < 0.05
Max SBP 187.04 26.60 215.3 27.4 0.002
Max DBP 97.80 13.7 104.1 16.0 0.09
Max DP 20951 5497 27524 6130 0.0004
CircPot 2533 957 3462 1266 0.002
Max HR 110.9 18.1 125.4 19.6 0.004
HR1Rec 23.1 10.1 17.2 10.1 0.035
ChronI 0.42 0.2 0.57 0.1 0.002
O2 pulse 10.5 3.6 10.5 3.5 0.95
Max RQ 1.06 0.24 1.08 0.09 0.47
VE/VCO2 slope 22.3 4.8 23.2 4.4 0.10
VP 8.31 1.92 9.59 2.11 0.0002
Peak VO2 (mL.kg-1. min-1) 13.8 4.1 15.9 5.4 0.025
T1/2 61.4 16.5 111.2 25.7 0.0001
OUES 1.26 0.74 1.34 0.59 0.10
AT VO2 11.76 3.79
Max SBP: maximum systolic blood pressure; Max DBP: maximum diastolic blood pressure; Max DP: maximum double product;
CircPot: circulatory power; Max HR: maximum heart rate; HR1Rec: heart rate in the first minute of recovery; ChronoI: chronotropic index; O2 pulse: oxygen pulse (mL.kg-1.min-1/bpm); Max RQ: maximum respiratory quotient; VE/VCO
2 slope: ventilation minute to carbon dioxide
production ratio; VP: ventilatory power; peak VO2 (mL.kg-1. min-1): oxygen consumption peak; T1/2: time (in seconds) of the recovery kinetics
160
140
120
100
80
60
40
20
T1 T2 T3 T4 T5 T6 T7
108 – HR at the AT HFNEF
126 – maxHR in the CPET
108.9
HR (bpm)
Figure 1 – Longitudinal progression of the heart rate (HR) during the second 6-minute walk test (6MWT2) in the study participants. HFNEF: heart failure with normal ejection fraction; CPET: cardiopulmonary exercise test; maxHR: maximum heart rate; AT: CPET anaerobic threshold; T1: time zero of the 6MWT (baseline conditions); T2, T3, T4, T5, T6, T7: first, second, third, fourth, fifth, and sixth minutes of the 6MWT, respectively.
during the 6MWT2 (108.9 bpm) was similar to the HR at the CPET AT (108 bpm), shown by the dashed line (Figure 1), and 85.7% compared with the CPET maximum HR (126 bpm), highlighted in the Figure.
The longitudinal progression of the relative VO2
(mL.kg-1.min-1) during the 6MWT2 in the study
participants is shown in Figure 2. Note in the dashed line
the VO2 value of the CPET AT (11.76 mL.kg-1. min-1) and
in the highlighted area, the value of 15.9 mL.kg-1. min-1
of the CPET peak VO2 (Figure 2).
The longitudinal progression of the production of
carbon dioxide (VCO2) during the 6MWT2 occurred in a
similar way to that of the VO2, reaching maximum values
in the 6MWT2 of 11.5 mL.kg-1.min-1 (not displayed).
Pearson's correlation (r) levels found between the maximum walked distance in the 6MWT2 with the
peak VO2 obtained in the same test and between the
walked distance with the CPET peak VO2 were r = 0.528
(p = 0.014) and r = 0.532 (p = 0.013), respectively.
Discussion
A review of the literature on the subject of this study – 6MWT and HFNEF – has shown that most studies in this area are focused on HFREF. Therefore, it became difficult to compare the results found in the present study, which included patients with HFNEF, with data from the literature. Due to that, the discussion below will be based on similar results found in studies with HFREF.
Riley et al.,6 Foray et al.,7 Faggiano et al.,8 and
Kervio et al.10 analyzed the kinetics of variables using a
portable gas analyzer and demonstrated that the kinetics and other cardiovascular parameters are decreased in HFREF in response to the effort imposed by the 6MWT. However, no studies have described how the kinetics of patients with HFREF respond during this test.
Among the study patients, there was a predominance of patients of the female gender, with hypertension,
and with an increased body mass index (BMI),3,11
characteristics that confirm the typical clinical profile of patients with HFNEF.
The average distance walked is within the values that indicate a good prognosis, i.e., above 300 meters.5,18
A significant percentage (81.81%) equaled or increased in the 6MWT2 the distance walked during the 6MWT1 but
did not obtain values of clinical significance, i.e., above
50 meters.5 This reinforces the importance of conducting
at least one learning and familiarization test due to a
potential influence on the results of the 6MWT.6,19
The distances obtained are aligned with the average values found in studies with patients with HFREF,
such as those by Kervio et al.10 (452.6 ± 18.7 meters),
Faggiano et al.8 (419 ± 120 meters), and Guimarães et al.9
(470 ± 48 meters).
The correlation levels found between the 6MWT2
and the peak VO2 in the 6MWT1 and with the CPET
peak VO2 are aligned with findings in the literature,
despite some discrepancies. Some authors report a good correlation between the distance of the 6MWT and the
peak VO2, with an average of 0.73 in patients with HF6,19
(all with HFREF). Riley et al.6 found a high correlation
18
16
14
12
10
8
6
4
2
0
T1 T2 T3 T4 T5 T6 T7
11.76 – VO2 at the CPET AT
13.7 15.9 CPET peak VO2
VO
2
(mL.kg
–1.min –1)
Figure 2 – Longitudinal progression of the relative VO2 (mL/kg/min-1) during the 6MWT2. HFNEF: heart failure with normal ejection fraction;
CPET: cardiopulmonary exercise test; VO2: oxygen consumption (mL.kg-1.min-1); T1: time zero of the 6MWT (baseline conditions); T2, T3, T4, T5, T6,
T7: first, second, third, fourth, fifth, and sixth minutes of the 6MWT, respectively, AT: anaerobic threshold.
low correlation with the walked distance in the 6MWT (r = 0.28 and r = 0.24, respectively). Such discrepancies could be attributed to different methodologies of the 6MWT and the type of ergometers used.
The HFREF studies found in the literature assessing the 6MWT with portable gas analyzers and performed in a hallway were: Riley et al.,6 Foray et al.,7 Faggiano et al.,8
and Kervio et al.10 Guimarães et al.9, in turn, used the
gas analyzer during two 6MWT tests performed on a treadmill, also in patients with HFREF.
In regards to HR parameters, the study group showed more stable values after the second minute
of the 6MWT (T3). Kervio et al.10 highlight that earlier
achievement of a stable state reflect better clinical conditions and, therefore, less severe ones.
The HR at the end of the 6MWT was 85.7% of the CPET maximum HR, which is similar to the percentage
values of the peak VO2 in the 6MWT in relation to the
CPET peak VO2.
It is noteworthy that the final HR in the 6MWT was similar to the HR in the CPET AT, reinforcing that the 6MWT represents an intense effort, carried out at the
level of or above the CPET AT in patients with HF.6-8,10
Despite the authors’ claim that patients with HFNEF present HR alterations in the first minute of
recovery (HR1Rec)22 and the fact that there are no data
in the literature related to the 6MWT, if we consider the recommended value of 12 bpm, this value was within the normal limits both in the T6M as well as
in the CPET.23
The chronotropic index analysis demonstrated a chronotropic incompetence, even if we consider the use of beta-blockers (normal > 0.60), both in relation to the
6MWT as well as to the CPET, as found in the literature.24
The maximum O2 pulse in the 6MWT and the CPET
showed no difference between the two tests, yielding
reduced pulse O2 values in relation to the predicted
one (< 85%), around 70%, and with absolute values
below 12 mL.kg-1.min-1/bpm, which is considered of
poor prognosis.25
In relation to the two ventilatory variables analyzed,
no difference in the VE/VCO2 slope was observed.
The VE/VCO2 slope values are within the values cited
as indicative of good prognosis (< 30),13 and this fact
associated with the lack of difference between the two tests can reinforce the prognostic ability of the 6MWT. The ventilatory power (VP) analysis also showed a difference between the two tests, with higher values for the CPET. The VP, which combines the response of the
SBP with the VE/VCO2 slope(VP = SBP x VE/VCO2
slope)26 showed a difference probably due to the higher
SBP in the CPET. However, good prognosis values (> 3.5) were observed for both tests.26
The RQ is a criterion to obtain intense (> 1.0) or maximum effort in exercises of increasing intensity
(> 1.15).13 There was no difference between the maximum
RQ values between the two tests. The data found here
are in agreement with those found by Kervio et al.,10 who
consider the RQ in the 6MWT as reflecting intense effort.
Both in the population with HFREF10 and in patients with
RQ > 1.0. Other authors agree and claim that the greater the functional deficiency of the studied cohort, the more
the 6MWT would be executed close to the maximum.6-8
In the analysis of the VE/VO2, the curve first
descended and then ascended, which became significant after the fifth minute of the test (T6 and T7). Such progression is one of the criteria used to identify
the CPET AT.13,24 When this concept is transferred to the
6MWT, it confirms that it represents an effort similar to or slightly above the AT.
In regards to the VE/VCO2, the values stabilized after
the second minute of effort (T3), with peak values slightly above those of the CPET AT (24.5 ± 3.1 in the 6MWT versus 23.6 of the CPET AT).The VE/VCO2 stabilized in values that do not reflect ventilatory inefficiency.
The relative VO2 in the 6MWT showed stable values
and its progression in patients with HFNEF did not differ from that found in similar studies in patients with HFREF, both in terms of progression during the 6MWT as well as in regards to the percentages obtained
in relation to the CPET:6-8,10 it reached values above the
VO2 corresponding to the CPET AT and of significant
percentages of the CPET peak VO2 (86.45%).
The variable VCO2 tended to stabilize after T5 (the
fourth minute of the 6MWT), which contrasts with the
data presented by Kervio et al.,10 in which this variable
did not reach a stable state until the end of the 6MWT in patients with HFREF.
The patients with HFREF in the study by Kervio et al.10
performed their 6MWT above the relative VO2 of the
CPET AT, which is aligned with findings in patients with
HFNEF in this study. The VO2 at the CPET AT obtained
by Kervio et al.10 (11.7 ± 0.6 mL.kg-1.min-1) is also very
similar to that found in this study (11.76 mL.kg-1.min-1).
It is interesting to note that 7 out of 22 patients in the
present study had peak VO2 in the 6MWT equal to or
greater than the CPET peak VO2, representing 31.8%
of the total sample. This percentage value is aligned
and supersedes those by Faggiano et al.8 (27.0%) in a
HFREF population.
The high intensity of the 6MWT for patients with HF
is reinforced by findings from the study by Kervio et al.,10
Faggiano et al.,8 and Foray et al.,7 which demonstrated
that the 6MWT leads to a demand above 85% of the values
of the CPET relative peak VO2.
Faggiano et al.8 found a peak VO
2 at 86% of the CPET,
which represented 73.0% of the VO2 of the CPET AT.
The present study showed similar percentages in
relation to the CPET, but the VO2 at the CPET AT
presented higher percentages, corresponding to 85.03%
of the peak VO2 in the 6MWT in patients with HFNEF.
Guimarães et al.9 analyzed the results of a single
CPET and 6MWT on a treadmill, with the participants connected to a gas analyzer and, using an incentive,
found a peak VO2 at 90% of the CPET.
The values of the CPET relative peak VO2 are aligned
with the findings by Guazzi et al.27 These authors
found CPET peak VO2 values of 15 mL.kg-1.min-1 in
HFNEF patients.
The oxygen uptake efficiency slope (OUES) showed lower values in the 6MWT, but no difference in values was observed between the 6MWT and the CPET. Although the literature indicates that reduced values in
both HFREF and HFNEF,13 the HFNEF patients evaluated
obtained values above 1.2, which are considered to be of
poor prognosis.28
The metabolic variable with the most difference was the kinetics of oxygen consumption during recovery (T1/2), which showed a significantly greater recovery time in the CPET. The T1/2 values in the 6MWT
did not fulfill the criteria of poor prognosis.13,24,29
Considering that the value of 90 seconds29 in the CPET,
the study participants exceeded this value.
Conclusion
There is an actual possibility of patients with HFNEF to be are able to perform a 6MWT at maximum or almost maximum intensity. This estimate is based on the following observations: high percentages obtained in peak values in the 6MWT in relation to the maximum
value of the variables HR (85.7%) and relative VO2 (86.4%)
in the CPET, similar RQ values, similar peak VO2 values
in the 6MWT and at the CPET AT, and the progression
of the VE/VO2, which after reaching a nadir, showed a
trend to curve upward.
It should be noted that in relation to the reviewed studies, all conducted in patients with HFREF, the assessed variables in HFNEF showed, on average, an equal profile during the 6MWT.
Study limitations
Some limitations in this study are identified:
1. Burkhoff D, Maurer MS, Packer M. Heart failure with a normal ejection fraction. is it really a disorder of diastolic function? Circulation. 2003;107(5):656-8. PMID: 12578861.
2. Vasan RS, Benjamin EJ, Levy D. Prevalence, clinical features and prognosis of diastolic heart failure: an epidemiologic perspective. J Am Coll Cardiol. 1995;26(7):1565-74. doi: 10.1016/0735-1097(95)00381-9.
3. Zile MR, Kjellstrom B, Bennett T, Cho Y, Baicu CF, Aaron MF, et al. Effects of exercise on left ventricular systolic and diastolic properties in patients with heart failure and a preserved ejection fraction versus heart failure and a reduced ejection fraction. Circ Heart Fail. 2013;6(3):508-16. doi: 10.1161/CIRCHEARTFAILURE.112.000216.
4. Downing J, Balady GJ. The role of exercise training in heart failure. J Am Coll Cardiol. 2011;58(6):561-9. doi: 10.1016/j.jacc.2011.04.020.
5. ATS Committee on Proficiency Standards for Clinical Pulmonary Function Laboratories. ATS statement: guidelines for the six-minute walk test. Am J Respir Crit Care Med. 2002;166(1):111-7. doi: 10.1164/ ajrccm.166.1.at1102.
6. Riley M, McParland J, Stanford CF, Nicholls DP. Oxygen consumption during corridor walk testing in chronic cardiac failure. Eur Heart J.1992;13(6):789-93. PMID: 1623869.
7. Foray A, Williams D, Reemtsma K, Oz M, Mancini D. Assessment of submaximal exercise capacity in patients with left ventricular assist devices. Circulation. 1996;94(9 Suppl):II-222-6. PMID: 8901750.
8. Faggiano P, D’Aloia A, Gualeni A, Lavatelli A, Giordano A. Assessment of oxygen uptake during the 6-minute walking test in patients with heart failure: preliminary experience with a portable device. Am Heart J. 1997;134(2 Pt 1):203-6. PMID: 9313598.
9. Guimarães GV, Bellotti G, Bacal F, Mocelin A, Bocchi EA. Can the cardiopulmonary 6-minute walk test reproduce the usual activities of
patients with heart failure? Arq Bras Cardiol. 2002;78(6):553-60. http:// dx.doi.org/10.1590/S0066-782X2002000600003.
10. Kervio G, Ville NS, Leclercq C, Daubert JC, Carre F. Cardiorespiratory adaptations during the six-minute walk test in chronic heart failure patients. Eur J Cardiovasc Prev Rehabil. 2004;11(2):171-7. PMID: 15187823.
11. Paulus WJ, Tschöpe C, Sanderson JE, Rusconi C, Flachskampf FA, Rademakers FE, et al. How to diagnose diastolic heart failure: a consensus statement on the diagnosis of heart failure with normal left ventricular ejection fraction by the Heart Failure and Echocardiography Associations of the European Society of Cardiology. Eur Heart J.2007;28(20):2539-50. doi: 10.1093/eurheartj/ehm037.
12. Fletcher GF, Ades PA, KligfieldP, Arena R, Balady GF, Bittner VA, et al; American Heart Association Exercise, Cardiac Rehabilitation, and Prevention Committee of the Council on Clinical Cardiology, Council on Nutrition, Physical Activity and Metabolism, Council on Cardiovascular and Stroke Nursing, and Council on Epidemiology and Prevention. Exercise standards for testing and training: a scientific statement from the American Heart Association. Circulation. 2013;128(8):873-934. doi: 10.1161/CIR.0b013e31829b5b44.
13. Balady GJ, Arena R,Sietsema K, Myers J, Coke L, Fletcher, GF, et al; American Heart Association Exercise, Cardiac Rehabilitation, and Prevention Committee of the Council on Clinical Cardiology; Council on Epidemiology and Prevention; Council on Peripheral Vascular Disease; Interdisciplinary Council on Quality of Care and Outcomes Research. Clinician’s Guide to cardiopulmonary exercise testing in adults a scientific statement from the American Heart Association. Circulation. 2010;122(2):191-225. doi: 10.1161/CIR.0b013e3181e52e69.
14. Guazzi M, Raimondo R, Vicenzi M, Arena R, Proserpio C, Sarzi Braga S, et al. Exercise oscillatory ventilation may predict sudden cardiac death in heart failure patients. J Am Coll Cardiol. 2007;50(4):299-308. doi: 10.1016/j.jacc.2007.03.042.
References
• The predominance of the female gender and overweight/obesity, characteristic of HFNEF, may have influenced the variables related to functional capacity in both 6MWT and CPET.
• The peripheral determinants of peak VO2, such
as the oxygen transportation system or changes in peripheral muscles, were not considered in the functional assessment.
• The use of beta-blockers and other medications may have influenced the interpretation of variables that integrate HR or BP in their calculation.
Author contributions
Conception and design of the research: Teixeira JAC, Nobrega ACL, Araujo DV. Acquisition of data: Teixeira JAC, Messias LR, Dias KP, Costa WLB, Cascon RM, Miranda SMR, Teixeira PS, Jorge JG. Analysis and interpretation of the data: Teixeira JAC, Messias LR, Dias KP, Costa WLB, Teixeira PS, Nobrega ACL, Araujo DV. Writing of the manuscript: Teixeira JAC, Teixeira PS, Jorge JG. Critical revision of the manuscript
for intellectual content: Teixeira JAC, Nobrega ACL, Araujo DV. Bibliographic Survey: Teixeira JAC, Messias LR, Miranda SMR. Bibliographic Review: Costa WLB, Cascon RM.
Potential Conflict of Interest
No potential conflict of interest relevant to this article was reported.
Sources of Funding
There were no external funding sources for this study.
Study Association
This article is part of the thesis of associate professor submitted by José Antônio Caldas Teixeira, from Universidade Federal Fluminense.
Ethics approval and consent to participate
15. Scott JM, Haykowsky MJ, Eggebeen J, Morgan TM, Brubaker PH, Kitzman DW. Reliability of peak exercise testing in patients with heart failure with preserved ejection fraction. Am J Cardiol. 2012;110(12):1809-13. doi: 10.1016/j.amjcard.2012.08.015.
16. Tanaka H, Monahan KD, Seals DR. Age-predicted maximal heart rate revisited. J Am Coll Cardiol. 2001;37(1):153-6. PMID: 11153730.
17. Task Force of the Italian Working Group on Cardiac Rehabilitation and Prevention (Gruppo Italiano di Cardiologia Riabilitativa e Prevenzione, GICR), Working Group on Cardiac Rehabilitation and Exercise Physiology of the European Society of Cardiology. Statement on cardiopulmonary exercise testing in chronic heart failure due to left ventricular dysfunction: recommendations for performance and interpretation. Part III: Interpretation of cardiopulmonary exercise testing in chronic heart failure and future applications. Eur J Cardiovasc Prev Rehabil. 2006;13(4):485-94. doi: 10.1097/01.hjr.0000201518.43837.bc.
18. Arslan S, Erol MK, GundogduF, Sevimli S, Aksakal E, Senocak H, et al. Prognostic value of 6-minute walk test in stable outpatients with heart failure. Tex Heart Inst J. 2007;34(2):166-9. PMID: 17622362.
19. Faggiano P, D’Aloia A, Gualeni A, Brentana L, Dei Cas L. The 6 minute walking test in chronic heart failure: indications, interpretation and limitations from a review of the literature. Eur J Heart Fail. 2004;6(6):687-91. doi: 10.1016/j.ejheart.2003.11.024.
20. Lucas C, Stevenson LW, Johnson W, Hartley H, Hamilton MA, Walden J, et al. The 6-min walk and peak oxygen consumption in advanced heart failure: aerobic capacity and survival. Am Heart J. 1999;138(4 Pt 1):618-24. PMID: 10502205.
21. Roul G, Germain P, Bareiss P. Does the 6-min walk test predict the prognosis in patients with NYHA class II or III chronic heart failure? Am Heart J. 1998;136(3):449-57. PMID: 9736136.
22. Guazzi M, Myers J, Peberdy MA, Bensimhon D, Chase P, Arena R. Cardiopulmonary exercise testing variables reflect the degree of diastolic dysfunction in patients with heart failure–normal ejection
fraction. J Cardiopulm Rehabil Prev. 2010;30(3):165-72. doi: 10.1097/ HCR.0b013e3181d0c1ad.
23. Cole CR, Foody JM, Blackstone EH, Lauer MS. Heart rate recovery after submaximal exercise testing as a predictor of mortality in a cardiovascularly healthy cohort. Ann Intern Med. 2000;132(7):552-5. PMID: 10744592.
24. Meneghelo RS, Araújo CG, Stein R, Mastrocolla LE, Albuquerque PF, Serra SM, et al; Sociedade Brasileira de Cardiologia. [III Guidelines of Sociedade Brasileira de Cardiologia on the exercise test]. Arq Bras Cardiol. 2010;95(5 supl. 1):1-26. doi: http://dx.doi.org/10.1590/S0066-782X2010000800001.
25. Oliveira RB, Myers J, Araújo CG, Abella J, Mandic S, Froelicher V. Maximal exercise oxygen pulse as a predictor of mortality among male veterans referred for exercise testing. Eur J Cardiovasc Prev Rehab. 2009;16(3):358-64. doi: 10.1097/HJR.0b013e3283292fe8.
26. Forman DE, Guazzi M, Myers J, Chase P, Bensimhon D, Cahalin LP, et al. Ventilatory power: a novel index that enhances prognostic assessment of patients with heart failure. Circ Heart Fail. 2012;5(5):621-6. doi: 10.1161/ CIRCHEARTFAILURE.112.968529.
27. Guazzi M, Dickstein K, Vicenzi M, Arena R. Six-minute walk test and cardiopulmonary exercise testing in patients with chronic heart failure: a comparative analysis on clinical and prognostic insights. Circ Heart Fail. 2009;2(6):549-55. doi: 10.1161/ CIRCHEARTFAILURE.109.881326.
28. Hollenberg M, Tager IB. Oxygen uptake efficiency slope: an index of exercise performance and cardiopulmonary reserve requiring only submaximal exercise. J Am Coll Cardiol. 2000;36(1):194-201. PMID: 10898434.
29. Cohen-Solal A, Tabot JY, Logeart D, Bourgoin P, Tokmakova M, Dahan M. A non-invasively determined surrogate of cardiac power (‘circulatory power’) at peak exercise is a powerful prognostic factor in chronic heart failure. Eur Heart J. 2002;23(10):806-14. doi: 10.1053/ euhj.2001.2966.