ABSTRACT
BACKGROUND AND OBJECTIVES:Low back pain is a ma-jor musculoskeletal system problem and generates high costs for the health system. Regardless of etiology, chronic low back pain patients tend to decrease their physical activities routine, thus impairing itness and mood. So, it is necessary to establish the relationship among variables involved in the etiology of low back pain, which are noxious for patients’ performance. his study aimed at comparing the distance covered during a six-minute walk test (6MWT) and the following psychosocial variables: mood perception and level of disability between chronic low back pain and healthy individuals. METHOD: his was an observational transversal study with volunteers of both genders, sedentary, aged between 30 and 58 years, who were divided in control group (CG) and low back pain group (LG). Volunteers answered a battery of question-naires, as follows: Oswestry Disability Index and Brunel Mood Scale to determine the level of disability and mood perception, respectively. hen, volunteers made the 6MWT.
RESULTS:LG (25.44 ± 14.3%) had signiicantly higher levels of disability as compared to CG (1.25 ± 2.1%). It was also ob-served that LG had signiicantly higher levels of stress, fatigue and mental confusion as compared to CG.
CONCLUSION:Low back pain patients were no diferent from their pain-free peers in six-minute walk test performance, de-pression, anger and vigor mood state. However, they presented
Comparison of psychosocial and functional performance variables in a
group of chronic low back pain patients*
Comparação entre variáveis psicossociais e de desempenho funcional em um grupo de
pacientes com lombalgia crônica
Giovanna de Araújo Fracaro1, Welds Rodrigo Ribeiro Bertor1, Lígia Inez da Silva1, Lana Brandl1, Gabriela Matté Zanini1, Marina Zilio1, Endianara Dall Agnol1, Bruno Porgorzelski Rocha1, Alberito Rodrigo de Carvalho2
*Received from the Physical Therapy School Clinic and Human Movement Research Laboratory (LAPEMH), State University of Western Paraná (UNIOESTE). Cascavel, PR, Brazil.
1. Students of the Physical herapy Course, State University of Western Paraná (UNIOESTE). Cascavel, PR, Brazil.
2. Master in Human Movement Sciences (UFRGS), professor of the Physical herapy course, State University of Western Paraná (UNIOESTE), linked to the Neuro-Musculo-skeletal Rehabilitation Research Group. Cascavel, PR, Brazil.
Submitted in January 06, 2013. Accepted for publication in May 27, 2013. Conlict of interests: None.
Sponsoring sources: Physical Rehabilitation Center, UNIOESTE.
Correspondence to:
Alberito Rodrigo de Carvalho, M.D.
Universidade Estadual do Oeste do Paraná (UNIOESTE) – Clínica Escola de Fisioterapia Rua Universitária, 1619 - Jardim Universitário
85819-110 Cascavel, PR. Fone: (45) 3220-3157
E-mail: [email protected]
higher levels of disability and poorer indices of fatigue, stress and mental confusion mood states.
Keywords:Disability and health, International Functional Clas-siication, Low back pain, Mood disorders.
RESUMO
JUSTIFICATIVA E OBJETIVOS: A dor lombar é um dos prin-cipais problemas do aparelho musculoesquelético e gera alto custo para o sistema de saúde. Independente da etiologia, os portadores de dor lombar crônica tendem a reduzir sua rotina de atividades físicas, o que compromete o condicionamento físico e o estado de humor. Portanto, estabelecer a relação entre as variáveis envolvidas na etiologia da lombalgia prejudiciais ao desempenho entre os seus portadores se faz necessário. O objetivo deste estudo foi comparar a distância percorrida no teste de caminhada de seis minutos (TC6) e as variáveis psicossociais: percepção de humor e nível de incapa-cidade entre portadores de dor lombar crônica e sujeitos saudáveis. MÉTODO: Estudo observacional transversal cuja amostra foi com-posta por voluntários de ambos os sexos, sedentários, com idade en-tre 30 e 58 anos, dividida em grupo controle (GC) e grupo lombar (GL). Os voluntários responderam a uma bateria de questionários: a saber, o Índice de Incapacidade de Oswestry e a Escala de Humor de Brunel para determinação do nível de incapacidade e da percepção de humor, respectivamente. Em seguida, realizaram o TC6. RESULTADOS: O GL (25,44 ± 14,3%) apresentou níveis de in-capacidade signiicativamente maiores que o GC (1,25 ± 2,1%). Também se observou que o GL apresentou níveis de tensão, fa-diga e confusão mental signiicativamente mais alto que o GC. CONCLUSÃO: Portadores de dor lombar crônica não apre-sentaram diferença, em relação aos seus pares livres de dor, no desem penho do TC6, no estado de humor de depressão, de raiva e de vigor. Contudo, apresentaram maiores níveis de incapacida-de e piores índices no estado incapacida-de humor incapacida-de fadiga, incapacida-de tensão e incapacida-de confusão mental.
Descritores: Classiicação Internacional de Funcionalidade, Dor lombar, Incapacidade e saúde, Transtornos de humor.
INTRODUCTION
In addition, chronic low back pain patients tend to feel un-able to carry out their daily activities and often have a strong belief that any functional activity will worsen pain or cause some physical impairment or limitation. his leads individu-als to refuse to perform their common activities, leading to pain, immobilization and pain vicious circle1.
From the psychosocial point of view, it is observed that indi-viduals with musculoskeletal pain develop the chronic pain syndrome, which is related to fear of performing activities triggering pain and/or generating disease recurrence. his behavior brings physical and psychological disorders which contribute to disease chronicity3.
Health professionals dealing with chronic low back pain patients should be concerned not only with motor mani-festations of such disorder, but also with psychosocial rela-tionships, which involve patients’ emotional conditions, characterized by major mood state oscillations, with a feeling of hostility with regard to others and themselves4.
As from already described data, it seems justiiable to ask whether there are diferences between healthy and chronic low back pain individuals with regard to functional tests per-formance and psychosocial variables which may inluence such performance. Answers to these questions would be an important step toward orienting evaluation routines and the development of therapeutic goals in the rehabilitation ield. Primary hypothesis raised by this study is that chronic low back pain patients have poorer functional tests performance as compared to their pain-free peers and also that some psy-chosocial indicators, such as level of disability and mood states, are worsened in such subjects.
So, this study aimed at comparing the distance covered in the six-minute walk test (6MWT) and the following psychosocial variables: mood perception and disability level between low back pain patients and pain-free individuals.
METHOD
his was an observational transversal study carried out after sample calculation determined by the variable “distance cov-ered in 6MWT”, normalized by the predicted distance for the same test according to age, gender, height and body mass of volunteers (WinPepi software version 11.18; power = 0.18; signiicance level 5%; DC control group (CG) = 0.12; DC low back pain group (LG) = 0.18; diference to be detected = 0.8; n = 9 for each group) with chronic low back pain, of both genders, aged between 25 and 59 years, from the Physi-cal Rehabilitation Center, State University of Western Paraná (UNIOESTE).
Patients were recruited in an intentional and non probabilis-tic manner to compose LG. CG was made up of individuals without systemic or musculoskeletal, chronic or acute disor-ders in lower limbs or spine and were paired by age, weight and height with regard to LG. Volunteers from both groups could not be smokers or former smokers for a period less than ive years; should not practice systematized and routine physi-cal exercises two or more times a week for at least 30 minutes;
should not have visible postural misalignments.
After explaining the objectives and procedures of the study to volunteers, participants were submitted to a screening evalu-ation to collect anthropometric data and to identify possible non inclusion or exclusion criteria.
For CG, inclusion criterion was availability to participate in evaluations and tests in predetermined days and times. For LG, inclusion criteria were: individuals with speciic low back pain persisting for more than three months, the clinical and physical characteristics of whom would be compatible with evaluation and treatment guidelines proposed by the American College of Physicians and by the American Pain Society, in category 2 (low back pain potentially associated to radiculopathy or spinal stenosis)5.
Non inclusion and exclusion criteria speciic for LG were: individuals with low back pain and history suggesting clas-siication in categories 1 (nonspeciic low back pain) and 3 (low back pain potentially associated to other speciic spinal cause) of the evaluation and treatment guidelines proposed by the American College of Physicians and by the American Pain Society, which include a small number of patients with se-vere or progressive neurological deicits or conditions requir-ing immediate evaluation (such as tumor, infection or cauda equina syndrome), patients with other conditions which may respond to speciic treatments (such as ankylosing spondylitis and other rheumatic diseases and/or compression vertebral fractures)5, as well as patients with acute pain or worsened
presentation equal to or above seven by the visual analog scale (VAS).
Non inclusion and exclusion criteria common to both groups were: patients with history of spinal surgery; volunteers with cognitive deicits; pregnant volunteers or individuals with cardiovascular diseases where exercises were contraindicated; volunteers without hemodynamic conditions favorable to perform 6MWT, decompensated hypertensive subjects, his-tory of cardiopathy, pneumopathy and/or neuropathy. Once the sample was selected, questionnaires were applied to determine the level of disability, mood perception and kine-siophobia, being the latter applied only to LG and used just to characterize this group.
Disability level was determined by the Brazilian Version of Oswestry Disability Index adapted from the original – version 2.0, with recognized reliability (α Cronbach = 0.87; CCI = 0.99)6. his is a questionnaire with 10 questions, each one
with six possible answers, which relect the impact of low back pain on individuals’ daily and social activities. Volun-teers were scored (in absolute values) from zero to ive accord-ing to the answers given to each question. he irst option corresponded to zero and the last to ive. So, ive was the maximum score for each question and 50 was the maximum score for the questionnaire as a whole. If any question was not answered, total score obtained by the questionnaire was divid-ed by the maximum possible total for the questionnaire, with-out considering the score of the excluded question. Scores are shown in percentages.
(BRUMS) in a version translated and validated for the Portu-guese language7. Its validation had good internal consistency
with alpha Cronbach values above 0.70, thus being a reli-able tool to measure Brazilian mood. his scale provides a fast measurement of mood state through six markers (subscales), as follows: tension (musculoskeletal tension), depression (de-pressive mood state), anger (hostility), vigor (state of energy, enthusiasm and activity), fatigue (exhaustion, apathy and low level of energy), and mental confusion (stunning).
he higher the score of each subscale, the higher the repre-sentation of the evaluated item. Each subscale has four items and each item receives a score varying in integers from zero to four. So, the score of each subscale goes from zero to 16. he scale was delivered in printed sheets to volunteers who checked, for all 24 items of the scale (4 items x 6 subscales), the score that better described what they were feeling at that exact moment with regard to the item: 0 (nothing), 1 (a lit-tle), 2 (moderately), 3 (a lot), 4 (extremely). his scale was reapplied in two other moments. Scores of each subscale were individualized for statistical analysis.
Kinesiophobia index for LG, expressed in points, was 41.4 ± 8.9. Kinesiophobia was evaluated by the Brazilian Version of the Tampa Kinesiophobia Scale3. his is a self-applicable
questionnaire made up of 17 questions addressing pain and intensity of symptoms. Scores vary from one to four being that “totally disagree” corresponds to one point, “partially disagree” corresponds to two points, “partially agree” to three points, and “totally agree” to four points. To obtain the inal score, it is necessary to invert the scores of questions 4, 8, 12 and 16. Final score may be at least 17 and at the utmost 68 points, being that the higher the score, the higher the level of kinesiophobia.
Functional capacity was measured by the six-minute walk test (6MWT)8. Initially, volunteers remained at rest for ive
min-utes before the test for hemodynamic normalization and then vital signs were collected: heart rate (HR), respiratory rate (RR) and blood pressure (BP). hose with BP above 150/100 mmHg or HR above 110 bpm were excluded from the study. 6MWT was applied in a 30-meter length corridor delimited by a metrically marked strip, in lat surface where volunteers would walk outward and back, many times as necessary, within the time limit of 6 minutes, with standardized verbal stimuli. Volunteers mean HR was monitored by a frequency counter.
Participants were oriented to walk as fast as possible, however without running, until the investigator would request them to stop after six minutes of data collection. hey were also asked to slow down or even to stop the test in case of chest pain, respiratory diiculty and discomfort, severe muscle pain, dizziness or nausea. Vital signs were again measured im-mediately after the test and the distance covered by each one was recorded.
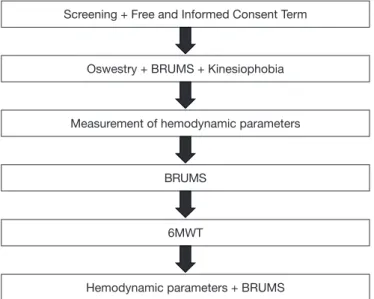
Figure 1 shows the sequence of methodological procedures. As from anthropometric data collected during screening, pre-dictive distances for volunteers age, gender, height and body mass were calculated and considered as reference values by
equations proposed by the literature9: males – predicted
dis-tance (m) = 7.57 x height [m] – (5.02 x age [years]) – (1.76 x body mass [kg]) – 309 m; females – predicted distance (m) = (2.11 x height [m]) – 5.78 x age [years]) – 2.29 x weight [kg] + 667 m.
Statistical analysis
6MWT data were normalized dividing the test value by the predicted value (covered/predicted distances ratio). Normal-ization has helped seeing how much the test value got close to predicted value, so that: ratio >1 individual did not reach the predicted value; ratio = 1 test value was equal to predicted value; and ratio > 1 test value was higher than predicted value. he SPSS 15.0 software was used for statistical analysis. Mann-Whitney U test was used for comparisons, with α = 0.05.
he size of the efect for each variable considering power of ef-fect as low (r value from 0.10 to 0.29), medium (r value from 0.30 to 0.49) and high (r value > 0.50) was calculated. he size of the efect is an objective and standardized measure of the magnitude of a given observed efect regardless of statisti-cal signiicance.
his study was approved by the Human Research Ethics Committee, UNIOESTE, opinion 015/2012.
RESULTS
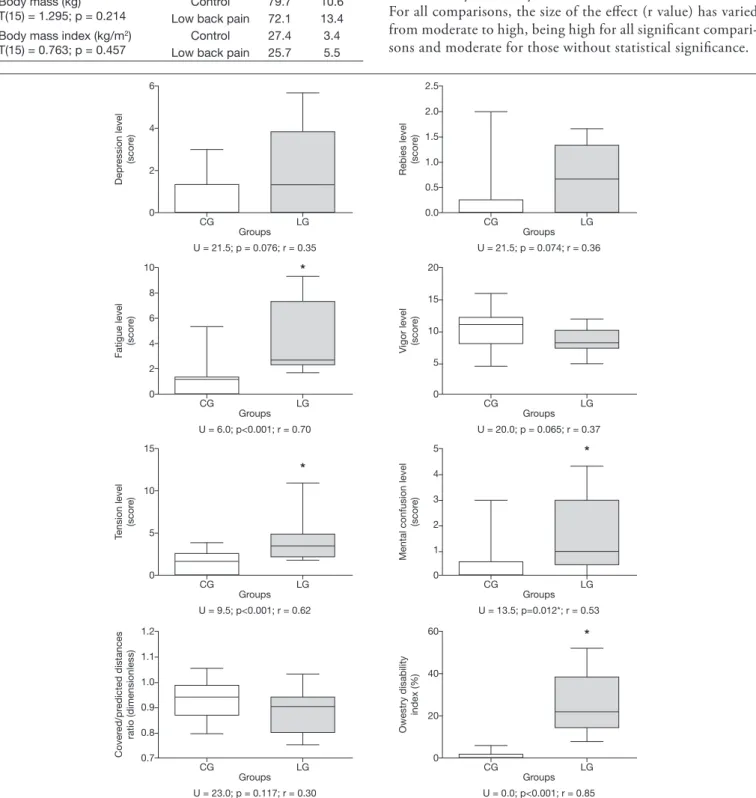
Final sample was: CG (n = 8) and LG (n = 9). here has been no diference in anthropometric data and age between groups. Table 1 shows mean values with their respective stan-dard deviations and comparative statistics. Mean duration of pain chronicity, in months, for LG was 101.3 ± 99.4, with minimum of 12 and maximum of 348 months.
Although without signiicant diferences in walking ratio
Figure 1 – Sequence of methodological procedures.
Oswestry Disability Index and Brunel Mood Scale.
Screening + Free and Informed Consent Term
Oswestry + BRUMS + Kinesiophobia
Measurement of hemodynamic parameters
BRUMS
6MWT
(predicted/covered), LG volunteers had disability levels sig-niicantly higher as compared to CG.
It was also observed that LG had signiicantly higher levels of tension, fatigue and mental confusion as compared to CG. Graph 1 shows descriptive and inferential statistics for all variables (depression, anger, fatigue, vigor, tension, mental confusion indices, in addition to covered/predicted distances and Oswestry Disability Index).
For all comparisons, the size of the efect (r value) has varied from moderate to high, being high for all signiicant compari-sons and moderate for those without statistical signiicance.
Table 1 – Intergroup descriptive and comparative statistics among va-riables characterizing the sample.
Variables Groups Mean Standard Deviation Comparative Statistics
Height (cm)
T(15) = 0.893; p = 0.385
Control 170.0 8.0 Low back pain 166.5 7.9 Age (years)
T(11.8) = 0.338; p = 0.741
Control 41.5 5.3 Low back pain 40.1 10.9 Body mass (kg)
T(15) = 1.295; p = 0.214
Control 79.7 10.6 Low back pain 72.1 13.4 Body mass index (kg/m2)
T(15) = 0.763; p = 0.457
Control 27.4 3.4 Low back pain 25.7 5.5
Graph 1 – Descriptive and inferential statistic of intergroup comparisons for mood state, capacity level and covered/predicted distances ratio variables, as well as size of the effect (r value) for each comparison.
*Statistical difference for LG as compared to CG. 6
4
2
0
Depr
ession level (scor
e
)
CG LG
Groups U = 21.5; p = 0.076; r = 0.35
10
8
6
4
2
0
Fatigue level
(scor
e)
CG LG
Groups U = 6.0; p<0.001; r = 0.70
15
10
5
0
Tension level
(scor
e
)
CG LG
* *
*
*
Groups U = 9.5; p<0.001; r = 0.62
1.2
1.1
1.0
0.9
0.8
0.7
Cover
ed/pr
edicted distances
ratio (dimensionless)
CG LG
Groups U = 23.0; p = 0.117; r = 0.30
2.5
2.0
1.5
1.0
0.5
0.0
Rebies level
(scor
e
)
CG LG
Groups U = 21.5; p = 0.074; r = 0.36
20
15
10
5
0 Vigor level (scor
e
)
CG LG
Groups U = 20.0; p = 0.065; r = 0.37
5
4
3
2
1
0
Mental confusion level
(scor
e
)
CG LG
Groups U = 13.5; p=0.012*; r = 0.53
60
40
20
0
Owestry disability
index (%)
CG LG
DISCUSSION
he hypothesis of this study was only partially conirmed, since there was no diference between CG and LG in 6MWT performance and in some psychosocial variables (depression, anger and vigor); however, there have been signiicant difer-ences in other psychosocial variables (disability level, fatigue, tension and mental confusion).
It was expected that LG volunteers would perform 6MWT with poorer results as compared to CG, even because the for-mer had high kinesiophobia scores. Some authors suggest that the fear of feeling pain is signiicantly related to poor func-tional performance of chronic low back pain individuals10.
Another important observation of this study was that, in ad-dition to high kinesiophobia scores, LG had disability levels signiicantly higher as compared to CG.
A possible explanation for the lack of diference in 6MWT performance between groups is given by Lee et al.11, who
have reported that chronic low back pain individuals tend to walk slower, however, when stimulated, as it is the case with 6MWT, they are able to walk as fast as their pain-free peers. Although tests to measure low back pain impact on the per-formance and life of people are important guides for the clini-cal approach, such tests not always relect the multiplicity of inluencing factors afecting pain. Disability level in our study was measured by a self-reported assessment tool. Wand et al.12
state that, in spite of self-reported disability and functional capacity measurements based on performance tests being moderately related, they are inluenced by diferent patient characteristics. Self-reported measurements are more inlu-enced by psychological conditions than those based on per-formance.
When mood and chronic low back pain factors were ana-lyzed, LG participants had more depression, anger, fatigue, tension and mental confusion and less vigor as compared to CG, although only tension, fatigue and mental confusion had statistically signiicant values. With this, one may infer that symptoms related to chronic low back pain are related to poorer mental health of LG participants, while CG was closer to a positive mental health model. For Sardá Jr., Kupek and Cruz13, symptoms related to low back pain and to
lumbosci-atic pain have linear correlation with patients’ psychological changes.
Fatigue, one statistically signiicant sub-item, represents a state of exhaustion, apathy and low level of energy, and may induce attention, concentration, sleep and memory disorders, in addition to irritability. his afects the process of beginning of psychosomatic, physiological and psychic problems14.
Both tension and mental confusion were signiicantly higher for LG indicating mood states impairment. It is suggested that chronic low back pain patients have discrepancies among their current condition (as they are at that moment), their ideal condition (how they would like to be), their necessary condition (the one they believe they are forced to be) and their feared condition (the one they are afraid to be).
So, self-discrepancies are understood as diferences between
the way someone sees himself and how he would like to see himself. hese self-discrepancies have been shown to be as-sociated to high levels of depression, anxiety, stress and pain. However, it is believed that each type of self-discrepancy is associated to diferent physical and behavioral characteristics. Self-discrepancy with regard to feared condition seems to be the most important to determine mood state15. Nevertheless,
our study has not investigated self-discrepancy characteristics of the sample.
In evaluating sub-item depression, this study has not found a signiicant result when comparing LG and CG. his result is diferent from other studies13,15, which have obtained a
re-lationship between chronic low back pain and depression. A possible theory to explain this result is that Brunel Mood Scale might not identify depression per se, but rather a de-pressive mood state. It is possible that increasing the frequen-cy of data collection could be a strategy to make the tool sen-sitive to capture depressive mood state oscillations in a more consistent way.
his study was limited because pain duration was not con-trolled in the statistical analysis since, as observed from stan-dard-deviation, there has been a high amplitude between the volunteer with the shortest pain duration and the volunteer with the longest pain duration. he primary contribution of this study, which comes only to reinforce what is recom-mended by other investigators, is that, in the clinical practice, it is necessary a biopsychosocial approach for the treatment of chronic low back pain patients since they present not only physical health, but also mental health weakness, showing that mind and body are inextricably interlinked.
CONCLUSION
Chronic low back pain patients participating in this study were no diferent from their pain-free peers, in the 6MWT performance, in depression, anger and vigor mood states. However, they had higher levels of disability and poorer fa-tigue, tension and mental confusion states indices.
REFERENCES
1. Huijnen IP, Verbunt JA, Roelofs J, et al. The disabling role of fluctua-tions in physical activity in patients with chronic low back pain. Eur J Pain. 2009;13(1):1076-9.
2. Lin CW, McAuley JH, Macedo L, et al. Relationship between physical activi-ty and disabiliactivi-ty in low back pain: A systematic review and meta-analysis. Pain. 2011;152(3):607-13.
3. Siqueira FB, Teixeira-Salmela LF, Magalhães LC. Análise das propriedades psico-métricas da versão brasileira da Escala de Tampa de Cinesiofobia. Acta Ortop Bras. 2007;15(1):19-24.
4. Brandt R, Viana MS, Segato L, et al. Estados de humor de velejadores durante o Pré-Panamericano. Motriz. 2010;16(4):834-40.
5. Chou R, Qaseem A, Snow V, et al. Diagnosis and treatment of low back pain: a joint clinical practice guideline from the American College of Physicians and the American Pain Society. Ann Intern Med. 2007;147(7):478-91.
6. Vigatto R, Alexandre NMC, Correa Filho HR. Development of a Brazilian portu-guese version of the Oswestry Disability Index. Spine. 2007;32(4):481-6. 7. Hohlfs ICPM, Terry PL, Rotta IM, et al. Development and initial validation of
the Brazil Mood Scale. In: 43rd Australian Psychological Society Annual Confe-rence, (Hobart, Tasmania). 2008:23-7.
9. Enright PL, Sherril DL. Reference equations for the six-minute walk in healthy adults. Am J Respir Crit Care Med. 1998;158(5 Pt 1):1384-7.
10. Reneman MF, Schiphorts Preuper HR, et al. Are pain intensity and pain related fear related to functional capacity evaluation performances of patients with chro-nic low back pain? J Occup Rehabil. 2007;17(2):247-58.
11. Lee CE, Simmonds MJ, Etnyre BR, et al. Inluence of pain distribution on gait characteristics in patients with low back pain Part 1: Vertical Ground Reaction Force. Spine. 2007;32(12):1329-36.
12. Wand BM, Chifelle LA, O’Connell NE, et al. Self-reported assessment of
disa-bility and performance-based assessment of disadisa-bility are inluenced by diferent patient characteristic in acute low back pain. Eur Spine J. 2010;19(4):633-40. 13. Sardá J Jr J, Kupek E, Cruz RM. Aspectos psicológicos associados lombalgia e à
lombociática. R Ci Hum. 2000;18(28):51-60.
14. Lane AM, Terry PC. he nature of mood: development of a theoretical model. J Appl Sport Psychol. 2000;12(1):16-33.