Heriyanti1, Yulia Panggabean2, Enggar Tyas Pangestu3,
Rayandra Asyhar4, Sutrisno5 (Received: September 26, 2019; accepted: November 25, 2019)
ABSTRACT: The roasting process has brought about some changes in transition phases, in chemical characteristics, and
microstructures of minerals in the Liberica coffee beans. Two initial roasting temperature variations were carried out to study the thermal behavior and characteristic of Liberica coffee, namely 200 °C and 230 °C. The thermal behaviour of phase changes of the Liberica green and ground coffee after the roasting process has been identified by using Differential Scanning Calorimeter (DSC). Chemical functional groups and molecular structures have been well-analyzed by using Fourier-Transform Infrared Spectroscopy (FTIR), Liquid Chromatography-Mass Spectrometry (LC-MS), Scanning Electron Microscope with Energy Dispersive X-Ray Spectroscopy (SEM/EDX) and X-Ray Powder Diffractions (XRD) for the green and roasted Liberica coffee. The DSC spectra indicated a high decomposition process that occurred during thermal treatment with crystallization and melting temperature around 120 °C and 325 °C for both roasting initial temperature variations, respectively. The FTIR and LC-MS are able to identify the chemical change in both the green and the roasted coffee. The dominant compounds found in the roasted Liberica coffee are caffeine, trigonelline, nicotinic acid, and dehydrocafestol. The XRD spectrum indicates that there is an amorphous phase for the green coffee and a sucrose crystal phase for the roasted coffee within the activity in 2θ = 20.3° and 21.1°.
Index terms: Coffea liberica Hiern, differential scanning calorimetry, roasting process, spectroscopy, X-Ray diffraction. 1 INTRODUCTION
Coffee is one of the most popular and widely consumed beverages, and it has significant commercial value, occupying the second most important commodity in the world, after oil (DAVIS et al., 2007; PATUI et al., 2014; PATAY et al., 2016). Compared to Coffea arabica L. (Arabica coffee) and Coffea canephora Pierre ex A. Froehner (Robusta coffee), Coffea liberica Hiern (Liberian coffee) provides only 2 % of the total coffee production of the world. Despite
C.liberica has lower commercial value, the
extracts of C. liberica have higher antioxidative capacity compared to those of C. arabica and
C. canephora (SAW et al., 2015).
There are more than 800 volatile compounds that affected the aroma of the roasted coffee (YANG, 2016), the phenolic composition of coffee-producing the aroma, flavour and colour characteristic of the coffee (FARAH; DONANGELO, 2006) as well as the bitterness is known to have a pharmacological effect. The complex system during the roasting process of the coffee bean has been investigated. The reaction that occurs during the roasting process is still not well-understood.
Interest in thermal behaviour and identification chemical change of coffee bean in roasting process for characterization of chemical
1,2,3,4,5University of Jambi - Department of Chemistry - Faculty of Science and Technology - Jl. Raya Jambi, Muara Bulian 15 Mendalo Indah - Jambi 3361 -Indonesia - [email protected], [email protected], [email protected], [email protected], [email protected]
for Arabica and Robusta coffee beans are well characterized (DAVIS et al., 2007; PATUI et al., 2014; EDZUAN, 2015), but there is very limited information for Liberica coffee beans. Meanwhile, the potential of the active site in then of application both green coffee beans and the roasted bean is very important for searching for the active site for pharmaceutical application. The roasting process causes improve profile thermal behavior, characterization thermal behavior by Differential Scanning Calorimeter (DSC) and spectroscopic method to drive of reactions lead to Maillard reactions and formation of melanoidins (MRP-Ms), that has been already studied in roasted coffee beans (FARAH; DONANGELO, 2006). The DSC spectra of the green coffee experiments show a high and fast decomposition after 200 °C until 289 °C with a remarkable transformation in a close range around 210 °C (RIVERA et al., 2011). The roasting process also causes a very significant increase of a crystalline phas
e of the caffeine
with activity at 2θ equal to 20.4° when the
coffee is roasted.
In this paper, the focus is on the characterization of green beans and roasted Liberica coffee beans with spectroscopic methods and DSC related to thermal behaviour were the roasted Robusta and Arabica coffee beans are well characterized. There has been also considerable interest in the Liberica coffee bean
The roasted coffee was also characterized by using SEM/EDX for microstructure analysis with the electron optical magnification range 80× to 130 000×, a resolution higher than 10 nm, Acceleration voltages about 5 Kv to 15 Kv. The PhenomproX with Energy Dispersive X-ray Spectroscopy (EDX) detector.
The roasted Liberica coffee powder in 500 g was macerated with 150 mL of 96 % ethanol for 24 h and then separated. The coffee grounds were macerated again four times over 4 d. The obtained filtrate was evaporated using a rotary evaporator at a temperature of 70 °C until a coffee extract was obtained. The coffee extract (5 μL) was analysed by using LC-MS Waters Quarto Micro Triple quadrupole with a retention time of 45 min and analysis of a mass range of 50 m/z to 1 200 m/z. The analysis condition: column temperature: 40 °C, sample temperature: 20 °C; pressure range: 0 bar to 300 bar, flow rate: 0.2 mL min–1.
To study the thermal behaviour, DSC type Perkin Elmer DSC 4000 was used. The thermal treatment was conducted with the following experimental conditions: atmosphere. Air; flow rate: 10 mL min–1; sample size: 10 mg; heating
rate: 10 °C min–1, and temperature range: 0 °C to
400 °C.
3 RESULT AND DISCUSSION Roasting process
The roasting process is an important step to produce the aroma, taste, and colour of good quality of coffee beans. The heat transfer and temperature profile in the thermal process are the most important processing parameters in influencing the physical and chemical properties of roasting coffee beans. The profile of Liberica coffee roasting is consistent with Arabica and Robusta coffee as reported in the previous article (PERDANA et al., 2018). At the beginning of the roasting process, there is a decreasing temperature for all types of coffee. The decrease in the roasting temperature is caused by the process of heat transfer from heat sources to coffee beans that occurred in the beginning roasting process associated with the drying process and is characterized by a decrease in the mass of coffee (EDZUAN et al., 2015). The mass of coffee beans decreased by 20 % from its initial mass due to an endothermic process of melting (RIVERA et al., 2011), dehydration, thermal degradation of carbohydrates, and the pyrolytic reaction of minor compound (BRONDI et al., 2017). After the 15 min, the coffee beans of spectroscopic analysis with FTIR for fractional
group of chemical (BALLESTEROS et al., 2014), decomposition material by using X–ray powder diffractions (XRD) (RIVERA et al., 2011) and the type of elements with Scanning Electron Microscope (SEM), chemicals identification by LC–MS. There have been limited investigations of Liberica coffee beans, although knowledge of its thermal changes and chemical characterizations of Liberica coffee beans may be of importance to compare the characteristic of varied coffee beans. Besides, Liberica has a unique flavour profile compared to the other two types of coffee. The taste of coffee begins with bitter walnuts, followed by the sweet, chocolate, banana, and ripe flavour with a little touch of floral and spices. Aftertaste Liberica is long-lasting and maintains a smooth dark chocolate flavour with sweet hints.
2 MATERIALS AND METHODS Materials
The Liberica coffee beans used were obtained from Tanjung Jabung Barat region, Jambi Province, Indonesia. This coffee lives at an altitude of higher than 700 m above sea level with a temperature of 27 °C to 30 °C. Ethanol 96 % was obtained from Merck, the solutions were prepared with deionized distilled water.
Procedure
The preparation of roasting and extracting coffee Liberica followed the procedure reported in the previous article (PERDANA, et al., 2018). The green coffee in 1 kg with a moisture content of around 12 % was roasted at initial temperature of 200 °C and 230 °C for 21 min (RIVERA et al., 2011) using a Fike 500i drum roaster 2016 made in Indonesia and heating gas propane. The roasted coffee then was ground to become powder.
The roasted coffee powder in ± 1 mg was mixed with KBr powder, crushed in a lumping agate until well blended and smooth, analysed with Perkin Elmer Frontier FTIR Spectrometer with DTGS and MCT detectors at a wavelength range of 400 cm–1 to 4 000 cm–1.
To determine the crystal structure, the roasted coffee powder was sieved 100 mesh and analysed using XRD PAnalytical Xpert3 powder goniometer PW 3050/60 type of Bragg-Brentano. The calculation of the diffraction pattern was done by using a database Crystallography Open Database (COD) on HighScorePlus (HSP) analysis software.
experience a change in colour from green to yellow due to a Millard reaction, enzymatic changes, and caramelization reaction. Roasting due to the non-enzymatic browning and pyrolysis reaction, also a substantial change in the bean colour takes place (ALESSANDRINI et al., 2008). The roasting process ended with a change in colour to dark brown and coffee beans become oily (after 21 min at 210 °C). This occurred due to cellulose rupture in the cell wall of coffee beans. Cellulose rupture occurs due to the build-up of CO2 gas, which was the gas pressure is much stronger than cellulose walls.
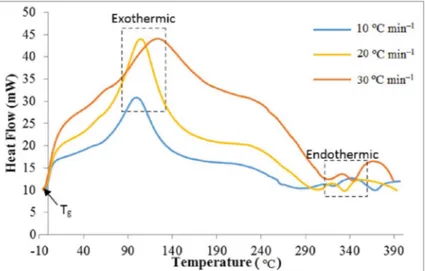
Differential Scanning Calorimetry (DSC) Figure 1 shows the DSC curve of Liberica coffee on roasting 200 ºC in various heating rate. The function of heat flow on the DSC is to control the precise temperature heating rate in a sample to obtain accurate enthalpy measurement and correct isothermal performance (ELMER, 2014). In the previous study, DSC analysis with a heating rate of 30 °C min–1 on green and roasted of Liberica,
Arabica and Robusta coffee beans has been reported (PERDANA et al., 2018). In general, the profile of the curve obtained was similar to the analysis of Liberica coffee DSC with variations in the rate of heating. The different of heating rate in thermal process showed that the different process of decomposition and melting process occur. The shape and size of peaks are bigger as the heating rate increase (FIGURE 1).
The exothermic process represents the transition change from a solid amorphous to a solid crystal and it is known as the crystallization temperature (Tc). The higher the heating rate
causes the exothermic peak on the DSC curve to be higher. This indicates more mass loss due to evaporation that occurs during the roasting process. The appearance peaks in the exothermic process in coffee indicated as a mass loss (about 20 % from initial mass) due to the breaking bonds and a released of some volatile compounds and indicating the occurrence of thermal decomposition processes in coffee (BALLESTEROS et al., 2014; BRONDI et al., 2017).
The endothermic process is a melting process when the sample reaches the melting point and is known as melting temperature (Tm). The emergence of endothermic peaks in coffee is associated with impurities and the evaporation of water in the sample (indicating the presence of hydrophilic groups) (BALLESTEROS et al., 2014). The melting temperature indicates that the melting of some constituents of coffee such as amino acids, lipids and sugars such as sucrose, glucose, fructose, arabinose, galactose, maltose and polysaccharides (BRONDI et al., 2017).
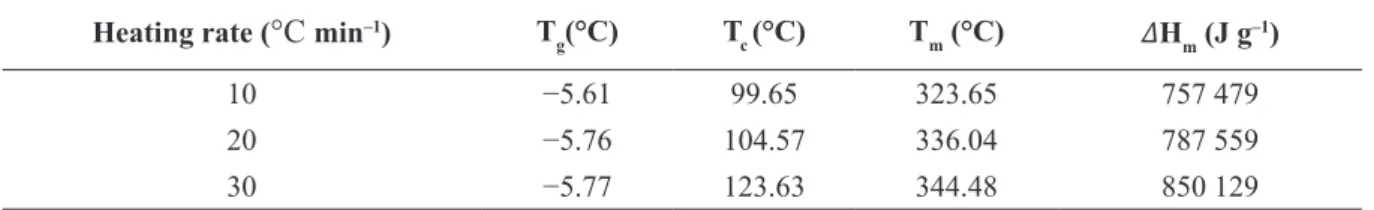
Table 1 presents the thermal parameters of measurements using DSC.
From Table 1, the enthalpy of melting increased with higher heating rate. At low heating rates, melting occurs at low temperatures. The temperature of the melting increases with an increase in the rate of heating on DSC analysis of sucrose (HURTTA et al., 2004; LEE et al., 2011). This happens because of the loss of the crystalline structure of the solid caused by the kinetic process of thermal decomposition (called apparent melting), rather than thermodynamic melting (LEE et al., 2011). The highest value of ∆H is 850 129 J g–1 at a heating rate of 30 °C min–1.
TABLE 1- DSC analysis of Liberica coffee at various heating rates ( °C min–1).
Heating rate (°C min–1) T
g(°C) Tc (°C) Tm (°C) 𝛥Hm (J g–1)
10 −5.61 99.65 323.65 757 479
20 −5.76 104.57 336.04 787 559
30 −5.77 123.63 344.48 850 129
Fourier-Transform Infrared Spectroscopy (FTIR)
Analysis using FTIR for green, roasted Liberica at 200 °C and 230 °C Liberica coffee bean has been carried out. Carbohydrates showed in an extensive feature in areas between 900 cm–1 to 1 200 cm–1 as a result of the vibration
of C-O stretching on C-O-H bonds such as glycosidic bonds and related to polysaccharide sugars. The carbonyl bond (C = O) appears at 1 735 cm–1 and 1 733 cm–1. However, it did not
appear in green Liberica coffee. The carbonyl bonds appearing on roasting coffee come from the coffee oil produced during roasting (REIS et al., 2013). The presence of C = O for roasted coffee was also due to the formation of new compounds such as dehydrocafestol and dehydrokahweol which are also lipid derivatives (REIS et al., 2013).
Besides carbohydrates, the non-volatile compounds detected from FTIR analysis were caffeine, chlorogenic acid, trigonelline, nicotinic acid, and caffeic acid. The characteristic of caffeine was the band about 1 600 cm–1 (BALLESTEROS et
al., 2014). The band of C-N functional groups are 1 641 cm–1, 1 640 cm–1, and 1 642 cm–1.
Chlorogenic acid is the main phenol compound found in coffee. Chlorogenic acid was indicated by functional groups of O-H, C = O and C-C. They were appeared at 3 000 cm–1, 1 700 cm–1, and
1 200 cm-1, respectively. The presence of
trigonelline compounds is explained by the bond of C-N, C = O, and O-H at 1 400 cm–1, 1 700
cm–1, and 3 000 cm–1, respectively. The nicotinic
acid and caffeic acid compounds are derivatives of carboxylic acids. A characteristic feature of carboxylic acids in the presence of a carboxyl functional group (-COOH), carboxyl taken from carbonyl (C=O) and hydroxyl (-OH). Carbonyl appears about 1 700 cm–1, while hydroxyl about
3000 cm–1 (BALLESTEROS et al., 2014). X-ray Powder Diffraction (XRD)
The XRD analysis was carried out for evaluating the crystallinity of the Liberica
coffee powder. Based on previous article, the green Liberica coffee showed an amorphous structure whereas roasted Liberica coffee denotes a crystalline structure indicated by a peak of 2θ equal to 20.3° for roasted 200 °C and 2θ equal to 21.1° for roasted 230 °C as assignee of the crystal peak of sucrose (PERDANA et al., 2018). The results are consistent with the earlier report for green coffee, roasted at 200 °C, and 300 °C for Arabica and Robusta (PERDANA et al., 2018). The phase change from amorphous to crystalline is due to the roasting process. Thermal treatment of coffee causes incorporated water molecules into its crystal structure (RIVERA et al., 2011; PERDANA et al., 2018). The crystalline regions of cellulose are resistant to attack from various chemical compounds due to strong hydrogen interactions between micron fibres. In contrast, hemicellulose and other constituents of the amorphous structure are more easily degraded and susceptible to chemical attack. Coffee beans with thermal treatment will be in part of crystalline because in the process of roasting the removal of water molecules is inserted into the crystal fraction and convert some α-polymorphic phase structures into β-crystals (RIVERA et al., 2011; BALLESTEROS et al., 2014).
Scanning Electron Microscope/Energy Dispersive X-ray Spectroscopy (SEM/EDX)
The SEM-EDX analysis in Figure 2, of the roasted coffee at 230 °C has a larger expansion of cell volume compared to the roasted at 200 °C. Coffee that undergoes the thermal process in roasting will produce micrographs with the expansion of the pores and the reduced wall thickness in the pores. The higher the roasting temperature results in a much higher expansion rate (SCHENKER et al., 2000). The roasted coffee at 230 °C showed a smoother surface and bigger pores than the roasted at 200 °C. The roasted coffee beans have a smoother surface due to the process of melting sugar during the roasting process (CHAN; GARCIA, 2011).
The use of high temperatures in the roasting process also causes an increase in polysaccharide degradation so that micropore expansion occurs on the cell wall (SCHENKER et al., 2000). Besides, the formation of carbon dioxide and increased internal pressure caused the pores to stick to one another. Furthermore, carbon dioxide (CO2) formed by the roasting process will cause the rupture of the pore wall (SCHENKER et al., 2000).
From EDX, the dominant elements are elements of C, O, and K with several minerals, including Na, Mg, K, Ca, Fe, Zn and Cu. The percentages of the dominant elements are 52.8 7 %, 45.42 % and 1.71 % for roasted coffee at 200 °C and 53.63 %, 44.70 %, and 1.66 % for roasted coffee at 230 °C, respectively. The results of SEM analysis of unroasted and roasted Robusta coffee showed that the main elements are C and O with a percentage of 43.24 % and 44.77 % for unroasted coffee and 58.90 % and 30.72 % for roasted coffee, respectively (CHAN, GARCIA, 2011). The five main minerals are found in roasted Robusta coffee are Br, Cu, K, Zn, and Na (REIS et al., 2013; CHAN, GARCIA, 2011). Minerals content in coffee is chemically related to the main constituents of coffee beans.
Liquid Chromatography-Mass Spectrometry (LC–MS)
The spectra in Figure 3 and the data m/z is tabulated in Table 2. Caffeine (C8H10N4O2) appears on the m/z fragments of 181.03 and 195.07 in green Liberica coffee. For roasted Liberica 200 °C was on the m/z 138.16, 151.82 and 195.01. While the roasted Liberica coffee 230 °C appears on the fragments of ions m/z 151.12 and 195.13. Caffeine
FIGURE 2 - The SEM-EDX Analysis of roasted Liberica coffee (a) roasted at 200 °C (b) 230 °C.
was identified in m/z 195 of the [M+H]+ with
fragment ion m/z 181.2, 151.2, and 138 (HEIGL et al., 2006; HUCK et al., 2005). Caffeine does not significantly change during roasting but can be slightly reduced due to sublimation.
Chlorogenic acid or CGA (C16H18NO9) was only detected in green Liberica coffee. During roasting, CGA decomposed into caffeine and cyanic acid. Chlorogenic acid is present in the form of 3-O-p-coumaroylquinic (3-pCoQA). The 3-pCoQA has a molecular formula C16H18O8 with a molecular weight of 338.312 gmol–1. Ion
fragments occur at m/z 163.08 and 337.29. The 3-pCoQA appears in the ion fragments of m/z 337.7 and 163.5 (CLIFFORD et al., 2003).
Trigonelline (C7H7NO2) with the molecular weight of 137.138 gmol–1. During roasting,
trigonelline will be degraded to produce nicotinic acid compounds. Both compounds are heat sensitive (DIAS, BENASSI, 2015). At roasting temperatures of 220 °C to 250 °C trigonelline will break down into two paths: (1) Decarboxylation and methyl rearrangement to form “pyridine” (2) N-demethylation to form nicotinic acid (DIAS; BENASSI, 2015).
Dehydrocafestol (diterpene) is a decomposition product of cafestol compounds formed during roasting. The compound is found only in the roasted Liberica 230 ºC and undetectable in both green and roasted 200 ºC. Glucose/fructose was detected in green Liberica coffee with m/z 180.91. The Maillard reaction that occurs during roasting causes the measurement of fructose/glucose because it reacts with amino acids to form volatile compounds and melanoidin complexes. This causes glucose/fructose not to be found in roasting coffee.
FIGURE 3 - The LC-MS Spectra of Liberica coffee (a) Green (b) Roasted at 200 °C and (c) Roasted at 230 °C. TABLE 2 - LC-MS data of Liberica coffee.
Compound m/z
Green Roasted 200 °C Roasted 230 °C
Caffein 195.07 195.01 195.13
3-p-coumaroylquinic (chlorogenate acid) 337.29 -
-Trigonelline - 138.23 138.23
Nicotinic acid - 124.25 124.06
Caffeic acid 181.03 -
-Dehydrocafestol - - 299.10
Glucose/fructose 180.91 -
-Consistent with the results of the experiments that have been conducted, analysis of Arabica coffee using direct-infusion electrospray ionization (ESI) + Fourier transform ion cyclotron resonance mass spectrometry (FT-ICR) MS identifies trigonelline, caffeine, and sucrose, while Robusta coffee contains trigonelline, caffeine, sucrose (GARRET et al., 2012). Another study using ultra-performance liquid chromatography coupled with quadrupole time-of-flight mass spectrometry (UPLC-Q-TOF/MS) reported that SCG contains caffeine and trigonelline (DRISCOLL, 2014). However, there is no literature found associated with LCMS analyzes for coffee Liberica.
4 CONCLUSION
The higher heating rate cause higher decomposition of roasted Liberica coffee indicated from higher of exothermic peak and enthalpy of melting. The thermal treatment causes a major impact on the structural product properties of Liberica coffee beans, where the higher roasting temperature exhibit greater bean volume, cumulative pore volume, and larger microspores in the cell walls. The XRD analysis showed that the green Liberica coffee has amorphous phase, while the roasted has a crystalline phase of the sucrose with activity in 2θ equal to 20.3° for roasted 200 °C and 2θ equal to 21.1° for roasted 230 °C. The green Liberica coffee contains caffeine, chlorogenic
acid, caffeic acid, and sucrose. After roasted, Liberica coffee contains caffeine, trigonelline, nicotinic acid, and dehydrocafestol as dominant compounds. Further research related to the effect of roasting on the thermal properties of Liberica coffee and comparative studies with other types of coffee is needed related to coffee quality.
5
ACKNOWLEDGMENTS
Financial support from the Lembaga
Penelitian dan Pengabdian Masyarakat, Universitas Jambi (Research and Community
Service Institute, University of Jambi), with the contract number is No: 52/UN21.17/PP/2017 date 25 April 2017. DIPA PNBP Faculty of Science and Technology University of Jambi Tahun Anggaran 2017 Nomor: SP DIPA-042.01.2.400950/2017 date 07 December 2016, is greatly acknowledged. The acquisition of the Scanning Electron Microscope (SEM) and X-Ray Diffraction were made possible by the support of the Faculty of Science and Technology, University of Jambi, Research Infrastructure Equipment Facility grant.
6
REFERENCES
ALESSANDRINI, L.; ROMANI, S.; PINNAVAIA, G.; ROSA, M. D. Near infrared spectroscopy: An analytical tool to predict coffee roasting degree. Analytica Chimica Acta, Netherlands, v. 625, n. 1, p. 95–102, 2008.
ARYA, M.; RAO, L. J. M. An impression of coffee carbohydrates an impression of coffee. Critical Reviews in Food Science and Nutrition, UK, v. 47, n. 1, p. 51–67, 2010.
BALLESTEROS, L. F.; SILVERSKIN, C.; TEIXEIRA, J. A.; MUSSATTO, S. I. Chemical, functional, and structural properties of spent coffee grounds and coffee silverskin chemical, functional, and structural properties of spent coffee. Food Bioprocess Technol, US, v. 7, n. 12, p. 3493–3503, 2014.
BRONDI, A. M.; TORRES, C.; GARCIA, J. S.; TREVISAN, M. G. Differential scanning calorimetry and infrared spectroscopy combined with chemometric analysis to the determination of coffee adulteration by corn. Journal of the Brazilian Chemical Society, Brazil, v. 28, n. 7, p. 1308–1314, 2017.
CHAN, S.; GARCIA, E. Comparative physicochemical analyses of regular and civet coffee. Manila Journal of Science, Philippines, v. 1, n. 7, p. 19–23, 2011.
CLIFFORD, M.; JOHNSTON, K.; KNIGHT, S.; N. KUHNERT. Hierarchical scheme for LC–MSn identification of chlorogenic acids. Journal of Agricultural and Food Chemistry, US, v. 51, n. 1, p. 2900–2911, 2003.
DAVIS, A.; CHESTER, M.; MAURIN, O.; FAY, M. Searching for the relatives of coffea (Rubiaceae, Ixoroideae): The circumscription and phylogeny of coffeeae based on plastid sequence data and morphology. American Journal of Botany, US, v. 94, n. 3, p. 313–329, 2007.
DIAS, R. C. E.; BENASSI, M. D. T. Discrimination between arabica and robusta coffees using hydrosoluble compounds: Is the efficiency of the parameters dependent on the roast degree? Beverages, Switzerland, v. 1, n. 3, p. 127–139, 2015.
EDZUAN, A. M. F.; ALIAH, A. M. N.; BONG, H. L. Physical and Chemical property changes of coffee beans during roasting. American Journal of Chemistry, USA, v. 5, n. 3A, p. 56–60, 2015.
ELMER, P. Guide to selection of differential scanning calorimetry (DSC). USA: PerkinElmer Inc, 2014. p. 1–6.
FARAH, A.; DONANGELO, C. M. Phenolic compounds in coffee, Braz. Brazilian Journal of Plant Physiology, Brazil, v. 18, n. 1, p. 23–36, 2006. GARRETT, R; VAZ, B. G.; HOVELL, A. M. C; EBERLIN, M. N; REZENDE, C. M. Arabica and Robusta Coffees: Identification of Major Polar Compounds and Quantification of Blends by Direct-Infusion Electrospray Ionization − Mass Spectrometry. Journal of Agricultural and Food Chemistry, v. 60, p. 4253-4258, 2012.
HEIGL, N.; HUCK, C. W.; RAINER, M.; BONN, G. K. Near infrared spectroscopy , cluster and multivariate analysis hyphenated to thin layer chromatography for the analysis of amino acids. Amino Acids, Austria, v. 31, n. 1, p. 45–53, 2006.
HUCK, C. W; GUGGENBICHLER, W; BONN, G. K. Analysis of caffeine, theobromine and theophylline in coffee by near infrared spectroscopy (NIRS) compared to high-performance liquid chromatography (HPLC) coupled to mass spectrometry. Analytica Chimica Acta, v. 538, p. 195–203, 2005.
HURTTA, M.; PITKA, I.; KNUUTINEN, J. Melting behaviour of D-sucrose, D-glucose and D-fructose. Carbohydrate Research, UK, v. 339, p. 2267–2273, 2004. LEE, J. W.; AVENUE, S. G; STATES, U; THOMAS, L. C; SCHMIDT, S. J. Effects of heating conditions on the glass transition parameters of amorphous sucrose produced by melt-quenching. Journal of Agricultural and Food Chemistry, v. 59, p. 3311–3319, 2011. PATUI, S.; LUISA, C.; CARLO, P.; MARCO, Z.; LANFRANCO, C.; LORENZO, D. T.; LUCIANO, N.; ANGELO, V.; ENRICO, B. Lipase activity and antiocidant capacity in coffee (Coffee arabica) seeds during germination. Plant Science, Netherlands, v. 219–220, p. 19–25, 2014.
PATAY, É. B.; NIKOLETT, S.; TAMAS, K.; RITA, C.; VIKTORIA, L. B.; TIBOR, S. N.; TIBOR, N.; NORA, P. Antioxidant potential, tannin and polyphenol contents of seed and pericarp of three Coffea species. Asian Pacific Journal of Tropical Medicine, India, v. 9, n. 4, p. 366–371, 2016.
PERDANA, B.M.; MANIHURUK, R; ASHYAR, R; HERIYANTI; SUTRISNO. Evaluation of the effect of roasting process on the energy transition and the crystalline structures of Arabica, Robusta, and Liberica coffee from Jambi Indonesia. IOP Conference Series: Materials Science and Engineering, v. 345, 2018.
REIS, N.; FRANCA, A. S.; OLIVEIRA, L. S. Discrimination between roasted coffee, roasted corn and coffee husks by diffuse reflectance infrared fourier transform Spectroscopy. LWT–Food Science and Technology, US, v. 50, n. 2, p. 715–722, 2013.
RIVERA, W.; VELASCO, X.; GÁLVEZ, C.; RINCÓN, C.; ARANGO, P. Effect of the roasting process on glass transition and phase transition of Colombian Arabic coffee beans. Procedia Food Science, UK, v. 1, p. 385–390, 2011.
SAW, AK-C.; YAM, W.; WONG, K-C.; LAI, C-S. A comparative study of the volatile constituents of southeast asian coffea arabica, coffea liberica and coffea robusta green beans and their antioxidant activities. Journal of Essential Oil Bearing Plants, UK, v. 18, no. 1, p. 64–73, 2015.
SCHENKER, S.; HANDSHIN, S.; FREY, B.; Perren R.; ESCHER, F. pore structure of coffee beans affected by roasting conditions. Food Engineering and Physical Properties, UK, v. 65, no. 3, p. 452-457, 2000. YANG, N; LIU, C; LIU, X; DEGN, T. K; MUNCHOW, M; FISK, I. Determination of volatile marker compounds of common coffee roast defects. Food Chemistry, UK, v. 211, p. 206–214, 2016.