COMPARISON OF THE ACOUSTICS OF MOSQUES AND
CATHOLIC CHURCHES
António P. O. Carvalho and Cândido G. Monteiro
Laboratory of Acoustics, Faculty of Engineering, Univ. of Porto, 4200-465 Porto, Portugal e-mail: [email protected]
Catholic churches and mosques are worship places but with different occupation modes and acoustic requirements, decoration and architectural styles. This work reports on their acoustic performance to describe main similarities and differences. It is analysed the variability between objective acoustical parameters (Reverberation Time, Clarity C50 or C80 and STI or RASTI) and architectural parameters (volume, area, length, height and width). Regression models were cre-ated to find the best relationships among the parameters. A comparison between the acoustics of churches and mosques was established using data analysis to allow for a discussion relating to the comprehension of those parameters’ variability.
1. Introduction
Mosques and Catholic churches are gathering religious buildings for two of the major relig-ions in the world. They both have common points especially: believe in one true God; follow a Holy book (Coram and Bible); recognize Jesus and Mary (with different levels of holiness); have internal divisions or denominations (Sunnis/Shiites and Roman/Orthodox); and they both use specific spaces for their religious services that have similar features among themselves in each religion (shape and interior decoration) that make their acoustics very specific.
Churches began slowly appearing as a special building after the 4th century but only after the 11th century they began having specific characteristics and individuality and architectural styles (Romanesque, Gothic, Renaissance, Baroque, etc.).
The mosque (the word comes from the Arab “Masjid” meaning place of worship and prostra-tion) serves as the place where Muslims can come together for prayer as well as a centre for infor-mation and education. They began being built in the 7th century in the Arabian Peninsula following the model of Mahomet’s home in Medina.
In mosques the main acoustic objective is speech intelligibility but in Catholic churches there is also the requirement for adequateness for music (organs, choirs, congregation singing, etc.).
2. Method
The purpose of this work was to identify some of the similarities and differences on the acous-tics of mosques and Roman Catholic churches. The acoustic data (all for unoccupied spaces) and information about the churches and mosques was based on previous work and available literature1-4. The goals of this research are:
• To characterize Catholic churches and mosques regarding their main acoustical and architec-tural features.
• To compare the acoustical behaviour of Catholic churches and mosques.
The acoustic and architectural parameters used in this work are presented in Table 1. The samples of buildings used are explained and numerically characterized in Tables 2 and 3.
Table 1 – Acoustic and architectural parameters used.
Buildings Acoustic parameters Architectural features
41 Roman Catholic churches (Portugal) RT (Reverberation Time)* C80 (Clarity 80 ms)*
RASTI (Rapid Speech Transmission Index) 21 Mosques
(Saudi Arabia)
RT (Reverberation Time)* C50 (Clarity 50 ms)*
STI (Speech Transmission Index)
Volume (total) Area (total) Length (maximum) Height (maximum) Width (medium) V (m3) S (m2) L (m) H (m) W (m) * average 500/1k Hz octave bands
Table 2 – Main statistics for the architectural parameters for churches and mosques. 31 churches2,3 (RASTI) 41 churches1 (RT / C80) 21 mosques4 (RT / C50 / STI) Archit.
Param. Min. Mean Max. Min. Mean Max. Min. Mean Max. V (m3) 751 8046 30380 299 5772 18674 520 3185 23390
S (m2) 108 593 1300 56 450 1031 131 569 2704
L (m) 17.9 39.3 63.3 11.5 33.2 62.2 11.6 27.4 52.0
H (m) 5.9 16.2 35.1 6.5 14.8 39.0 3.3 4.8 8.7
W (m) 5.4 14.8 28.8 5.0 13.6 36.8 9.7 17.7 52.0
Table 3 – Number of churches and mosques per group.
Groups A B C D E F
Volume (m3) < 1000 1000-1500 1500-2000 2000-3000 3000-10000 10000-30000 Total
Churches 5 6 2 4 15 9 41
Mosques 4 5 4 4 3 1 21
3. Results
3.1 Controlling for groups
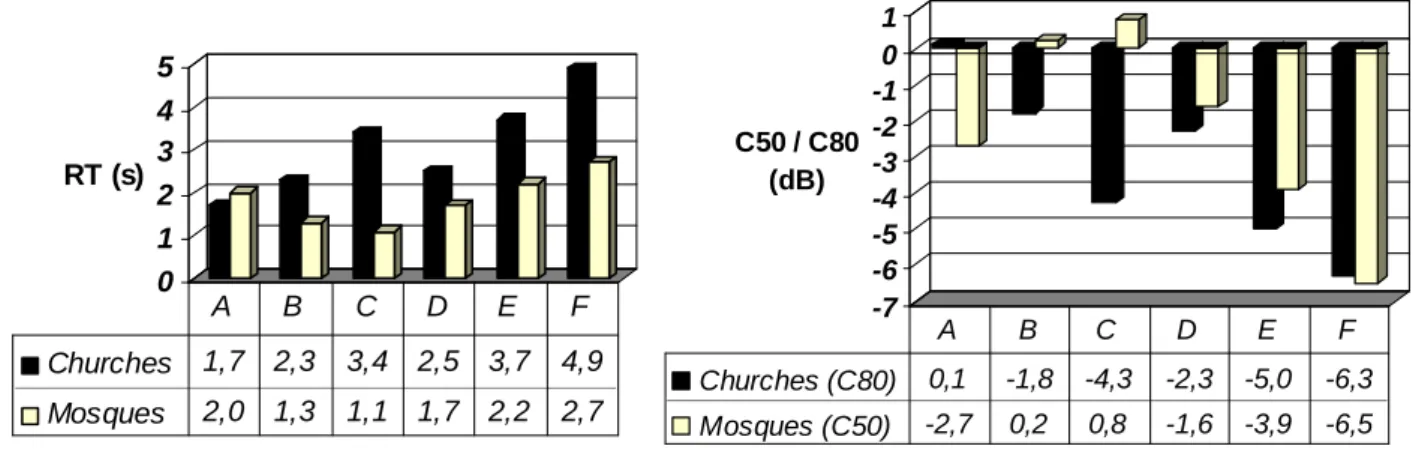
Fig. 1 presents the results of the average RT and C50/C80 (average 500/1k Hz octave bands) for each of the six groups defined on Table 3 regarding their volume.
0 1 2 3 4 5 RT (s) Churches 1,7 2,3 3,4 2,5 3,7 4,9 Mosques 2,0 1,3 1,1 1,7 2,2 2,7 A B C D E F -7 -6 -5 -4 -3 -2 -1 0 1 C50 / C80 (dB) Churches (C80) 0,1 -1,8 -4,3 -2,3 -5,0 -6,3 Mosques (C50) -2,7 0,2 0,8 -1,6 -3,9 -6,5 A B C D E F
3.2 Regression models
3.2.1 Reverberation time
Tables 4 and 5 show the equations (and R2) for the best regression models for the RT average values in each type of space regarding each of the five architectural parameters tested5.
Table 4 – Best regression models between RT and the architectural parameters (churches).
Architectural parameter Equation R2
V – Volume (m3) 0.3050 25 . 0 V RT = ⋅ 0.51 S – Area (m2) 0.3933 3074 . 0 S RT = ⋅ 0.47 L – Length (m) 0.6626 3158 . 0 L RT = ⋅ 0.35 H – Height (m) =0.00248⋅ 2+0.0745⋅ +1.6309 H H RT 0.56 W – Width (m) 0.6034 6781 . 0 W RT = ⋅ 0.41
Table 5 – Best regression models between RT and the architectural parameters (mosques).
Architectural parameter Equation R2
V – Volume (m3) =−3.01×10−9⋅ 2 +0.000127⋅ +1.38 V V RT 0.64 S – Area (m2) =3.01×10−8⋅ 2+0.000398⋅ +1.4388 S S RT 0.63 L – Length (m) RT =0.0269⋅L+0.9879 0.42 H – Height (m) RT =1.8084⋅ln(H)−1.1271 0.65 W – Width (m) =0.00015⋅ 2 +0.0205⋅ +1.2644 W W RT 0.63 3.2.2 Clarity (C50 and C80)
Tables 6 and 7 show the best regression models for the C80 and C50 average values in each type of space regarding each of the five architectural parameters tested5.
Table 6 – Best regression models between C80 and the architectural parameters (churches).
Architectural parameter Equation R2
V – Volume (m3) C80 =−1.9954⋅ln(V)+12.405 0.59 S – Area (m2) C80 =−2.5557⋅ln(S)+10.997 0.53 L – Length (m) C80 =−4.4625⋅ln(L)+11.359 0.42 H – Height (m) 0.0062 2 0.5431 2.4894 80 = ⋅H − ⋅H + C 0.49 W – Width (m) C80 =−3.8216⋅ln(W)+5.6106 0.44
Table 7 – Best regression models between C50 and the architectural parameters (mosques).
Architectural parameter Equation R2
V – Volume (m3) 1.41 10 8 2 0.000605 0.1076 50 = × ⋅ − ⋅ − − V V C 0.72 S – Area (m2) C50 =−1.15×10⁻⁷⋅S2 −0.00202⋅S−0.3397 0.71 L – Length (m) C50 =−0.1335⋅L+1.9078 0.49 H – Height (m) C50 =−8.7027⋅ln(H)+11.963 0.72 W – Width (m) 0.00059 2 0.1082 0.5747 50 =− ⋅W − ⋅W + C 0.70
3.2.3 Speech transmission index (RASTI / STI)
Mosques’ data relate to STI values but in churches only RASTI values were available. On both cases there are values with the Sound Reinforcement System (SRS) off and on. The average values in each space were related to the five architectural parameters by linear regressions (Tables 8 and 9)5.
Table 8 – Linear regressions between RASTI and the architectural parameters (churches).
SRS off SRS on
Architectural
parameter Equation R Equation R
V (m3) =−1.34×10⁻⁶⋅ +0.4264 V RASTI 0.10 RASTI =−1.23×10⁻⁶⋅V +0.4509 0.09 S (m2) =−1.82×10⁻⁵⋅ +0.4264 S RASTI 0.07 RASTI =−4.95×10⁻⁵⋅S+0.4704 0.20 H (m) RASTI =−1.32×10⁻⁴⋅H +0.4208 0.38 RASTI =−0.00137⋅H+0.4631 0.10 L (m) RASTI =−0.00529⋅L+0.5012 0.02 =−4.54×10⁻⁴⋅ +0.4588 L RASTI 0.07 W (m) RASTI =−0.00175⋅W +0.4414 0.13 RASTI =−0.00404⋅W+0.5007 0.29 Table 9 – Linear regressions between STI and the architectural parameters (mosques).
SRS off SRS on
Architectural
parameter Equation R Equation R
V (m3) STI =−9.86×10⁻⁷⋅V+0.4565 0.10 STI =−3.06×10⁻⁶⋅V+0.4951 0.30 S (m2) =−1,33×10⁻⁵⋅ +0,4609 S STI 0.16 STI =−2.44×10⁻⁵⋅S+0.4987 0.28 H (m) =−1.12×10⁻²⋅ +0.5073 H STI 0.25 STI =−1.13×10⁻²⋅H+0.5405 0.25 L (m) =−6.07×10⁻⁴⋅ +0.4700 L STI 0.14 STI =−8.50×10⁻⁴⋅L+0.5085 0.19 W (m) =−8.65×10⁻⁴⋅ +0.4686 W STI 0.17 STI =−1.22×10⁻³⋅W+0.5065 0.23
4. Analysis
4.1 Reverberation TimeFig. 1 also shows that churches have, in general, larger RT average values (about 1 to 2 s) than mosques, except in very small buildings (volume < 1000 m3).
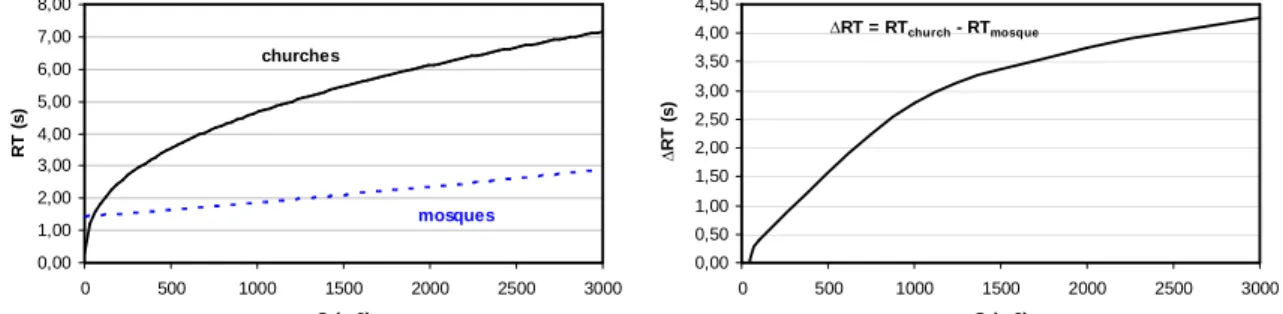
From Tables 4 and 5 and Fig. 2 to 4 (that present the best of the models described on Tables 4 and 5) it can be concluded that RT average values increase with increasing size of these architec-tural parameters. Such growth is more pronounced in churches than in mosques.
0,00 1,00 2,00 3,00 4,00 5,00 6,00 7,00 0 5000 10000 15000 20000 25000 30000 V (m3) R T ( s ) churches mosques 0,00 0,50 1,00 1,50 2,00 2,50 3,00 3,50 0 5000 10000 15000 20000 25000 30000 V (m3) ∆ R T ( s ) ∆RT = RTchurch - RTmosque
Figure 2. Difference between the behaviour for the RT values regarding Volume for churches and mosques.
0,00 1,00 2,00 3,00 4,00 5,00 6,00 7,00 8,00 0 500 1000 1500 2000 2500 3000 S (m2) R T ( s ) churches mosques 0,00 0,50 1,00 1,50 2,00 2,50 3,00 3,50 4,00 4,50 0 500 1000 1500 2000 2500 3000 S (m2) ∆ R T ( s ) ∆RT = RTchurch - RTmosque
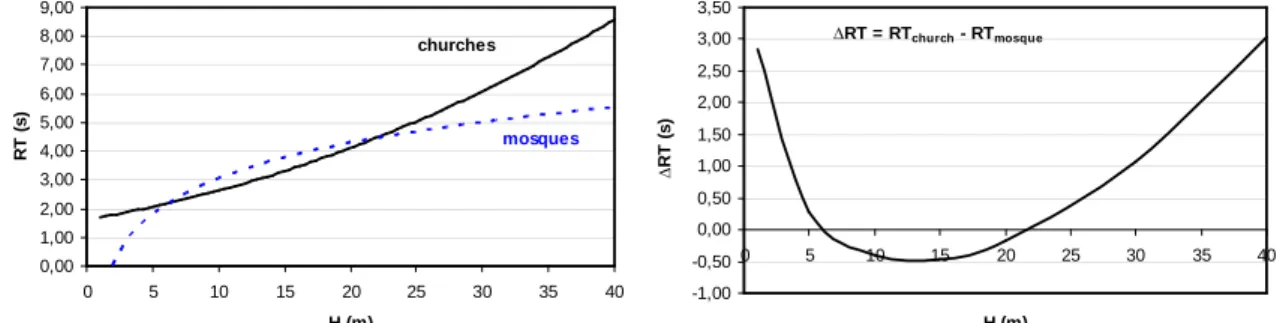
0,00 1,00 2,00 3,00 4,00 5,00 6,00 7,00 8,00 9,00 0 5 10 15 20 25 30 35 40 H (m) R T ( s ) mosques churches -1,00 -0,50 0,00 0,50 1,00 1,50 2,00 2,50 3,00 3,50 0 5 10 15 20 25 30 35 40 H (m) ∆ R T ( s ) ∆RT = RTchurch - RTmosque
Figure 4. Difference between the behaviour for the RT values regarding Height for churches and mosques. Except for the case of Height, all other geometrical characteristics show a growing difference between churches and mosques RT average values (∆RT). In the case of Height, RT values are greater in small churches than in mosques of the same size, although this tends to change until in-termediate heights, resuming in buildings with very large heights.
4.2 Clarity (C50 and C80)
The acoustic parameter Clarity was evaluated for both places, although the direct comparison between the results cannot be made because churches were measured with C80 (usually related to music perception) and mosques with C50 (used to evaluate the intelligibility of speech). The most relevant results are shown in Fig. 5 to 8 except that the difference in Clarity (∆C) is not represented because the parameters C80 and C50 are not exactly the same.
-10,00 -5,00 0,00 5,00 10,00 15,00 0 5000 10000 15000 20000 25000 30000 V (m3) C 5 0 & C 8 0 churches mosques -15,00 -10,00 -5,00 0,00 5,00 10,00 15,00 0 500 1000 1500 2000 2500 3000 S (m2) C 5 0 & C 8 0 mosques churches
Figure 5. Behaviour for the C50 / C80 values
re-garding Volume for mosques / churches.
Figure 6. Behaviour for the C50 / C80 values
re-garding Area for mosques / churches.
-25,00 -20,00 -15,00 -10,00 -5,00 0,00 5,00 10,00 15,00 0 5 10 15 20 25 30 35 40 H (m) C 5 0 & C 8 0 mosques churches -12,00 -10,00 -8,00 -6,00 -4,00 -2,00 0,00 2,00 4,00 6,00 8,00 0 10 20 30 40 50 60 70 W (m) C 5 0 & C 8 0 mosques churches
Figure 7. Behaviour for the C50 / C80 values
re-garding Height for mosques / churches.
Figure 8. Behaviour for the C50 / C80 values
re-garding Width for mosques / churches.
The comparison that can be drawn is about the evolution of this parameter with the architec-tural features or to see if in churches, music clarity is lost more quickly with the increase of the geometric dimensions than the clarity of speech in mosques with the same increase in size.
In both churches and mosques, there is a decrease of Clarity mean values with the increase of any of the architectural parameters. Clarity values vary in fairly identical ways in both buildings.
Only for Height, the Clarity of speech (C50) in mosques decreases faster than the Clarity of music (C80) in churches. For all other architectural parameters there is an opposite trend.
Fig. 5 to 8 show that, for very small churches (up to 1000 m3 and with the other architectural parameters of low value), music can be perceived with good clarity (showing positive values for this parameter). However this tends to reverse to a situation where the sound shows little sharpness. From about 1000 m3, C80 tends to negative values. For higher values, C80 is still strongly negative but almost always tends to a constant value. For mosques, it appears that C50 also varies in a similar manner (except for very small volumes and areas).
4.3 Speech transmission index (RASTI / STI)
4.3.1 Sound reinforcement system off
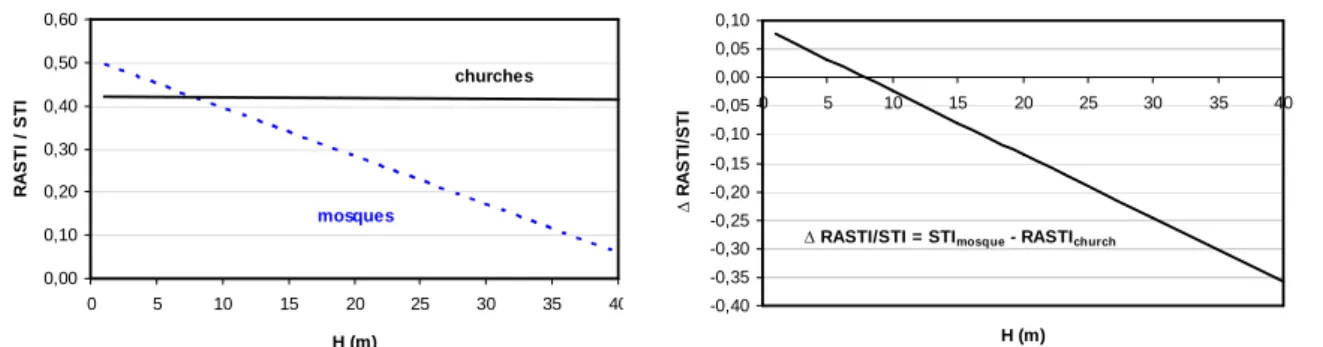
According to the results shown in Tables 8 and 9 Height is the geometric feature that, for churches and mosques, shows the higher R (0.38 and 0.25). However, all the other models presented smaller R values.
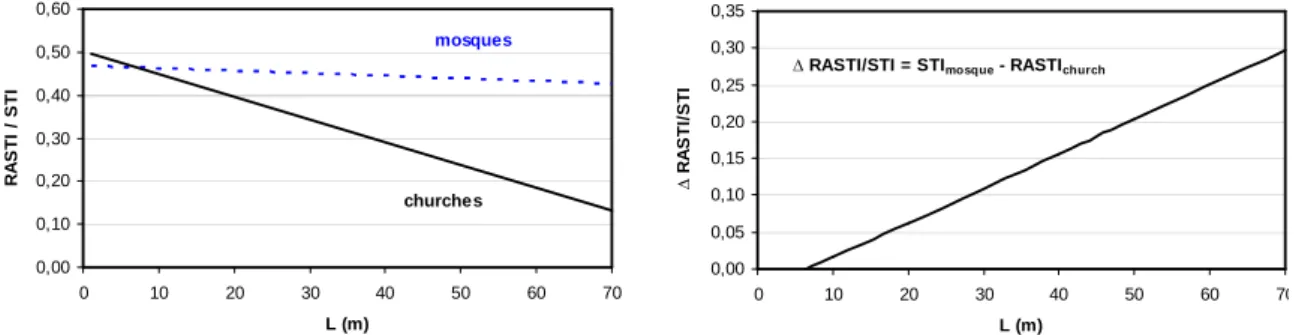
Fig. 9 to 13 have the graphic representation of some of the linear regression lines of the RASTI (churches) and STI (mosques) relationships. Although the relationships for these acoustic parameters averages are not strong, these analyses can give an approximate idea of the difference between the evolution of these parameters in both places. The nomenclature ∆RASTI/STI refers to the difference STImosques - RASTIchurches.
0,38 0,39 0,40 0,41 0,42 0,43 0,44 0,45 0,46 0,47 0 5000 10000 15000 20000 25000 30000 V (m3) R A S T I / S T I mosques churches 0,00 0,01 0,02 0,03 0,04 0,05 0 5000 10000 15000 20000 25000 30000 V (m3) ∆ R A S T I/ S T I
∆ RASTI/STI = STImosque - RASTIchurch
Figure 9. Behaviour for the RASTI / STIvalues regarding Volume for churches / mosques (SRS off).
0,37 0,38 0,39 0,40 0,41 0,42 0,43 0,44 0,45 0,46 0,47 0 500 1000 1500 2000 2500 3000 S (m2) R A S T I / S T I mosques churches 0,00 0,01 0,02 0,03 0,04 0,05 0,06 0 500 1000 1500 2000 2500 3000 S (m2) ∆ R A S T I/ S T I
∆ RASTI/STI = STImosque - RASTIchurch
Figure 10. Behaviour for the RASTI / STIvalues regarding Area for churches / mosques (SRS off).
0,00 0,10 0,20 0,30 0,40 0,50 0,60 0 5 10 15 20 25 30 35 40 H (m) R A S T I / S T I mosques churches -0,40 -0,35 -0,30 -0,25 -0,20 -0,15 -0,10 -0,05 0,00 0,05 0,10 0 5 10 15 20 25 30 35 40 H (m) ∆ R A S T I/ S T I
∆ RASTI/STI = STImosque - RASTIchurch
0,00 0,10 0,20 0,30 0,40 0,50 0,60 0 10 20 30 40 50 60 70 L (m) R A S T I / S T I churches mosques 0,00 0,05 0,10 0,15 0,20 0,25 0,30 0,35 0 10 20 30 40 50 60 70 L (m) ∆ R A S T I/ S T I
∆ RASTI/STI = STImosque - RASTIchurch
Figure 12. Behaviour for the RASTI / STIvalues regarding Length for churches / mosques (SRS off).
0,00 0,10 0,20 0,30 0,40 0,50 0 10 20 30 40 50 60 70 W (m) R A S T I / S T I mosques churches 0,00 0,01 0,02 0,03 0,04 0,05 0,06 0,07 0,08 0,09 0,10 0 10 20 30 40 50 60 70 W (m) ∆ R A S T I/ S T I
∆ RASTI/STI = STImosque - RASTIchurch
Figure 13. Behaviour for the RASTI / STIvalues regarding Width for churches / mosques (SRS off).
4.3.2 Sound reinforcement system on
These objective speech intelligibility parameters allow to make a conversion of their values to a subjective scale of speech intelligibility, which is important to know the difference between the results for the two places of worship6. Table 10 presents a summary of these results for Sound Rein-forcement System (SRS) on and off.
Table 10 – Statistics regarding speech intelligibility (Sound Reinforcement System SRS off/on).
SRS off SRS on
STI / RASTI Classification6
31 churches 21 mosques 31 churches 20 mosques
0.00 – 0.30 Bad 3 (10%) - 1 (3%) -
0.30 – 0.45 Poor 17 (55%) 9 (43%) 15 (48%) 4 (20%) 0.45 – 0.60 Fair 11 (35%) 12 (57%) 14 (45%) 16 (80%)
0.60 – 0.75 Good - - 1 (3%) -
0.75 – 1.00 Excellent - - - -
With the SRS off, 10% of the churches have a Bad average speech intelligibility but none of the twenty-one mosques shows that worst classification. The majority of churches have a Poor av-erage rating while the majority of mosques are classified as Fair.
With the SRS on there is a general improvement in the results of the speech intelligibility. Now, only one church (3%) shows a rating of Bad, while previously three (10%) had that classifica-tion. In mosques the improvement is more pronounced (from 43% Poor to only 20%).
Table 10 indicates that 65% of churches presented an average Poor or Bad speech intelligibil-ity with the SRS off. With the activation of SRS, 52% of churches still have Poor or Bad speech intelligibility. There is an improvement in the perception of speech, but it can not be considered that the SRS solves the problem. The overall mean RASTI value in churches only increases slightly from 0.42 to 0.44 with the activation of the SRS2,3.
In mosques, the result is only slightly different. With the SRS off an overall mean STI value of 0.45 was found while after the activation of the SRS, a mean STI of 0.49 was obtained. But the
impact of this equipment in mosques is more apparent if it is found that with SRS off, 43% of the mosques had an average of Poor intelligibility and with the SRS on that figure fell to 20% (espe-cially because they just surpassed the border limit value of 0.45 of this “class”).
5. Conclusion
Churches have in general an average RT (500/1k Hz) of 2 to 5 s when mosques have only about 1 to 3 s, what can be a consequence of the different interior decoration (mainly floor type). These larger RT average values found in churches can be also partially justified because churches have different acoustic objectives than mosques. In both spaces speech is present, but in churches also music has to be taken into account. Here, in addition to the choirs and congregation singing, there is the usual presence of the organ and possibly other instruments, which makes sound design-ing a church a strong challenge to find a balance between the perception of speech and music. Spaces designed just for speech require a shorter reverberation time than others directed to music. In general, longer reverberation times reduce the intelligibility of speech.
It seems that mosques have an overall better acoustic behaviour in this regard. Perhaps due to the sound absorption effect of the floor surface (covered with carpets).
The improvements found by using SRS in worship spaces, may sometimes force a tendency to laxity in the implementation of a previous acoustic project which should be counteracted. How-ever, despite the improvements that the SRS has over sound behaviour in places of worship, these devices are still not a real solution to acoustical problems.
These results show that these equipments have different results in places of worship. In gen-eral they can be used for a small improvement in the acoustic outcome, but they are not the final solution in the acoustic performance of buildings. These findings reinforce the idea that good archi-tecture and design of a worship project are the key elements for the acoustic performance of churches and mosques.
These overall results are largely not in disagreement with other studies about this subject7-11.
REFERENCES
1
A. P. O. Carvalho, Influence of Architectural Features and Styles on Various Acoustical
Meas-ures in Churches, Ph.D. dissertation, Univ. Florida, USA, 1994.
2
M. M. F. Lencastre, A Inteligibilidade da Palavra em Igrejas Católicas através de Análises de
Carácter Objectivo e Subjectivo (in Portuguese), M.Sc. thesis, FEUP, Univ. Porto, Portugal,
1988.
3
A. P. O. Carvalho and M. M. F. Lencastre, Catholic Churches, sound-reinforcement systems, and
RASTI, Int. J. Acous. Vib., 5(1), 7-14, 2000.
4
A. A. Abdou, Measurement of Acoustical Characteristics of Mosques in Saudi Arabia, J. Acoust. Soc. Am., 2003, 113, 1505-1517.
5
C. G. Monteiro, Comparação entre a Acústica em igrejas Católicas e em Mesquitas (in Portu-guese), M.Sc. thesis, FEUP, Univ. Porto, Portugal, 2008.
6
IEC 268-16:1988, Sound system equipment, Part 16: The objective rating of speech intelligibility in
auditoria by the "RASTI" method, IEC, Genéve, 1988.
7
P. Fausti, R. Pompoli and N. Prodi, Comparing the Acoustics of Mosques and Byzantine
Churches, Univ. Ferrara, Italy, 2003.
8
M. K. Abdelazeez, R. N. Hammad and A. A Mustafa, Acoustics of King Abdullah Mosque. J. Acoust. Soc. Am., 1991, 90, 1441-1445.
9
R. N. S. Hammad, RASTI Measurements in Mosques in Amman, Jordan, Applied Acoustics, 30, 1990.
10
Z. Karabiber, Acoustical Problems in Mosques, Proceedings ASA/EAA/DAGA ’99 Meeting, 1999, Berlin, Germany.
11
S. Khaiyat, Mosque Acoustics: an Overview of Current Design Practice in Saudi Arabia,