| Vol. 42 | 2017 |
ABSTRACT: During sugar production, contamination of the sugar by potentially toxic metals may occur. Therefore, it is necessary to develop methods to quantify these contaminants. Analytical method for monitoring of lead in sugar samples was developed with the use of homogeneous ternary system of solvents and UV-Vis spectrophotometry. Ternary system was optimized using multivariate experiments and the best condition was: 10% water, 80% ethanol and 10% methyl isobutyl ketone. As the complexing agent, monosodium 4-(2-pyridylazo) resorcinol used. Calibration curve was linear from 0.64 to 5.00 mg L-1, ABS = 0.0873 [Pb2 +] - 0.0032 and R² = 0.9988. The limit of quantification was 0.53 mg L-1 and limit of detection was 0.45 mg L-1 with 95% confidence level, the standard addition curve was linear, ABS = 0.0736 [Pb2+] + 0.0846 And R² = 0.9971.
Three samples were analyzed in triplicate and the concentration of lead obtained ranged from 84.74 ± 3.70 mg kg-1; 69.93 ± 11.84 mg kg-1 and 76.45 ± 7.12 mg kg-1. For the standard addition curve, the concentration found was approximately 230.00 mg kg -1. Considering the Brazilian standard, the lead concentration should not exceed 2.00 mg kg-1, thus, it’s concluded that the values obtained were not within the norm for this metal.
Optimization of a homogeneous ternary solvent system for the
quantification of lead in crystal sugar samples
Júnior Olair Chagas1+, Silviana Côrrea2, Isabela Cristina Silva Melo3, Fabiana Aparecida Lobo1, Alex Magalhães de
Almeida3
1 Federal University of Ouro Preto (UFOP), Department of Chemistry, 122 Diogo de Vasconcelos St, Ouro Preto, Minas Gerais, 35400-000 Brazil 2 Federal University of Lavras (UFLA), Department of Chemistry, 1001, Doutor Sylvio Menicucci Av, Lavras, Minas Gerais, 37200-000 Brazil 3 University Centre of Formiga (UNIFORMG), 328 Dr. Arnaldo Sena St, Formiga, Minas Gerais, 35570-000 Brazil
+
Corresponding author: Júnior Olair Chagas, e-mail address: [email protected]
ARTICLE INFO
Article history:
Received: September 4, 2017 Accepted: December 20, 2017 Published: December 30, 2017
Keywords: 1. lead 2. cristal sugar
3. homogeneous ternary system 4. quantification
1. Introduction
Saccharum officinarum L., popularly known as
sugarcane, is considered one of the main colonization goods in Brazil and is currently responsible for three of the country's main industrial products: sugar, ethanol and bioenergy1,2. This sector, known as
sugarcane energy, is highly significant to the Brazilian
industrialized products and retail sales of sugar in
natura3. In this regard, Brazil is the world’s largest
producer and exporter of this product4.
reach the consumer with the necessary basic characteristics and free from contamination. Thus, it is essential to maintain complete traceability throughout the production chain to ensure total safety in the use of the product, whatever its subsequent use. And, in order to guarantee adequate quality, a strict control of the various items of the product specification is also of fundamental importance2,7-9.
During some of the processes of its production, sugar can accumulate elements and toxic substances, such as: agrochemicals, copper (Cu), iron (Fe), lead (Pb), arsenic (As) among others2,5. Plants may absorb
contaminants10 and incorporate inorganic compounds
in the final product. In addition the machinery used in the production process may contaminate the sugar with (Cd), lead (Pb), iron (Fe), nickel (Ni), and selenium (Se)2.
Therefore, studies were carried out to monitor metals in the most diverse industrialized and non-industrialized foods7,9,11-13. According to Pereira and
Rodrigues (2013), amongst the 14 chemical agents, lead is the principal contaminant. Unlike other metals, such as copper (Cu), iron (Fe) and zinc (Zn), lead has no known physiological function in the body, always causing intoxication. Its harmful effects can affect practically all the organs and systems of the human organism, where its elimination is extremely slow, and can take up to 10 years14-16.
Studies reported in the literature describe the use of various analytical techniques9, especially those involving ICP-MS. This technique is relatively expensive and hitherto without application in sugar production plants for the monitoring of potentially toxic metals. Thus, analytical techniques of monitoring with low cost are of paramount importance to the sugar industries.
One technique that stands out from these needs is spectrophotometry in the ultraviolet-visible region (UV-Vis)8. However, the monitoring of metals in
samples of crystal sugar in literature is scarce, since most of the procedures that use UV-Vis for the purpose of evaluation of contamination of metals need samples with homogeneous solutions.
There is a system that can work around this problem, known as the homogeneous ternary system of solvents, Single Phase. Such a system consists of
organic solvent in a mixture to allow the formation of a homogeneous solution, leading to the miscibility of the chelating agent in aqueous solutions.
The objective of this work is the development of a low-cost, robust and easy-to-apply analytical technique with the use of a homogeneous ternary system of solvents and UV-Vis spectrophotometry for the determination of lead in crystal sugar samples.
2. Experimental
2.1 Equipment and Supplies
All the reagents used in the procedures of this study were of analytical grade P.A., counting on deionized water for the preparation of the solutions. In the preliminary studies, a solution of glucose 5% m/m obtained in local pharmacy was used, this being the aqueous phase of the homogeneous ternary system of solvents. As chelating agent, a solution of monosodium 4-(2-pyridyl-azo) resorcinol (PAR) at 1.39x10⁻⁴ mol L-1 was used.
The equipment used was the analytical balance Aaker®, model M254A; UV-Vis spectrophotometer BRASTEC® Digital Microprocessed, model Q798DRM; and Analion® PM608 Digital Bench pH Meter.
2.2 Methods
2.2.1 Solvent Composition Study
To obtain the Roozeboom diagram, the triangle of the ternary system, the following solvent system was used: water, methyl isobutyl ketone and ethanol. Thus, mixtures and titrations of solvent pairs miscible with a third solvent were performed until the point of opalescence18,19 where the compositions were defined
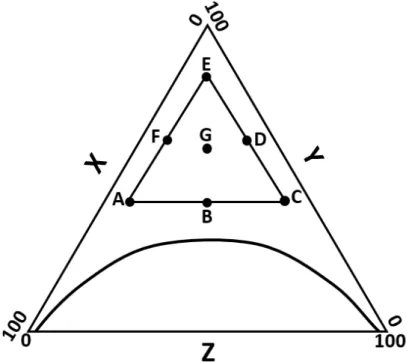
Figure 1. Generic representation of the Roozeboom diagram for the homogeneous ternary system of solvents with multivariate planning study delimitation.
In Figure 1, the orange line represents the binodal curve, characterizing the division of phase region with proportions of homogeneous solutions and mixtures; X, Y and Z represent the percentages of the solvents.
Table 1. Proportions % m/m of the points used for the
design of the optimization of the homogeneous ternary system of solvents proposed by this work.
Point
Water (% m/m)
Methylisobutylketone (% m/m)
Ethanol (% m/m)
A 10.00 50.00 40.00
B 50.00 30.00 60.00
C 50.00 10.00 40.00
D 30.00 10.00 60.00
E 10.00 10.00 80.00
F 10.00 30.00 60.00
G 20.00 20.00 60.00
Thus, all the tests relative to the solvent proportions shown in Figure 1 were carried out, where a fixed concentration of lead was added to all solutions, as well as the chelating agent. Subsequently, all the solutions obtained were analyzed in the bench pH meter and UV-Vis spectrophotometer to evaluate the best proportion of the proposed solvents. The wavelength adopted was λmax = 550 nm19.
All results were plotted with their respective
2.2.2 Preparation of the analytical curve
With the best analytical signal condition and pH obtained, that is, the best proportion in % m/m of solvents, the analytical calibration curve was constructed. Starting from a standard solution of lead (1000 mg L-1), that was successively diluted to obtain concentrations between 0 and 5 mg L-1.
2.2.3 Preparation of the addition-standard curve
From a standard solution of lead (1000 mg L-1), known concentrations of the metal were added in the homogeneous solutions obtained with the sugar samples to obtain the standard addition curve, delimited between 0 and 2.50 mg L-1.
2.2.4 Sampling analysis
3. Results and Discussion
The chelating agent solution when added to the sugar solution provides a heterogeneous solution, making it impossible to analyze by the UV-Vis spectrophotometer. To solve this problem, a homogeneous ternary system of solvents was employed8,17. It is a geometric representation of an equilateral triangle whose components, represented by each vertex of the triangle, may present with a single phase or two phases18. In this work, the point of
interest was the single phase (FU), as it provides a homogeneous mixture of solvents, which consists of: an aqueous portion (sugar / glucose solution), an organic liquid immiscible in water (chelating agent solution) and a third liquid miscible in the previous two. The possibilities of proportions in % m / m of the ternary system for an F.U. are numerous8. The
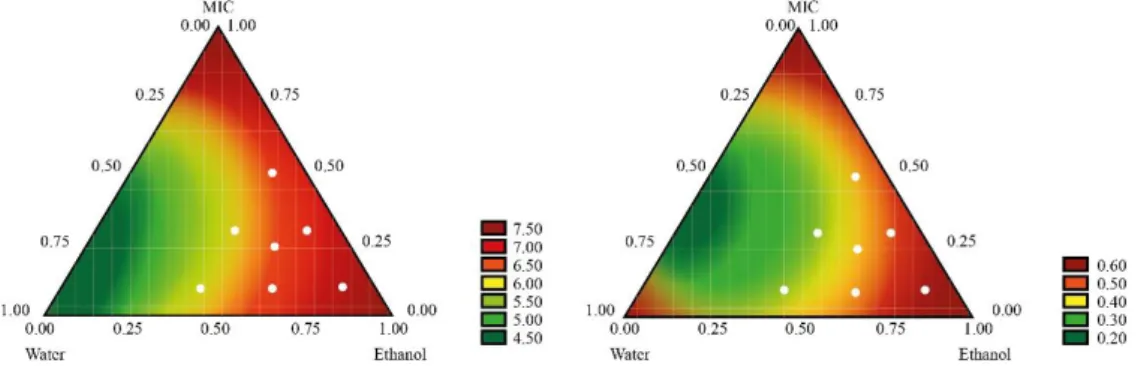
experiments were statistically planned in a multivariate manner, and Figure 2 shows the results obtained for pH and absorbance respectively.
Figure 2. Homogeneous ternary system of solvents, water: ethanol: methylisobutylketone,
with pH evaluation by multivariate planning and with absorbance evaluation by the lead and PAR complex in λmax = 550 nm.
Figure 2 shows that the best region to provide a higher analytical signal (absorbance) is at point E, which corresponds to 10% water (glucose / sugar), 10% methyl isobutyl ketone and 80% ethanol. There is a contrast provided by the direct relation of pH to the analytical signal, i.e., the region of better pH to obtain higher absorbance, which is at pH = 7.3. Visibly, we can see a difference in the coloration of the solution, where in the above characteristics intense yellow was observed19. Thus, the best condition of the
homogeneous mixture is at a ratio %m / m, of 80.00 ethanol, 10.00 methylisobutylketone, and 10.00 solution of sugar.
Ghasemi and Maeder (2007)20 carried out studies
on the protonation and complexation of PAR with nickel (Ni) in acid medium, and obtained a direct relation with the theoretical and experimental data,
explaining the behavior of the formation reaction of this complex. The higher nickel concentration is observed in the more acid solution that is needed to allow a complete reaction to occur. Lead is a similar element to nickel, presenting some similar metallic properties and, if we compare the results obtained by the multivariate experimental planning proposed here, we conclude that there was a complete complexation of lead at a specific pH and complexing reagent concentration. This fact is justified the presence of an excess of the complexant inthe lead concentration, which theoretically does not require a more acidic medium for a higher yield of the complexation reaction.
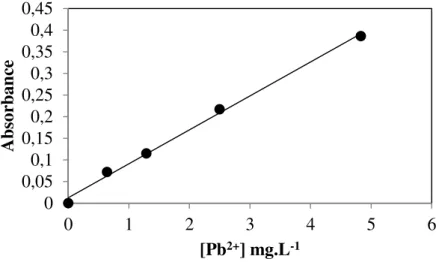
Figure 3. Analytical curve of lead complexed with PAR in homogeneous sugar solution: ethanol: methylisobutylketone
The analytical curve was linear from 0 to 5.0 mg L-1 with the following characteristic: ABS = 0.0873 [Pb2+] - 0.0032 and R² = 0.9988. The limit of quantification was 0.53 mg L-1 and that of detection of 0.45 mg L-1 with 95% confidence in the Student's test. The standard addition curve was linear between 0 and 2.50 mg L-1 with the following characteristic: ABS = 0.0736 [Pb2+] + 0.0846 with R² = 0.9971.
The analysis of the samples was carried out in triplicate and, based on the condition of the analytical curve, a lead concentration was obtained for the first sample of 84.74 ± 3.70 mg kg-1 sugar; for the second 69.93 ± 11.84 mg kg-1; for the third 76.45 ± 7.12 mg kg-1. For the standard addition curve, the concentration found was approximately 230.000 mg kg-1. The difference in concentration values is attributed to the samples, since for the standard addition curve samples of crystal sugar other than the analytical calibration curve were used.
Brazilian legislation provides a maximum lead content of 2.00 mg per kg of feed, thus, the samples evaluated have undesirable lead levels6,9 and are
considered non-compliant with current legislation.
4. Conclusion
The concentration found presents risks to the human being if consumed daily, since its value proved to be higher than allowed by Brazilian legislation. In addition, the method used is effective for the determination of lead in sugar samples and can be used in the quality control of sugar production companies in Brazil and in the world, since it is a robust, easy to apply and relatively inexpensive
6. References
[1] Regazzini, L. C., Bacha, C. J. C., A Tributação no Setor Sucroenergético do Estado de São Paulo: anos de 2000 e 2008, Revista de Economia e Sociologia
Rural 50 (2012) 801-818.
https://doi.org/10.1590/S0103-20032012000400012
[2] Oliveira, D. T., Esquiaveto, M. M. M., Junior, J. F. S., Impacto dos itens da especificação do açúcar na indústria alimentícia, Cienc. Tecnol. Aliment. 27 (2007) 99-102. https://doi.org/10.1590/S0101-20612007000500018
[3] Neves, M. F. et. al., A Dimensão do Setor Sucroenergético: Mapeamento e Quantificação da Safra 2013/14. São Paulo: Markestrat, Fundace,
FEA-RP/USP, 2014. 42.
http://www.unica.com.br/download.php?idSecao=17& id=25818107
[4] Souza, M. J. P. D., Oliveira, P. R. de, Burnquist,
H. L., Lar “Doce” Lar: uma análise do consumo de
açúcar e de produtos relacionados no Brasil, Revista de Economia e Sociologia Rural 51 (4) (2013)
785-796.
https://doi.org/10.1590/S0103-20032013000400009
[5] O. M. D. SAÚDE, Diretriz: Ingestão de açúcares por adultos e crianças: WHO Press 2015.
[6] G. A. M. Magna, Dissertação de Mestrado, Universidade Federal da Bahia, Brasil, 2011.
0
0,05
0,1
0,15
0,2
0,25
0,3
0,35
0,4
0,45
0
1
2
3
4
5
6
A
bs
or
ban
ce
(2009) 454-465. https://doi.org/10.1016/j.trac.2009.02.005
[8] Chagas, O., Corrêa, S., de Almeida, A. M., Uso de sistema ternário homogêneo de solventes e espectrofotometria UV-VIS no desenvolvimento de método para a determinação de cobre em amostras de açúcar, Conexão Ciência (Online) 9 (2014) 14. https://doi.org/10.24862/cco.v9i1.279
[9] Wilwerth, M. W., Congresso de Iniciação Científica, 17ª Jornada Científica da UFSCar, São Carlos, Brasil, 2009.
[10] Sereno, M. L. Dissertação de Mestrado, Universidade de São Paulo, Brasil, 2004.
[11] Zheng, J., Chen, K. H., Yan, X., Chen, J. S., Hu, G.-C., Peng, X.-W., Yuan, J.-G., Mai, B.-X., Yang, Z.-Y., Heavy metals in food, house dust, and water from an e-waste recycling area in South China and the potential risk to human health, Ecotoxicol. Environ.
Saf. 96 (2013) 205-212.
https://doi.org/10.1016/j.ecoenv.2013.06.017
[12] Tarley, C. R. T., Coltro, W. K. T., Matsushita, M., Souza, N. E. de, Characteristic Levels of Some Heavy Metals from Brazilian Canned Sardines (Sardinella brasiliensis), J. Food Compos. Anal. 14
(6) (2001) 611-617. 611-617.
https://doi.org/10.1006/jfca.2001.1028
[13] Santos, J. S. dos, Pires dos Santos, M. L., Moreira Conti, M., Novais dos Santos, S., Oliveira, E. de, Evaluation of some metals in Brazilian coffees cultivated during the process of conversion from conventional to organic agriculture, Food Chem. 115
(4) (2009) 1405-1410.
https://doi.org/10.1016/j.foodchem.2009.01.069
[14] Pereira, V. A., Rodrigues, O. M. P. R., Intoxicação Crônica por Chumbo e Implicações no Desempenho Escolar, Psico 44 (4) (2013) 571-580. http://revistaseletronicas.pucrs.br/revistapsico/ojs/inde x.php/revistapsico/article/view/12688/10850
[15] Pereira, V. A., Dissertação de Mestrado, Universidade Estadual Paulista "Júlio de Mesquita Filho", Brasil, 2006.
[16] Ramos, F. M., Costa, J. M., Lead kinetics in human body and its significance to health. Ciênc. saúde coletiva [online]. 2004, vol.9, n.1, pp.167-181. ISSN 1413-8123. https://doi.org/10.1590/S1413-81232004000100017
[17] Almeida, A. M. de, Tese de Doutorado, Universidade Estadual de Campinas, Brasil, 2003.
[18] Moore, W.J., Physical Chemical, Prentice-Hall, Englewood Cliffs, 2th ed, 1959.
[19] Onishi, H., Photometric determination of traces of metals, New York: John Wiley and Sons, Inc.,New York, NY, 1986.