• Nenhum resultado encontrado

Braz. J. Chem. Eng. vol.19 número3

N/A
N/A
Protected

Academic year: 2018

Share "Braz. J. Chem. Eng. vol.19 número3"

Copied!
11
0
0

Texto

(1)

ISSN 0104-6632 Printed in Brazil

Vol. 19, No. 03, pp. 343 - 353, July - September 2002

Brazilian Journal

of Chemical

Engineering

AN EMPIRICAL METHOD TO CORRELATE AND

PREDICT SOLUTE DISTRIBUTION IN TERNARY

LIQUID-LIQUID SYSTEMS

J.M.Zamaro and E.A.Campanella

*

Instituto de Desarrollo Tecnológico para la Industria Química (INTEC), UNL - CONICET, Güemes 3450 -3000 Phone: (54) 342-4559174-77,

Fax: (54) 342-4550944, Santa Fe Argentina, E-mail: tquique@ceride.gov.ar,

(Received: December 3, 2001; Accepted: August 22, 2002)

Abstract - This paper presents a method that combines activity coefficient models with Hand’s equation for tie lines. The proposed method calculates solute distribution in liquid-liquid ternary systems. The combination improves the calculated solute distributions using activity coefficient models while Hand's equation gives a good correlation of the experimental tie lines. The method could be used to extrapolate experimental information.

Keywords: liquid-liquid equilibrium, distribution coefficients, UNIQUAC, UNIFAC, Hand.

INTRODUCTION

Prediction and correlation of ternary liquid-liquid equilibrium is important in chemical engineering applications, such as extraction and heterogeneous azeotropic distillation. Several methods of equilibrium data correlation/prediction have been presented in the literature. A series of articles (Sørensen et al., 1979a, 1979b; Magnussen et al., 1980) gives an excellent review of experimental data sources, correlation models and prediction methods. Basically, there are two approaches to correlating data. One of them uses equality of activity with a model for the activity coefficient; the other correlates data with equations such as that of Hand (Treybal, 1963). For practical utilization of equilibrium data in calculations of separation processes, sometimes it is convenient to describe equilibrium in terms of the distribution coefficients for each component. As the distribution coefficients are composition-dependent, they are normally represented as polynomials (Rod, 1976).

In previous work (Mandagarán and Campanella, 2001), the two approaches to correlating data were combined in a way that the resulting method for calculating distribution coefficients produces results that improve results obtained with UNIQUAC. In this article we present results obtained by applying the proposed mixed method to a wide range of ternary systems.

MODELS AND METHOD

Hand’s method is a well-known empirical correlation for tie lines in liquid-liquid equilibrium (Treybal, 1963). Consisting of a molar fraction and a natural logarithm, Hand’s equation is given by

(2)

344 J.M.Zamaro and E.A.Campanella the phase rich in component 3, and k and C are

ternary-system-dependent constants.

Another way to calculate liquid-liquid equilibrium is using the equality of chemical potentials for each component in both phases. The equality is normally rewritten in terms of activities. Using a model for the activity coefficients calculations can be carried out to obtain liquid-liquid compositions (Sørensen et al., 1979b). Two models were used in our calculations: UNIQUAC (Abrams and Prausnitz, 1975) and UNIFAC (Fredenslund et al., 1975). The data, equations, parameters and programs were taken from Sørensen and Arlt (1980) and Magnussen et al. (1981).

To obtain the distribution coefficients, mi, we combined Hand’s equation and activity coefficient models in the following way:

1) k and C constants of Hand's equation (Eqn. 1) were obtained using experimental liquid-liquid ternary equilibrium data.

2) The binodal curve of the ternary system under study was obtained using an activity coefficient model.

3) x1 and x3 were obtained from the binodal curve calculated in step 2 using a chosen value of x2. 4) y2/y1 was obtained using Eqn. 1 with x2/x3 , k and C from previous steps.

5) y1,y2 and y3 were calculated with y2/y1 and the binodal curve was calculated in step 2.

6) mi = yi / xi was computed.

RESULTS AND DISCUSSIONS

Tables 1 and 2 contain the systems studied in this work. The type of mixture, reference and temperature are recorded in the tables. The systems under study listed in Table 1 encompasses ternary mixtures with and without water, with one or two inmiscible binaries. The systems under study listed in Table 2 have inusual binodal curve and/or tie lines. Tables 1 and 2 and Figures 1 through 8 compare and display results from the calculations described in item Models and Method. In the last column of Tables 1 and 2 calculated distribution coefficients for the solute, component 2, are shown quantitatively. The last column in the tables reflects the agreement between the model/method and the experimental data. The first model in the list is the one that shows the best agreement with the experiments. The numbers in parenthesis are average absolute relative deviations.

As expected, correlation of data (UNIQUAC) is better than prediction (UNIFAC) for phase envelope

and tie-line determination. Those results are not shown in Tables 1 and 2. In addition, depending on the system, results from UNIQUAC belong to different sets of parameters (Sørensen and Arlt, 1980). The parameters are “specific” (SP) when they are fitted to one particular system. The parameters are “common” (CO) when they are determined by simultaneous correlation of experimental data from different systems. The values of the specific parameters used are from Sørensen and Arlt (1980), Table 1 indicates the pages where to find them. Table 3 displays the common parameters used in this work. In Tables 1 and 2 it is possible to observe under the last heading that the calculation method that combines UNIQUAC with Hand´s correlation gives better coefficient distributions than the one calculated using UNIQUAC alone. In some cases the combination UNIFAC plus Hand is even better than correlation of data using UNIQUAC.

To get a better picture of the agreement, results for one representative system in Table 1(1- Butanol(1)/Acetic Acid(2)/Water(3), system nº 4) are shown in Figures 1 to 4. In Figure 1 Hand´s correlation is shown graphically for several systems in Table 1, including 1-Butanol(1)/Acetic Acid(2)/Water(3). Figure 2 shows experimental, UNIQUAC and UNIFAC results. Figure 3 shows several tie lines. The tie lines are from experimental data, UNIQUAC with specific parameters and UNIFAC. In Figures 2 and 3 it is possible to observe the fact that UNIQUAC better represents the binodal curve of liquid-liquid equilibrium in ternary mixtures than the corresponding tie lines. For many cases in Table 1, the fact that binodal representation is better than tie-line representation is true for UNIFAC too. The association of Hand with UNIQUAC/UNIFAC proposed in this paper is based on those observations. Figure 4 displaying acetic acid concentrations in the 1-Butanol-rich phase and in the water-rich phase shows that a combination of UNIQUAC with Hand gives better results than UNIQUAC with specific parameters.

(3)

concentrations in both phases; here UNIQUAC with specific parameters gives better results than it does when combined with Hand. This last situation is similar for many systems in Table 2. For the Hand plus UNIQUAC/UNIFAC combination to work, Hand's equation must correlate data very well. The value of r for the correlation, written in a column in Tables 1 and 2, indicates how good the correlation is. When the value of r is larger than 0.98, Hand provides a good correlation of the tie lines, as can be seen in Figure 1 for the systems in Table 1 and in Figure 5 for the systems in Table 2. Then, when r is larger than 0.98, the combination of models ( Hand + UNIQUAC) gives better results than UNIQUAC alone. A way to improve the method for the systems in Table 2 is by replacing the linear correlation of Hand's equation by a nonlinear correlation, as suggested by Carniti et al.(1978) for a more correct extrapolation for estimating the location of the plait

point.

The proposed combination seems to work because it uses the best of the approaches cited earlier in this work. The orientation of the tie-lines is set by Hand’s equation and the binodal curve is set by UNIQUAC/UNIFAC. It is to be expected that the proposed method will work better in cases where tie line differences between UNIQUAC and experiments are larger. Also, we could use the proposed combination to obtain improved distribution coefficients, which in a later step are fitted with polynomials, as recommended in the literature (Rod, 1976). The combination works even when the available experimental information is minimal, allowing for extrapolation of data. The minimum experimental data required for the combination to work is the two tie lines that are needed to obtain Hand's parameters k and C in Eqn. 1.

Table 1: Model performance for several ternary systems

System Type Temperature

(K) Reference

Hand’s Correlation (r) m2 Calculation Performancea) 1 Water (1) Ethanol (2) Hexane (3)

1 298.15

Sørensen and Arlt,

1980 Vol.5/2, p.364

0.9911

UNIQUAC SP+Hand (7.5) UNIFAC+Hand (7.7) UNIQUAC SP (16.3)

UNIFAC (58.3)

2

1 – Butanol (1) Ethanol (2)

Water (3)

1 298.15

Sørensen and Arlt,

1980 Vol.5/2, p.340

0.9911

UNIQUAC SP+Hand (4.7) UNIQUAC SP (6.5) UNIFAC+Hand (13.7) UNIFAC (35.4) 3 Water (1) Ethanol (2) Benzene (3)

1 298.15

Sørensen and Arlt,

1980 Vol.5/2, p.350

0.9999

UNIQUAC SP+Hand (1.8) UNIQUAC SP (6.5) UNIFAC+Hand (3.4)

UNIFAC (8.7)

4

1 – Butanol (1) Acetic Acid (2)

Water (3)

1 298.15

Sørensen and Arlt,

1980 Vol.5/2, p.227

0.9995

UNIQUAC SP+Hand (2.2) UNIQUAC SP (3.1)

UNIFAC (9.2) UNIFAC+Hand (13.9)

5

Water (1) 1,2 – Ethanediol (2) Formic Acid, Ethyl Ester (3)

2 303.15

Sørensen and Arlt,

1980 Vol.5/2, p.417

0.9823 UNIQUAC CO+Hand (14.9) UNIQUAC CO (96.8)

6

Ethane, 1,2– Dichloro (1) 2 – Propanol (2)

Water (3)

1 298.15

Sørensen and Arlt,

1980 Vol.5/2, p.207

0.9850

UNIQUAC SP (6.1) UNIQUAC SP+Hand (11.9)

UNIFAC+Hand (14.4) UNIFAC (97.1)

7

1 – Hexanol (1) Methane, Nitro (2)

Water (3)

2 313.15

Sørensen and Arlt,

1980 Vol.5/2, p.71

0.9244 UNIQUAC SP+Hand (31.4) UNIQUAC SP (10.3)

8

Hexane (1) 2- Propanone (2)

Water (3)

1 298.15

Sørensen and Arlt,

1980 Vol.5/2, p.487

0.9995

UNIQUAC SP+Hand (1.2) UNIFAC+Hand (2.0)

(4)

346 J.M.Zamaro and E.A.Campanella

Continuation Table 1

9

Acetic Acid, Ethyl Ester (1) Acetic Acid (2)

Water (3)

1 303.15

Sørensen and Arlt,

1980 Vol.5/2, p.220

0.9997

UNIQUAC SP+Hand (1.4) UNIQUAC SP (1.9) UNIFAC+Hand (6.4)

UNIFAC (37.4)

10

Ethane, 1,1,2 – Trichloro (1) 2 – Propanone (2)

Water (3)

1 298.15

Sørensen and Arlt,

1980 Vol.5/2, p.167

0.9997

UNIQUAC SP (1.8) UNIQUAC SP+Hand (2.0)

UNIFAC+Hand (2.0) UNIFAC (4.4)

11

Ethane, 1,1,2 – Trichloro (1) 2- Butanone (2)

Water (3)

2 298.15

Sørensen and Arlt,

1980 Vol.5/2, p.168

0.9911

UNIQUAC SP (2.5) UNIQUAC SP+Hand (7.1)

UNIFAC+Hand (7.1) UNIFAC (9.3)

12

Water (1) Acetic Acid (2) Aniline, N,N– Dimethyl (3)

1 298.15

Sørensen and Arlt,

1980 Vol.5/2, p.301

0.9789 UNIQUAC SP+Hand (2.6) UNIQUAC SP(7.8)

13

Benzene (1) 2 – Propanone (2)

Water (3)

1 293.15

Sørensen and Arlt,

1980 Vol.5/2, p.481

0.9997

UNIQUAC SP+Hand (1.5) UNIQUAC SP (3.0) UNIFAC+Hand (4.5)

UNIFAC (15.9)

14

Water (1) Formic Acid (2)

Benzene (3)

2 303.15

Sørensen and Arlt,

1980 Vol.5/2, p.54

0.9986

UNIQUAC SP+Hand (1.9) UNIFAC+Hand (1.9)

UNIQUAC SP (7.6) UNIFAC (29.5)

15

Heptane (1) Benzene (2) Diethylene Glycol (3)

1 423.15

Sørensen and Arlt,

1980 Vol.5/3 p.163

0.9943

UNIQUAC SP+Hand (3.9) UNIQUAC SP (3.5) UNIFAC+Hand (4.9)

UNIFAC (35.1)

16

Heptane (1) Toluene (2) Diethylene Glicol (3)

2 298.15

Sørensen and Arlt,

1980 Vol.5/3 p.165

0.9925

UNIQUAC SP+Hand (6.0) UNIFAC+Hand (6.1)

UNIQUAC SP (6.5) UNIFAC (6.8)

17

Decane (1) 1-Octanol (2) Diethylene Glicol (3)

1 293.15

Sørensen and Arlt,

1980 Vol.5/3 p.172

0.9951

UNIQUAC SP+Hand (8.0) UNIFAC+Hand (8.1) UNIQUAC SP (12.3)

UNIFAC (51.1)

18

Heptane (1) Benzene (2) Methanol (3)

1 286.95

Sørensen and Arlt,

1980 Vol.5/2, p.119

0.9975

UNIQUAC SP+Hand (1.7) UNIQUAC SP (1.7) UNIFAC+Hand (8.4) UNIFAC (18.5) 19 Heptane (1) Hexane (2) Methanol (3)

2 305.95

Sørensen and Arlt,

1980 Vol.5/2, p.133

0.9707

UNIQUAC SP (2.7) UNIFAC+Hand (4.1) UNIQUAC SP+Hand (8.3)

UNIFAC (21.6) a) m2 = distribution coefficient of component 2 = y2/x2 , SP=specific parameter

(5)

Table 2: Model performance for several ternary systems with unusual behavior

System Type Temperature

(K) Reference

Hand's Correlation (r) m2 Calculation Performancea) 1

Acetic acid, ethyl ester (1) 1-Butanol (2)

Water (3)

2 293.15

Sørensen and Arlt,

1980 Vol.5/3, p.50

0.985

UNIQUAC SP(12.4) UNIFAC+Hand (14.6) UNIQUAC SP+Hand (15.7)

UNIFAC (26.1)

2

Hypochlorous acid, tertbutyl ester (1) 2-propanol, 2-methyl (2)

Water (3)

1 333.15

Sørensen and Arlt,

1980 Vol.5/3, p.101

0.9744 UNIQUAC SP+Hand (27.5) UNIQUAC SP (35.4)

3

Water (1) Morpholine (2)

Benzene (3)

1 293.15

Sørensen and Arlt,

1980 Vol.5/3, p.105

0.9948 UNIQUAC SP+Hand (1.6)

UNIQUAC SP (7.8)

4

Water (1) Etanol, 2-ethoxy (2)

Styrene (3)

1 293.15

Sørensen and Arlt,

1980 Vol.5/3, p.157

0.9817

UNIQUAC SP+Hand (5.8) UNIFAC+Hand (5.8)

UNIQUAC SP (7.4) UNIFAC (79.3)

5

Benzene (1) Pyridine (2) Water (3)

1 298.15

Sørensen and Arlt,

1980 Vol.5/3, p.228

0.9793

UNIQUAC SP+Hand (6.1) UNIFAC+Hand (6.2)

UNIQUAC SP (8.2) UNIFAC (10.3)

6

Heptane (1) Toluene (2) Diethylene glycol (3)

2 298.15

Sørensen and Arlt,

1980 Vol.5/3, p.165

0.9925

UNIQUAC SP+Hand (6.0) UNIFAC+Hand (6.2)

UNIQUAC SP (6.5) UNIFAC (6.8)

7

Water (1) Formic acid (2) 2-Pentanol, 4-methyl (3)

1 303.15

Sørensen and Arlt,

1980 Vol.5/2, p.60

0.9963

UNIQUAC SP (5.9) UNIQUAC SP+Hand (6.1)

UNIFAC+Hand (17.2) UNIFAC (212.1)

8

Hexadecanoic acid, methyl ester (1) 9-octadecenoic acid(cis),

methyl ester (2)

2 298.15

Sørensen and Arlt,

1980 Vol.5/2, p.200

0.8437 UNIQUAC CO (2.3)

UNIQUAC CO+Hand (14.6)

9

Water (1) Ethanol (2) Heptane (3)

1 303.15

Sørensen and Arlt,

1980 Vol.5/2, p.376

0.8768

UNIQUAC SP+Hand (31.0) UNIFAC+Hand (31.9) UNIQUAC SP (235.0)

UNIFAC (258.6)

10

Propanoic acid, nitrile (1) Heptane (2) Octane, 1,8-oxy,

Perfluoro (3)

2 298.15

Sørensen and Arlt,

1980 Vol.5/2, p.460

0.8696 UNIQUAC SP (6.7)

UNIQUAC SP+Hand (37.0)

11

1-Propanol, 2-methyl (1) Propanal (2)

Water (3)

2 298.15

Sørensen and Arlt,

1980 Vol.5/2, p.461

0.9916

UNIQUAC SP+Hand (9.1) UNIFAC+Hand (9.2) UNIQUAC SP (58.8) UNIFAC (170.1)

12

Water (1) 1-Propanol (2)

Heptane (3)

1 298.15

Sørensen and Arlt,

1980 Vol.5/2, p.584

0.9429

UNIQUAC SP (14.9) UNIQUAC SP+Hand (15.1)

UNIFAC+Hand (15.6) UNIFAC (86.3)

13

Water (1) 1-Propanol (2) Ether diphenyl (3)

1 298.15

Sørensen and Arlt,

1980 Vol.5/2, p.587

0.8615 UNIQUAC SP+Hand (55.9) UNIQUAC SP(3.1)

14

1-Hexanol (1) Methane, nitro (2)

Water (3)

2 313.15

Sørensen and Arlt,

1980 Vol.5/2, p.71

0.9348 UNIQUAC SP+Hand (31.4) UNIQUAC SP (10.3)

(6)

348 J.M.Zamaro and E.A.Campanella

Figure 1: Representation of Hand's correlation for some systems in Table 1.

(7)

Figure 3: Tie lines for 1-Butanol(1) - Acetic Acid(2) - Water(3). System nº 2 in Table 1.

Figure 4: Distribution of acetic acid(2) between the water(3)-rich phase and the 1-butanol(1)-rich phase. System nº 2 in Table 1.

(8)

350 J.M.Zamaro and E.A.Campanella

Figure 6: Binodal curve for Water(1) - 1-Propanol(2) - Diphenyl ether(3). System nº 13 in Table 2.

Figure 7: Tie lines for Water(1) - 1-Propanol(2) - Diphenyl ether(3). System nº 13 in Table 2.

(9)

Table 3: Common UNIQUAC interaction parameters

i j ai j, K aj i, K

Water (1) - 1, 2 Ethanediol (2) - Formic Acid, Ethyl Ester (3)

1 2 - 221.13 - 39.881

2 3 170.57 363.06

3 3 211.84 104.70

Hexadecanoic Acid, Methyl Ester (1) – 9 Octadecenoic Acid (Cis), Methyl Ester 82) – Acetic Acid, Nitrile (3)

1 2 - 4.6931 25.370

1 3 260.96 22.177

2 3 235.50 28.275

CONCLUSIONS

This paper presents a method to calculate coefficient distributions in ternary liquid-liquid systems. The proposed method combines Hand’s equation with both the UNIQUAC and the UNIFAC models. When experimental tie lines are well correlated with Hand's equation, the combination allows obtaining distribution coefficients that describe experimental distribution coefficients better than the coefficients calculated using UNIQUAC alone.

ACKNOWLEDGMENTS

The authors are thankful for the financial aid received from CONICET, UNL and ANPCyT.

NOMENCLATURE

C [- ] constant in Hand's equation (Eqn. 1) k [ - ] constant in Hand's equation (Eqn. 1) x [ - ] liquid molar fraction phase rich in

component 3

y [ - ] liquid molar fraction phase rich in component 1

REFERENCES

Abrams, D.S. and Prausnitz, J.M., Statistical thermodynamics of liquid mixtures: a new expression for the excess Gibbs energy of partly or completely miscible systems, AIChE J., 21, 16 (1975).

Carniti, P., Cori, L. and Ragaini, V., A Critical Analysis of the Hand and Othmer-Tobias Correlations, Fluid Phase Equilibria, 2, 39 (1978). Fredenslund, A., Jones R.L. and Prausnitz, J.M.,

Group Contibution Estimation of Activity Coefficients in Nonideal Solutions, AIChE J., 21, 1086 (1975).

Magnussen, T., Sørensen, J.M., Rasmussen, P. and Fredenslund, A., Liquid-Liquid Equilibrium Data: Their Retrieval, Correlation and Prediction. Part III: Prediction, Fluid Phase Equilibria, 4, 151 (1980).

Magnussen, T., Rasmussen, P. and Fredenslund, A., UNIFAC Parameter Table for Prediction of Liquid-Liquid Equilibria, Ind. Eng. Chem. Process Des. Dev., 20, 331 (1981).

Mandagarán, B. and Campanella, E.A., Distribution Coefficient Calculation in Ternary Liquid-Liquid Systems, Latin American Applied Research, 31, 533 (2001).

Rod, V., Correlation of Equilibrium Data in Ternary Liquid-Liquid Systems, The Chemical Engineering Journal, 11, 105 (1976).

Sørensen, J.M., Magnussen, T., Rasmussen, P. and Fredenslund, A., Liquid-Liquid Equilibrium Data: Their Retrieval, Correlation and Prediction. Part I: Retrieval, Fluid Phase Equilibria, 2, 297 (1979a).

Sørensen, J.M., Magnussen, T., Rasmussen, P. and Fredenslund, A., Liquid-Liquid Equilibrium Data: Their Retrieval, Correlation and Prediction. Part II: Correlation, Fluid Phase Equilibria, 3, 47 (1979b).

Sørensen, J.M. and Arlt, W., Liquid-Liquid Equilibrium Data Collection, Dechema (1980). Treybal, R., Liquid Extraction, McGraw Hill, New

(10)

352 J.M.Zamaro and E.A.Campanella

_______________________________________

APPENDIX A: UNIFAC Equation

The UNIFAC model expresses the component activity coefficient γi as a function of temperature and composition as follows:

i i i

i i

i i

i i

n 1 RI n RI

RI RI

q 1 n QI z (1 n

QI QI

γ = − + +

  + − − − +   k ki ki k ki k k (all groups) S S G n  

θ −

η η

 

i

j j i i

(all components)

RI =r /

x r ,

(A.2)

i j j i i

QI =q /

x q

k ( j)

j k k

R =

v R ,

k ( j)

j k k

q =

v Q (A.3)

(i) ki k k

G =Q v ,

i k Gki ix

θ =

(A.4)

m

ki mi mk

(all groups)

S =

G τ ,

i

k Ski ix

η =

(A.5)

mk exp ( amk/T),

τ = − z 10= (A.6)

In (A.3), r and j q are the molecular (UNIQUAC) j volumes and surfaces areas. They are calculated from the appropriate group properties Rj and Qk; v(i)k is the number of groups of type k in molecule i . In (A.6), the group interaction parameter amk has

the unit Kelvin. The coordination number z is arbitrarily s et equal to ten. UNIFAC group

interaction parameters amk are given by Magnussen et al. (1981).

APPENDIX B: UNIQUAC Equation

The UNIQUAC equation for G consists of two E parts, a combinatorial part that attemps to describe the dominant entropic contribution, and a residual part due primarily to intermolecular forces that are responsible for the enthalpy of mixing.

E E E

G G (combinatorial) G (residual)

RT = RT + RT (B.1)

E i i i i i i i i G (combinatorial) x n RT x z

q x n 2 Φ = + Θ + Φ

(B.2) E

i i j ji

i j

G (residual)

q x n RT

i, j 1, 2,...., N (components)

= − Θ τ

=

(B.3)

i i i i

i i

j j j j

j j

x q x r

,

x q x r

Θ = Θ =

(B.4)

ji ji

a

exp ( )

T

τ = − (B.5)

In (B.4) parameters r , qi i are pure-component molecular-structure constants depending on molecular size and external surface areas. The coordination number z is set equal to ten. In (B.5) the interaction parameter aji has the unit Kelvin. ”Specific” parameters are UNIQUAC parameters fitted individually to each ternary system. Table 1 indicates the page of Sφrensen and Arlt (1980) where to find the specific parameter values. “Common” parameters are reported in Table 3.

(11)

APPENDIX C: Hand Equation

The Hand correlation derives from the mass-action law assuming that components 1 and 3 are scarcely soluble in each other, and that the solute (component 2) is at low concentration in 1- and 3- rich phases; but it also applied to systems with partly miscibles non consolute liquids:

23 21

11 33

X X

n k n C

X = X + (C.1)

where Xi j is the molar fraction of the component i in the j−rich phase and k and C are constants.

APPENDIX D: The linear correlation coefficient r

The correlation coefficient r can be computed from

2 2

(x x)(y y) r

(x x) (y y)

− −

=

− −

(D.1) where x is n y / y2 1 of equation (1), y is

2 3

Imagem

Table 1:  Model performance for several ternary systems
Table 2: Model performance for several ternary systems with unusual behavior
Figure 1: Representation of Hand's correlation for some systems in Table 1.
Figure 5: Representation of Hand's correlation for some systems in Table 2.
+3

Referências

Documentos relacionados

Scheme of the experimental procedure to produce and analyse the PDMS liquid droplets and the subsequent solid particles: (1) production of PDMS liquid droplets by using our

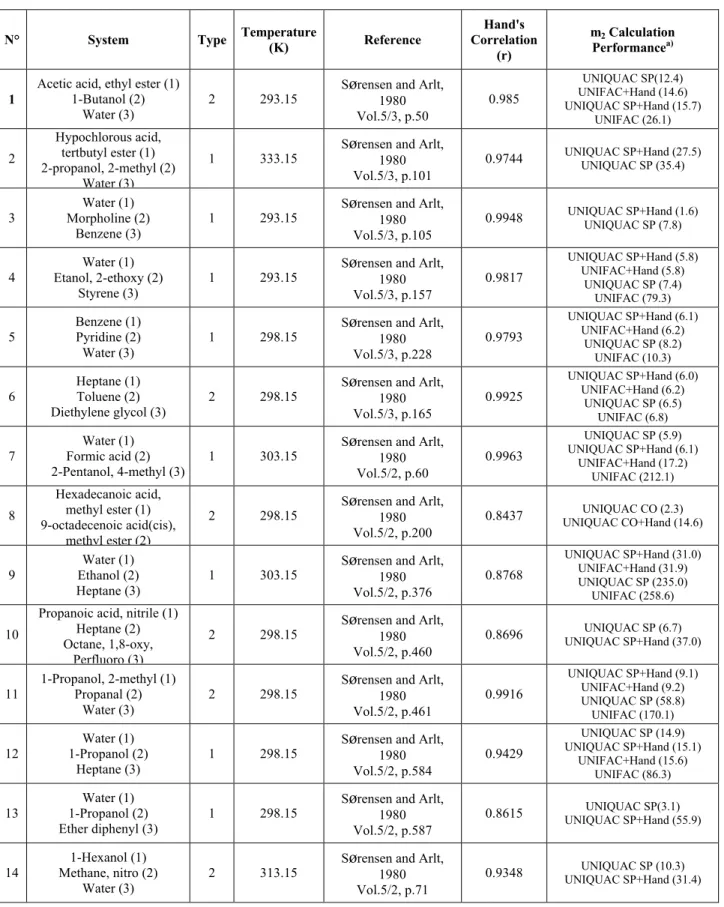
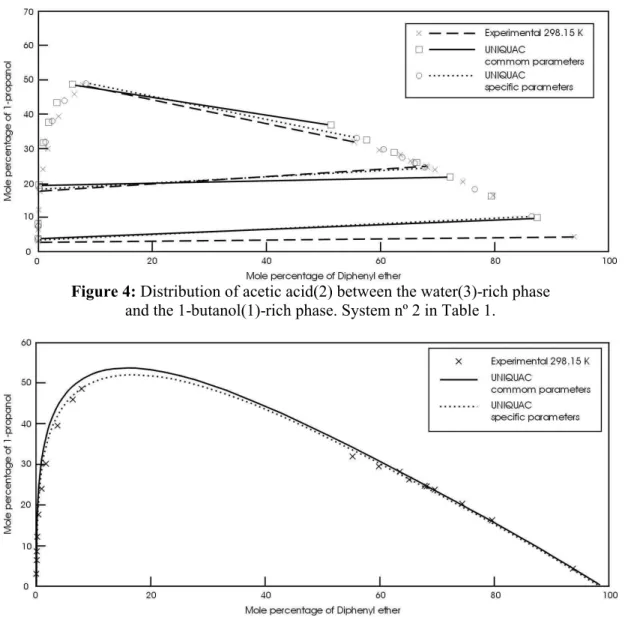
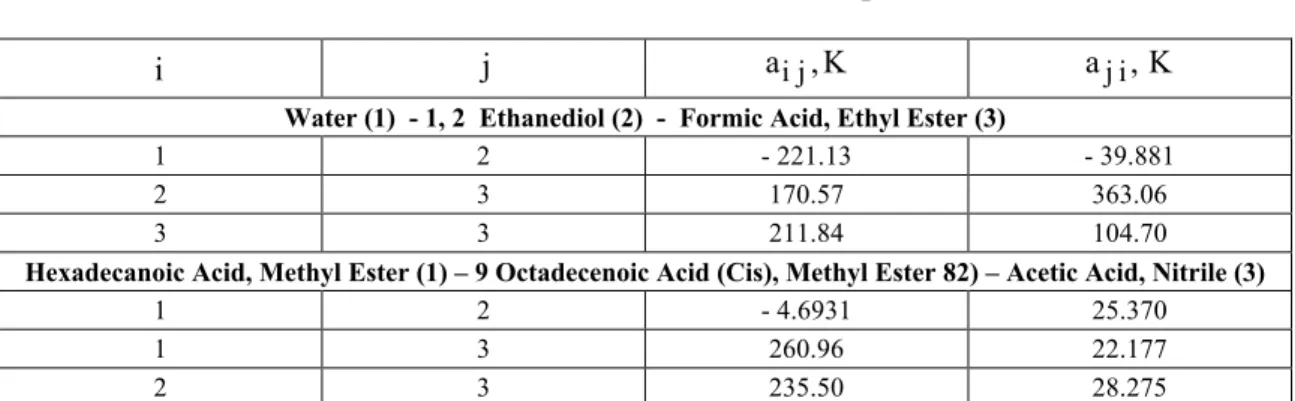
This work aimed to study the application of a stochastic algorithm for LLE modeling with NRTL and UNIQUAC models to correlate the experimental data of

This study reports experimental results and thermodynamic modeling of the liquid-liquid equilibrium of systems composed of soybean oil + monoacylglycerols + diacylglycerols + ethyl

In this context, this work aims to evaluate solubility, in terms of liquid-liquid equilibrium information, for the ternary system involving soybean oil (solute) + ethyl

This work reports a systematic study of the structural and electrical behavior of three ternary phases of the Ta x Mo 1- x S 2 system ( x = 0.55, 0.75 and 0.90) and

(2015) A3, relatou que os idosos que apresentam OA do joelho, também apresentam diminuição na capacidade funcional, isso ocorre por causa da dor, rigidez articular, perda

Acredito que qualquer brasileiro que já se sentiu impotente diante da realidade política brasileira sabe que esta versão do Anteprojeto não resistiu até a versão final

The present study aimed to develop liquid crystalline systems formed with olive oil, through the ternary diagram, investigate the maintenance of liquid crystal in formulations