Viviane Gomes da Costa ABREU1, Marilda Conceição da SILVA2, Rozângela Manfrini MAGALHÃES3,
Dorila PILÓ-VELOSO4, Izelene Felício da Silva XAVIER5, Patrícia Machado OLIVEIRA6, Antônio Flávio de
Carvalho ALCÂNTARA7
ABSTRACT
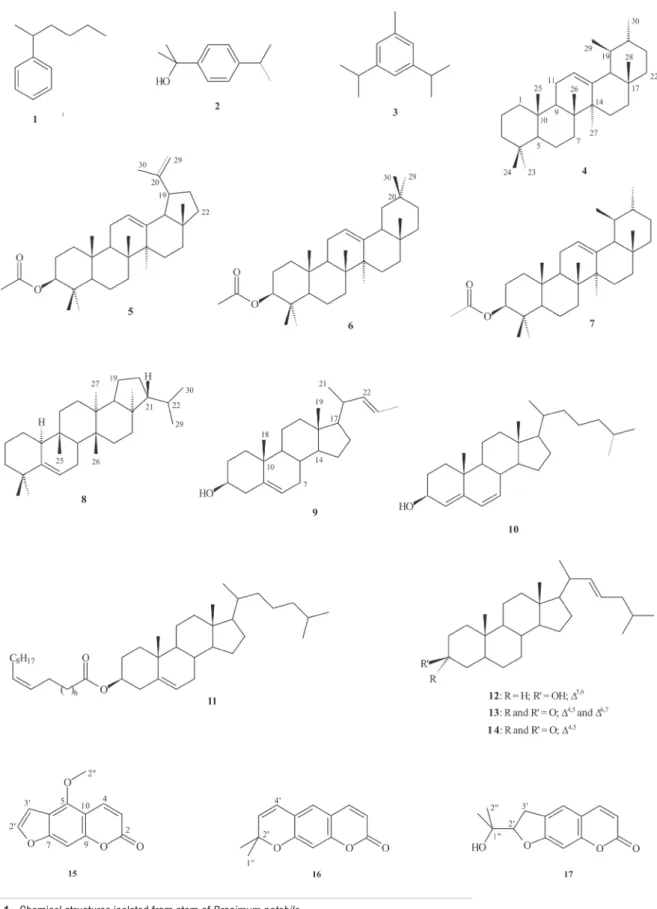
Three coumarins, 5-methoxypsoralene, xanthyletin, and (–)-marmesin, have been isolated from the ethanolic extract of the stem of the Amazonian plant Brosimum potabile. The structures were determined on the basis of NMR analyses and by comparison with spectroscopic data in the literature. The analysis of the hexane fractions by GC-MS in EIMS mode suggested the presence of (1-methylpentyl)-benzene; α,α-dimethyl-4-(1-methylethyl)-benzenemethanol; 1-methyl-3,5-bis(1-methylethyl)-benzene; urs-12-ene; chola-5,22-dien-3β-ol; cholesta-4,6-dien-3β-ol; sitosteryl 9(Z)-octadecenoate; cholesta-5,22-dien-3β-ol; cholesta-4,6,22-trien-3-one; and cholesta-4,22-dien-3-one. NMR data of other hexane fractions indicated the presence of 3β-acetoxy-lup-12,20(29)-diene; 3β-acetoxy-olean-12-ene; 3β-acetoxy-urs-12-ene; and adian-5-ene. All these compounds are first described in B. potabile.
KEYWORDS: Brosimum potabile, coumarins, pentacyclic triterpenes, structural characterization by NMR and GC/MS.
Constituintes químicos do cerne de
Brosimum potabile
(Moraceae)
RESUMO
Três cumarinas, 5-metoxipsoraleno, xantiletina e (–)-marmesina, foram isoladas no extrato etanólico do cerne da planta amazônica Brosimum potabile. Suas estruturas foram determinadas a partir das análises por RMN e por comparação com dados espectroscópicos da literatura. As análises das frações hexânicas por CG/EM sugeriram a presença de (1-metilpentil)-benzeno;
α,α-dimetil-4-(1-metiletil)-benzenometanol; 1-metil-3,5-bis(1-metiletil)-benzeno; urs-12-eno; cola-5,22-dien-3β-ol; colesta-4,6-dien-3β-ol; (9Z)-octadecenoato de sitosterila; colesta-5,22-dien-3β-ol; colesta-4,6,22-trien-3-ona e colesta-4,22-dien-3-ona. Dados de RMN de outras frações hexânicas indicaram a presença de 3β-acetóxi-lup-12,20(29)-dieno; 3β-acetóxi-olean-12-eno; 3β-acetóxi-urs-12-eno e adian-5-eno. Todos esses compostos foram identificados pela primeira vez em B. potabile.
PALAVRAS-CHAVE: Brosimum potabile, cumarinas, triterpenos pentacíclicos, caracterização estrutural por RMN e CG/EM.
1 Departamento de Química, ICEx, Av. Antônio Carlos, 6627 - Pampulha - Belo Horizonte - MG CEP 31270-901, E-mail: [email protected] 2 Departamento de Química, ICEx, Av. Antônio Carlos, 6627 - Pampulha - Belo Horizonte - MG, E-mail: [email protected]
3 Departamento de Química, ICEx, Av. Antônio Carlos, 6627 - Pampulha - Belo Horizonte - MG, E-mail: [email protected] 4 Departamento de Química, ICEx, Av. Antônio Carlos, 6627 - Pampulha - Belo Horizonte - MG, E-mail: [email protected] 5 Departamento de Química, ICE, AV. General Rodrigo Octávio Jordão Ramos, 3000 - Coroado, E-mail: [email protected]
6 Departamento de Química, FACET, Campus JK, Rodovia MGT 367 - Km 583, nº 5000 Alto da Jacuba, Diamantina/MG, E-mail: [email protected]
7 Universidade Federal de Minas Gerais, Depar tamento de Química, ICEx, Av. Antônio Carlos, 6627 - Pampulha - Belo Horizonte – MG, CEP 31270-901,
INTRODUCTION
Plants of the Brosimum (Moraceae) (Oliveira and Amaral 2004) genus are largely found in firm land regions of the Amazon forest (Correia 1978). Extracts from stem bark of Brosimum species, which are used as a nervous system stimulant in folk medicine, have also shown anti-syphilic, anti-inflammatory, and antirheumatic activities (Garret and Grishan 1988, Shultes and Foreword 1992). Several chemical compound classes have been isolated from Brosimum species: flavans (Torres et al. 1997; Teixeira et al. 2000), steroids, coumarins (Okahara 1936, Gottlieb et al. 1972), terpenes, benzophenone, xantones, tannins, saponines, alkaloids, and polyphenols (Filho et al. 1972). Brosimum potabile is popularly known as “amapá-doce” and largely used in Amazon region as medicinal extract (Berg 1972, Barroso 1978). But only few studies have been described about this species. We have previously investigated extract of its stem and 1-diaril-heptanoid (centrolobin), sitosterol, and stigmasterol were isolated (Alcântara et al. 2000).
In the present work we described a more exhaustive phytochemical investigation of the stem of Brosimum potabile. As consequence 17 compounds were characterized by IV, NMR (1D and 2D), and GC/MS analyses which were firstly described in this species.
PHYTOCHEMICAL PROCEDURE
General methods
Uncorrected melting points were determined using METTLER equipment, model FP82. FTIR spectra were determined in KBr disk on a FTIR Perkin Elmer Spectrum 200 spectrometer. GC/MS spectra were obtained on a Perkin Elmer - Auto System chromatographer coupled to a Perkin Elmer - Q-Mass 910 mass spectrometer (70 eV, 30 m/0.2 nm methyl silicone fused silica column, helium gas, draw speed: 1.5 mL/min).The sample components were identified based on software comparison of mass spectra fragmentation patterns with those of the Wiley Library Database Version 2005 (New York, USA). Retention time (RT) is given in minutes. Chromatographic purification was carried out on silica gel (70-230 Mesh), alumina, and Sephadex LH-20. A mixture of silica gels 60F254 and 60G (1:3) was used in thin layer chromatographic analysis.
1H and 13C NMR spectra were measured on a Bruker
DRX 400 – AVANCE spectrometer, with inverse probes and field gradient operating at 400.129 and 100.613 MHz, respectively. The samples were dissolved in 0.75 mL CDCl3 and transferred to a 5-mm NMR tube; TMS was used as an internal reference (δ= 0.00). Chemical shifts are given in the
δ-scale (ppm) and coupling constants, J, in Hz. Experiments were carried out using pulse sequences and programs provided
by the manufacturer. One-dimensional (1D) 1H and 13C
NMR spectra were acquired under standard conditions by using a direct detection 5-mm 1H/13C dual probe. Standard
pulse sequences were used for two-dimensional (2D) homonuclear and heteronuclear shift correlation spectra by using a multinuclear, inverse detection, 5-mm probe with field gradient at z axis.
Plant material
A Brosimum potabile sample was collected in November 1999 at the Adolpho Ducke Reserve, Manaus, Brazil. A voucher specimen of Brosimum potabile has been deposited at the herbarium of the Instituto Nacional de Pesquisas da Amazônia (INPA-Manaus), under the code 105.994. The plant was identified by S. S. da Silva (Departamento de Botânica, Universidade Federal do Amazonas) and later confirmed by Dr. J. E. L. da Silva and C. A. C. Ferreira (Departamento de Botânica, Herbário do INPA).
Extraction and isolation
The collected plant was dried at room temperature and triturated. The powered material (2.4 kg) was submitted to extraction in hexane and EtOH at room temperature, furnishing hexanic (EH; 100.5 g) and ethanolic (EE; 430.0 g) extracts, respectively. EH was submitted to column chromatography (CC) using silica gel as the stationary phase (CCS) and eluted with hexane, CH2Cl2, EtOAc, EtOH, and MeOH mixtures in increasing polarity order. The chromatographic fractionation of EH was followed by thin layer chromatography (TLC) and similar fractions were grouped. Group 3 (eluted with hexane) was obtained as a colorless liquid (6 mg) and identified as mixture of 1 to 3. Group 7 (eluted with hexane and dichloromethane 9:1) was submitted to CCS fractionation eluted with hexane/CH2Cl2 in gradient. The fraction eluted with hexane/CH2Cl2 (8:2) was recrystallized in EtOH, afforded a white solid (compound 4, 3 mg). Group 8 (eluted with hexane/CH2Cl2 6:4) was rechromatographed in silica gel with a gradient hexane/ CH2Cl2. The fractions obtained with hexane/CH2Cl2 7:3 were recrystallized in EtOH yielded a white solid (21 mg) identified as a mixture of compounds 5 to 8.
Group 11 (eluted hexane/CH2Cl2) was submitted to CCS fractionation eluted with hexane/CH2Cl2 in gradient. The fractions eluted with CH2Cl2 were recrystallized in EtOH, providing a white solid (7 mg) identified as a mixture of compounds 9 to 13. Group 13 (eluted with CH
2Cl2/EtOAc
9.5:0.5) was submitted to CCS fractionation eluted with hexane/CH2Cl2 in gradient. The fractions obtained with CH2Cl2 were purified by recrystallization in EtOH, afforded a white solid (3 mg) identified as compound 14. EE was
The chromatographic fractionation of EE was followed by TLC and similar fractions were grouped. Group 2 was eluted in CH2Cl2, providing a white solid. This solid was submitted to CCS and eluted with gradient of hexane/CH2Cl2. Fractions obtained with hexane/CH2Cl2 3:7 were grouped and recrystallized in hexane, yielded a white solid (18 mg) identified as compound 15. Group 5 (eluted with CH
2Cl2)
afforded a light yellow solid after washing with MeOH (compound 16, 45.7 mg). Group 8 (eluted with CH
2Cl2/
EtOAc1:1) was submitted to CC using Sephadex LH-20 as a stationary phase and MeOH as eluent. Fractions 8 and 9 were grouped and submitted to CC using neutral alumina as the stationary phase and eluted with CH2Cl2 afforded a white solid (Compound 17, 5.7 mg).
Mixture of compounds 1 to 3: (1-methylpentyl)-benzene,
α,α-dimethyl-4-(1-methylethyl)-benzenemethanol, and 1-methyl-3,5-bis(1-methylethyl)-benzene, respectively. GC/ MS (EI, 70 eV) RT= 3.42 min, m/z 162 [M+], 105 (base peak),
91, 77, 41, and 29; RT= 5.45 min, m/z 178 [M+], 163, 145,
121, 105, and 43 (base peak); RT= 9.16 min, m/z 161, 147, 133, 119, 105, 91, 77, and 43 (base peak).
Compound 4: urs-12-ene. GC/MS (EI, 70 eV) RT =
20.81 min, m/z 498, 406, 392, 296, 218, 203, 191, 179, 165, 151 (base peak), 133, 115, 84, and 58.
Mixture of compounds 5 to 8: 3β
-acetoxy-lup-12,20(29)-diene, 3β-acetoxy-olean-12-ene, 3β-acetoxy-urs-12-ene, and adian-5-ene, respectively. See Table 1 for NMR data.
Mixture of compounds 9 to 13: chola-5,22-dien-3β
-ol, cholesta-4,6-dien-3β-ol, sitosteryl 9(Z)-octadecenoate, cholesta-5,22-dien-3β-ol, and cholesta-4,6,22-trien-3-one, respectively. GC/MS (EI; 70 eV) RT = 24.40 min, m/z 255, 207, 189, 159 (base peak), 145, 131, 122, 119, 109, and 105; RT = 25.81 min, m/z 394, 275, 211, 191, 177, 157, 143 (base peak), 135, 129, 119, and 105; RT = 26.02 min, m/z 396, 288, 275, 255, 213, 195, 177, 159, 147, 140 (base peak), 128, 119, and 105; RT = 28.20 min, m/z 413, 394, 369, 351, 314, 300, 283, 271, 255, 213, 189, 173, 159, 147, 133, 119, 105 (base peak), 95, 81, 69, 55, and 41; RT = 29.05 min, m/z 414, 396, 381, 329, 303, 273, 255, 213, 159, 145, 133, 121, 107, 95, 81, 69, 55, and 43 (base peak); RT= 30.49 min, m/z 270, 255, 227, 207, 175, 159, 147, 133, 119, 105, 95, 81, 69 (base peak), and 55.
Compound 14: cholesta-4,22-dien-3-one. GC/MS (EI;
70 eV) RT = 3.62 min, m/z 423, 411, 395, 367, 312, 298, 269, 245, 218, 175, 161, 147, 135, 123, 107 (base peak), 95, 81, 69, and 55.
Compound 15: 5-methoxypsoralen. M.p.: 142.0-145.0 oC. IR (KBr, cm-1) v
max 3220, 3163, 3151, 3077, 2955, 1765,
1593, 1494, 1366, 1180, 1058, 939, and 809. 1H NMR (400
MHz; CDCl3; ppm)δH 8.16 (d, J= 8.9 Hz; H-4), 7.60 (d, J=
2.4 Hz; H-2’), 7.13 (s; H-8), 7.02 (d, J= 2.4 Hz; H-3’), 6.28 (d, J= 8.9 Hz; H-3), 4.30 (s; H-2”). 13C NMR (100 MHz;
CDCl3; ppm)δC 161.2 (C-2), 158.4 (C-7), 152.5 (C-9), 149.6
(C-5), 144.8 (C-2’), 139.2 (C-4), 113.1 (C-6), 112.5 (C-3), 106.4 (C-10), 105.0 (C-3’), 93.8 (C-8), and 60.1 (C-2”).
Compound 16: xanthyletin. M.p.: 162.0-164.0 oC. IR
(KBr, cm-1) v
max3000-2200, 2900-2800, 1695, 1610, 1550,
1440, 1360, 1270, 1130, 1010, 980, and 815. 1H NMR (400
MHz; CDCl3; ppm)δH 7.57 (d, J= 9.5 Hz; H-4), 7.04 (s; H-5), 6.72 (s; H-8), 6.34 (d, J= 9.9 Hz; H-4’), 6.21 (d, J=9.5 Hz; H-3), 5.68 (d, J= 9.9 Hz; H-3’), and 1.47 (s; H-1”). 13C
NMR (100 MHz; CDCl3;ppm)δC 161.2 (C-2), 156.9 (C-7), 155.5 (C-9), 143.3 (C-4), 131.2 (C-3’), 124.8 (C-5), 120.8 (C-4’), 118.5 (C-6), 113.1 (C-3), 112.7 (C-10), 104.4 (C-8), 77.7 (C-2’), and 28.4 (C-1”/2”).
Compound 17: (–)-marmesin. M.p.: 123.4-127.0 oC. IR
(KBr; cm-1) v
max 3400-2600, 1710, 1615, 1555, 1480, 1395,
1360, 1275, 1150, 1125, 920, 895, and 820. 1H NMR (400
MHz; CDCl3; ppm)δH 7.59 (d, J= 9.6 Hz; H-4), 7.22 (s; H-5), 6.74 (s; H-8), 6.21 (d, J= 9.6 Hz; H-3), 4.74 (t, J= 8.9 Hz; H-2’), 3.20 (m; H-3’), 1.67 (s; OH), 1.37 (s; H-2”a), and 1.24 (s; H-2”b). 13C NMR (100 MHz; CDCl
3; ppm) δC
163.2 (C-7), 161.4 (C-2), 156.0 (C-9), 143.7 (C-4), 125.0 (C-6), 123.4 (C-5), 112.8 (C-10), 112.3 (C-3), 91.1 (C-2’), 71.7 (C-1”), 29.5 (C-3’), 26.1 (C-2”b), and 24.3 (C-2”a).
RESULTS AND DISCUSSION
The GC chromatogram of the Group 3 in hexane showed three peaks with RT = 3.42, 5.45, and 9.16 min. MS data bank suggested structures with the respective indices of similarity given in parenthesis (1-methylpentyl)-benzene (1) (90%),
α,α-dimethyl-4-(1-methylethyl)-benzenemethanol (2) (69%),
and 1-methyl-3,5-bis(1-methylethyl)-benzene, (3) (75%),
respectively. The GC chromatogram of the Group 7 showed a peak with RT = 20.81 min. MS data bank suggested the triterpene pentacyclic urs-12-ene (4) (68%).
The 1H NMR spectrum of the Group 8 in hexane showed
several signals from δH 5.25 to 4.43, which were attributed to hydrogen atoms of alkenyl and carbinolic groups. The signals at δH 2.36 to 0.76 were attributed to aliphatic hydrogen atoms. The 13C NMR spectra and DEPT 135° subspectra
spectrum (shown in Table 1) matched the values reported in the literature for triterpenes 3β-acetoxy-lup-12,20(29)-diene (5), 3β-acetoxy-olean-12-ene (6), 3β-acetoxy-urs-12-ene (7),
and adian-5-ene (8).
The GC chromatogram of the Group 11 in hexane showed six peaks (RT = 24.40, 25.81, 26.02, 28.20, 29.05, and 30.49 min). The structure of chola-5,22-dien-3β-ol (9) (54%), cholesta-4,6-dien-3β-ol (10) (70%), sitosteryl
9(Z)-octadecenoate (11) (73%), cholesta-5,22-dien-3β-ol
(12) (69%), and cholesta-4,6,22-trien-3-one (13) (63%),
respectively, were suggested by EIMS fragmentation data matching with Wiley library databases with the respective indices of similarity given in parenthesis. Similarly, the structure of cholesta-4,22-dien-3-one (14) (69%) was
suggested for the Group 13 in hexane (RT = 3.62 min). Structural analysis of the Group 2 in ethanol was based on NMR data. The 1H NMR spectrum showed two doublet
signals at δH 6.28 (1H; J = 8.9 Hz) and 8.16 (1H; J = 8.9 Hz). These signals were attributed to hydrogen atoms of conjugated double linking with carbonyl group. Two doublet signals at dH 7.60 (1H; J = 2.4 Hz) and 7.02 (1H; J = 2.4 Hz) were also attributed to aromatic hydrogen atoms in vicinal carbons atoms. The singlet signal at δH 7.13 (1H) was attributed to an aromatic hydrogen atom distant from the others. The singlet signal at δH 4.30 was attributed to the hydrogen atom of the methoxyl group. The 13C NMR spectrum showed signals at δ
C
161.2, 158.4, 149.6, and 106.4, which corresponded to non-hydrogenated carbon atoms. The signals at δC 144.8, 139.2, 112.5, 105.0, and 93.8 corresponded to mono-hydrogenated carbon atoms. The signal at δC 60.1 was attributed to the carbon atom of the methoxyl group. The 1D NMR spectra are characteristic of furocoumarin structures (Steck and Zazurek 1972). The 1H-1H COSY contour map showed correlations
between signals at δH 8.16 (H-4) and 6.28 (H-3), as well as between signals at δH 7.60 (H-2’) and 7.02 (H-3’). The
1H-13C HMBC contour map showed correlations between
the hydrogen signal at δH 8.16 (H-4) and the carbon signals at
δC 161.2 (C-2) and 149.6 (C-5). The hydrogen signal at 7.60 (H-2’) correlated with carbon signals at δC 158.4 (C-7) and 112.5 (C-6). The hydrogen signal at dH 7.13 (H-8) correlated with carbon signals at δC 158.4 (C-7), 112.5 (C-6), and 106.4 (C-10). The hydrogen signal at δH 7.02 (H-3’) correlated with carbon signals at δC 158.4 (C-7), 144.8 (C-2’), and 112.5 (C-6). The hydrogen signal at dH 6.28 (H-3) correlated with carbon signals at δC 161.2 (C-2) and 106.4 (C-10). The hydrogen signal at dH 4.30 (H-2”) correlated with a carbon signal at δC 149.6 (C-5), indicating the localization of the methoxyl group in the coumarinic skeleton. These HMBC correlations agree with 5-methoxypsoralen (15), a coumarin
previously isolated from Brosimum acutifolium (Xavier 2001) and Brosimum gaudichaudii (Okahara 1936).
Structural analysis of the Group 5 in ethanol was based on NMR data. The 1H NMR spectrum showed two doublet
signals at δH 7.57 (1H; J = 9.5 Hz) and 6.21 (1H; J = 9.5
Hz). These signals were attributed to hydrogen atoms of conjugated double bond with carbonyl group. Two doublet signals at δH 6.34 (1H; J = 9.9 Hz) and 5.68 (1H; J = 9.9
Hz) were also attributed to alkenyl hydrogen atoms on vicinal carbon atoms. The singlet signals at δH 7.04 (1H) and 6.72
were attributed to aromatic hydrogen atoms distant from others. The singlet signal at δH 1.47 (6H) was attributed to
hydrogen atoms of two methyl groups. 13C NMR spectrum
showed signals at δC 161.2, 156.9, 155.5, 118.5, 112.7, and
77.7 which corresponded to non-hydrogenated carbon atoms. The signals at δC 143.3, 131.2, 124.8, 120.8, 113.1, and
104.4 corresponded to mono-hydrogenated carbon atoms. The signal at δC 28.4 was attributed to two carbon atoms of
the methyl groups. The 1D NMR spectra are characteristic of pyrancoumarin structures (Steck and Mazurek 1972). The 1 H-1H COSY contour map showed correlations between signals
at δH 7.57 (H-4) and 6.21 (H-3) as well as between signals at
δH 6.34 (H-4’) and 5.68 (H-3’). The 1H-13C HMBC contour
map showed correlations between the hydrogen signal at δH
7.57 (H-4) and the carbon signals at δC 161.2 (C-2), 155.5
(C-9), and 124.8 (C-5). The hydrogen signal at 7.04 (H-5) correlated with the carbon signals at δC 156.9 (C-7), 155.5
(C-9), 143.3 (C-4), and 120.8 (C-6). The hydrogen signal at
δH 6.72 (H-8) correlated with the carbon signals at δC 156.9
(C-7), 155.5 (C-9), and 118.5 (C-6). The hydrogen signal at δH 6.34 (H-4’) correlated with carbon signals at δC 156.9
(C-7), 124.8 (C-5), and 77.7 (C-2’). The hydrogen signal at
δH 6.21 (H-3) correlated with the carbon signals at δC 161.2
(C-2) and 112.7 (C-10). The hydrogen signal at δH 5.68
(H-3´) correlated with the carbon signals at δC 118.5 (C-6),
77.7 (C-2’), and 28.4 (C-1”/2”). The hydrogen signal at δH
1.47 (H-1”/2”) correlated with the carbon signals at δC 131.2
(C-3’) and 77.7 (C-2’). All these HMBC correlations match xanthyletin (16) (Lee et al. 2006), a coumarin previously
isolated from Brosimum gaudichaudii (Okahara 1936). Structural analysis of the Group 8 in ethanol was also based on NMR data. The 1H NMR spectrum showed two
doublet signals at δH 7.60 (1H; J = 9.6 Hz) and 6.19 (1H; J = 9.60 Hz). These signals were attributed to hydrogen atoms of conjugated double bond with carbonyl group. The triplet signal at δH 4.72 (1H; J = 8.9 Hz) and the multiplet signal at
δH 3.19 (2H) were attributed to hydrogen atoms on vicinal carbon atoms. The other hydrogen signals, δH 7.19 (H-5) and δH 6.74 (H-8), were singlet. The 13C NMR spectrum
and 24.3 corresponded to two methyl groups. The 1D NMR spectra are also characteristic of prenylated coumarin structures (Steck and Mazurek 1972). The 1H-1H COSY
contour map showed correlations between δH 7.60 (H-4) and
6.19 (H-3), as well as between δH 4.72 2’) and 3.19
(H-3’). The HMBC contour map showed correlations between the hydrogen signal at δH 7.60 (H-4) and carbon signals at
δC 161.4 (C-2), 156.2 (C-9), 123.4 (C-5), and 112.8 (C-10).
The hydrogen signal at δH7.19 (H-5) correlated with carbon
signals at δC 163.2 (C-7), 156.2 (C-9), 143.7 (C-4), 112.8
(C-10), and 29.5 (C-3’). The hydrogen signal at δH 6.74 (H-8)
correlated with carbon signals at δC 163.2 (C-7), 156.2 (C-9),
125.0 (C-6), and 112.8 (C-10). The hydrogen signal at δH
6.19 (H-3) correlated with carbon signals at δC 161.4 (C-2)
and 112.80 (C-10). The hydrogen signal at δH 4.72 (H-2’)
correlated with carbon signals at δC 26.1 (C-2”a) and 24.3
(C-2”b). The hydrogen signal at δH 3.19 (H-3’) correlated with
carbon signals at δC 163.2 (C-7), 125.0 (C-6), 123.4 (C-5),
91.1 (C-2’), and 71.7 (C-1”). The hydrogen signals at δH 1.36
(H-2”b) and 1.22 (H-2”a) correlated with carbon signals at
δC 91.1 (C-2’), 71.7 (C-1”), 26.1 (C-2”a), and 24.3 (C-2”b).
All these HMBC correlations agree with (–)-marmesin (17)
(Liu et al. 2005), a prenylated coumarin previously isolated from Brosimum gaudichaudii(Okahara 1936).
ACKNOWLEDGEMENTS
The authors thank Conselho Nacional de Desenvolvimento Científico e Tecnológico (CNPq), Fundação Coordenação de Aperfeiçoamento de Pessoal de Nível Superior (CAPES), Fundação de Amparo à Pesquisa do Estado de Minas Gerais (FAPEMIG), and Fundação de Amparo à Pesquisa do Estado do Amazonas (FAPEAM) for the financial support.
LITERATURE CITED
Alcântara, A.F.C.; Souza, M.R.; Piló-Veloso, D. 2000. Constituents of Brosimum potabile. Fitoterapia, 71: 613-615.
Barroso, M.G. 1978. Sistemática de Angiospermas do Brasil. Livros Técnicos e Científicos, São Paulo, Brasil, 200 pp.
Berg, C.C. 1972. Brosimeae (Moraceae) in Flora Neotropica 7: 161-225.
Braz Filho, R.; Magalhães, A.F.; Gottlieb, O.R. 1972. Coumarins from [the heartwood of ] Brosimum rubescens: Chemistry of Brazilian Moraceae, Part 3. Phytochemistry, 11: 3307-3310. Garret, R.H.; Grishan, C.M. 1988. Biochemistry. Saunders College
Publishing, Orlando, USA, 300 pp.
Gottlieb, O.R.; Silva, M.L.; Maia, J.G.S. 1972. Distribution of coumarins in Amazonian Brosimum species. Phytochemistry, 11: 3479-3480.
Shin, B.-K.; Kim, H.M.; Lee, S.; Han, J. 2008. Axial Conformation of 3-Methyl-2-butenoyl Group in Pyranocoumarin Ring Endows Biological Activity of (+)-Decursin. Bulletin of the Korean Chemical Society, 29: 1572-1574.
Liu, R.; Sun, Q.; Shi, Y.; Kong, L. 2005. Isolation and purification of coumarin compounds from the root of Peucedanum decursivum (Miq.) Maxim by high-speed counter-current chromatography. Journal of Chromatography A, 1076: 127-132.
Mahato, S.B.; Kundu, A.P. 1994. 13C NMR spectra of pentacyclic triterpenoids – a compilation and some salient features. Phytochemistry, 37: 1517-1575.
Okahara, K. 1936. Studies on the Chemical Constituents of the Leaves of Ficus microcarpa Linn. Bulletin of the Chemical Society of Japan, 11: 389-394.
Olea, R.S.G; Roque, N.F. 1990. Análise de misturas de triterpenos por RMN de 13C. Química Nova, 13: 278-281.
Oliveira, A.N.; Amaral, I.L. 2004. Florística e fitossociologia de uma floresta de vertente na Amazônia Central, Amazonas, Brasil. Acta Amazonica, 34: 21-34.
Table 1 - Carbon chemical shifts registered on the 13C NMR spectra of 8, 9, 10,
and 11 and corresponding values (in parenthesis) registered in the literature (Mahato and Kundu 1994)
Carbon Pentacyclic triterpene
8 9 10 11
Pio Correia, M. 1978. Dicionário de Plantas Úteis do Brasil e das Exóticas Cultivadas. Ministério da Agricultura, IBDF, Imprensa Nacional, Rio de Janeiro, Brasil, 500 pp.
Schultes, R.E.; Foreword, R.F.R. 1992. Medicinal and Toxic Plants of the Northwest Amazonia. Dioscorides Press, Portland, USA, 250 pp.
Steck, W.; Mazurek, M. 1972. Identification of Natural Coumarins by NMR Spectroscopy. Lloydia, 35: 418-439,
Teixeira, A.F.; Alcântara, A.F.C.; Piló-Veloso, D. 2000. Structure determination by 1H and 13C NMR of a new flavan isolated from Brosimum acutifolium: 4’,7-dihydroxy-8-prenylflavan. Magnetic Resonance in Chemistry, 38: 301-304.
Torres, S.L.; Moneiro, J.C.M.; Arruda, M.S.P.; Müller, A.H.; Arruda, A.C.; 1997. Two flavans from Brosimum acutifolium. Phytochemistry, 44: 347-349.
Xavier, I.F.S. 2001. Estudo Fitoquímico do Caule de Brosimum acutifolium. Dissertação de Mestrado, Universidade Federal do Amazonas, Manaus, Amazonas. 184 pp.